Back in April 2018, I had the priviledge of sharing about Avalonia UI app development with the Singapore .NET Developers Community. At the time, Avalonia was still in its early stages, exclusively tailored for the creation of cross-platform desktop applications. Fast forward to the present, five years since my initial adventure to Avalonia, there is a remarkable transformation in this technology landscape.
In this artlcle, I will share about my new development experience with Avalonia UI.
About Avalonia UI
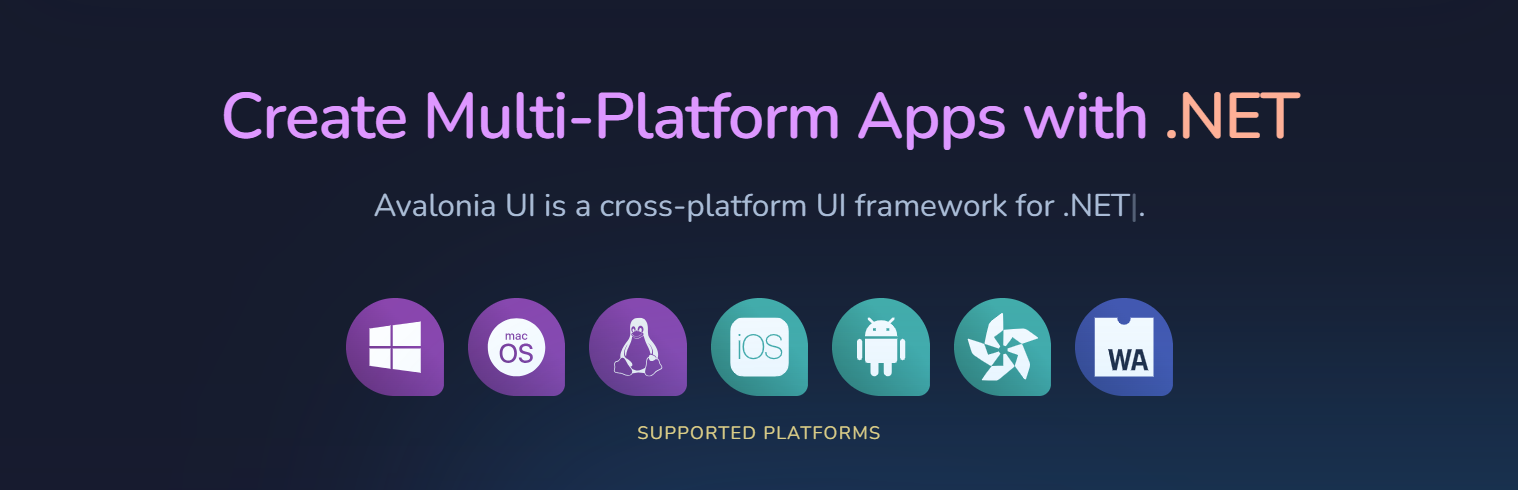
Avalonia UI, one of the .NET Foundations projects, is an open-source, cross-platform UI framework designed for building native desktop apps. It has been described as the spiritual successor to WPF (Windows Presentation Foundation), enabling our existing WPF apps to run on macOS and Linux without expensive and risky rewrites.
Hence, for WPF developers, they will find the transition to Avalonia relatively smooth because they can apply their knowledge of XAML and WPF design patterns to create UI layouts in Avalonia easily. With Avalonia, they can reuse a significant portion of their existing WPF code when developing cross-platform apps. This reusability can save time and effort in the development process.
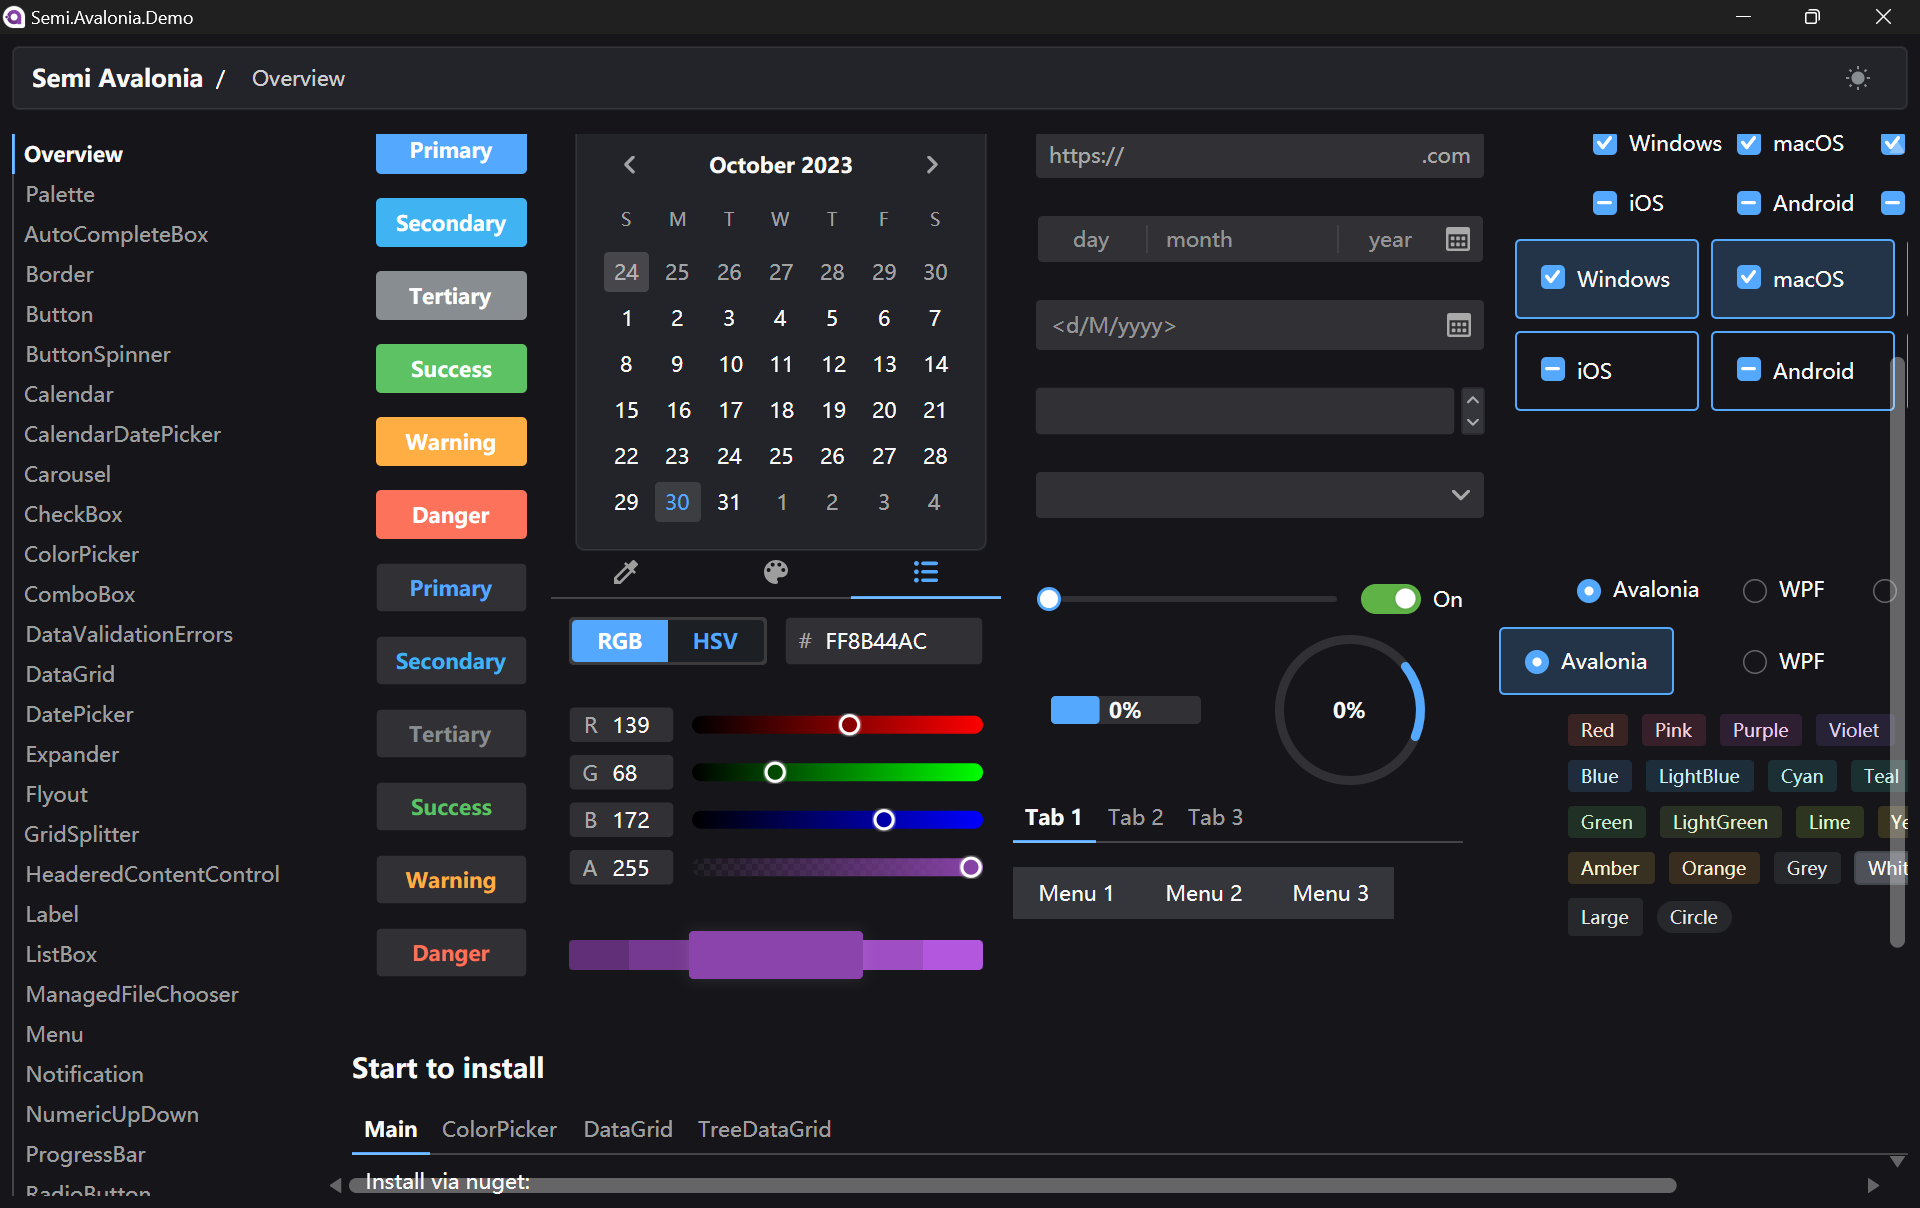
Semi.Avalonia is a theme inspired by Semi Design, a design system designed and currently maintained by Douyin. The reason why I chose Semi.Avalonia is because there is a demo app which demonstrating all of the general controls and styles available to develop Avalonia apps.
There is a demo executable available for us to play around with Semi Avalonia Themes.
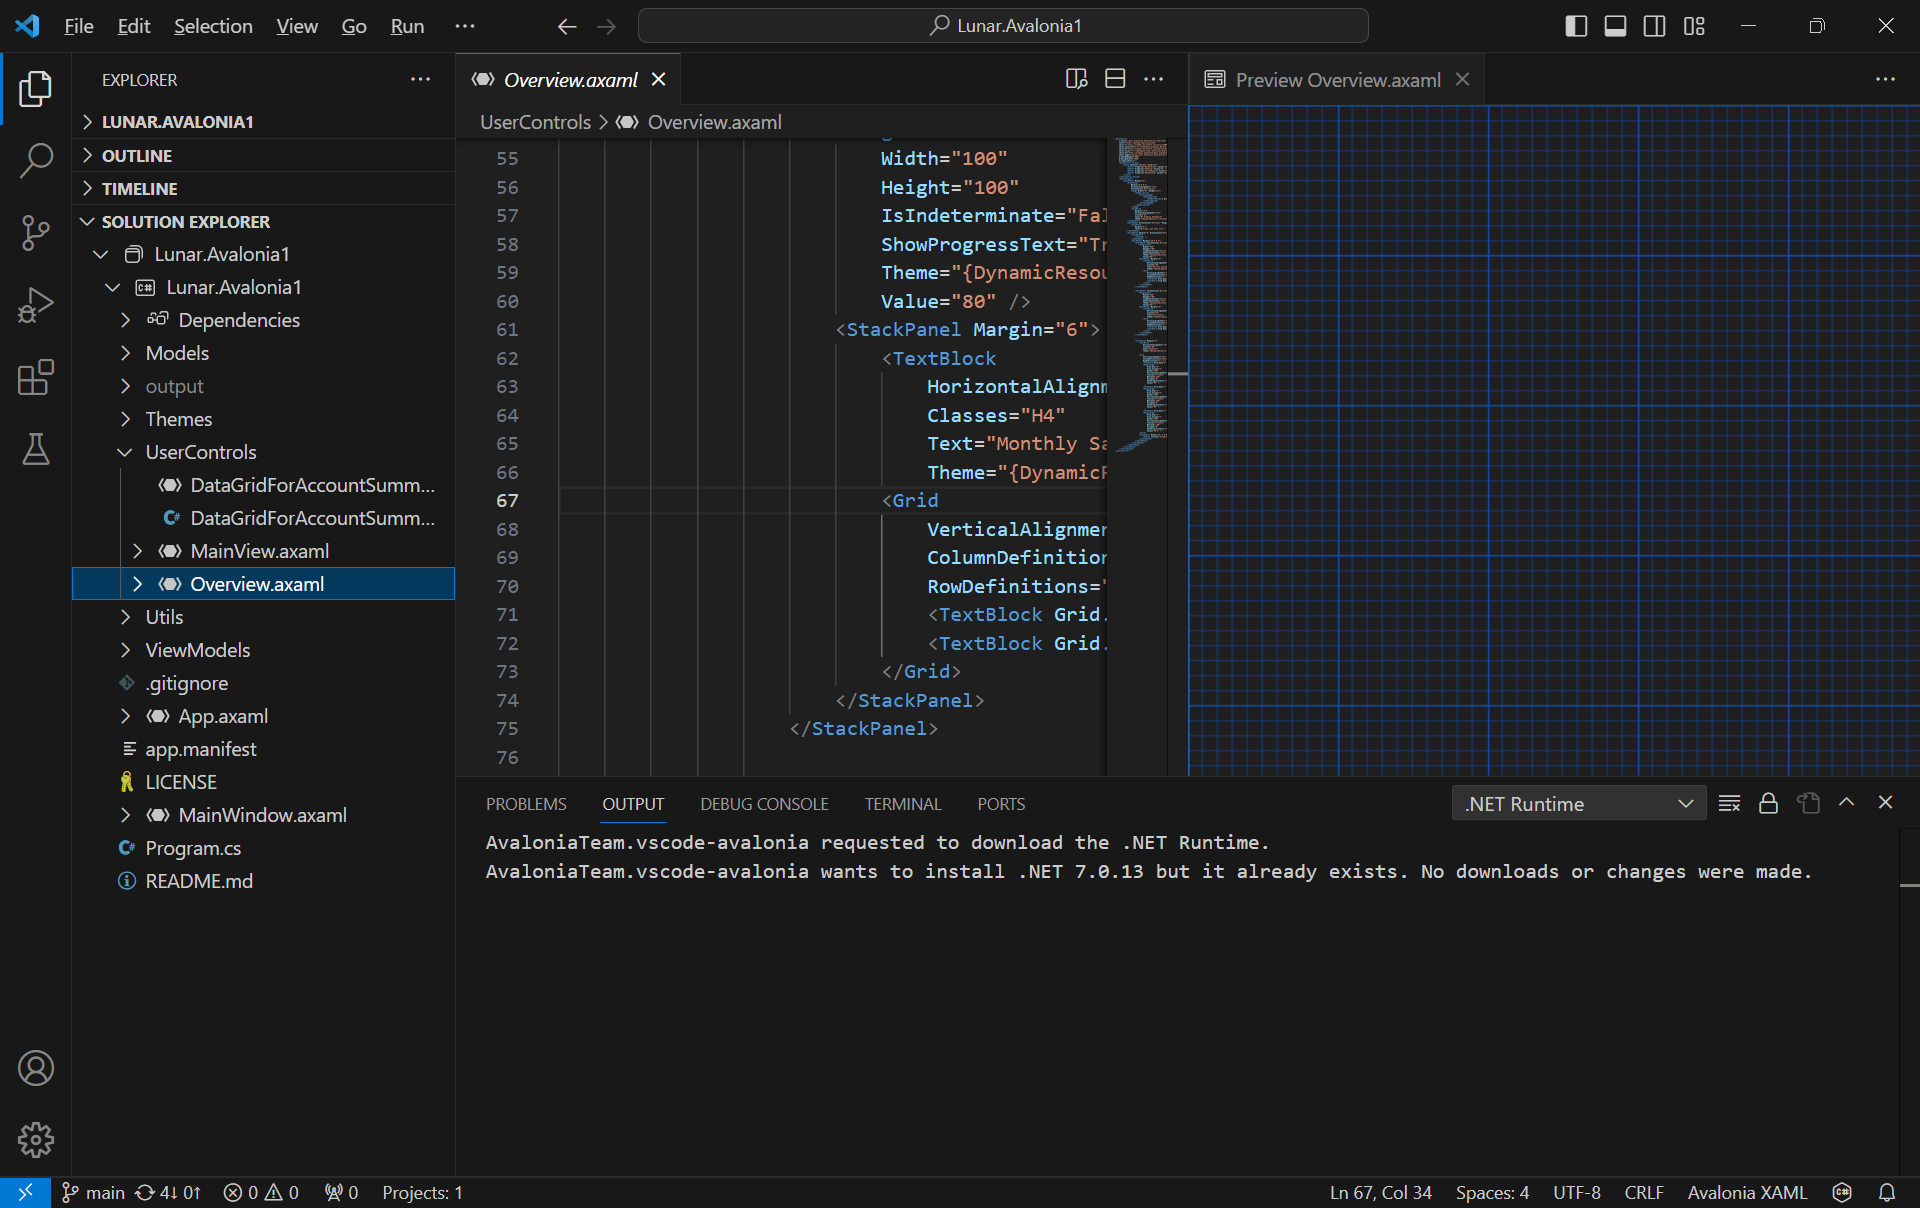
The Avalonia XAML Previewer offers real-time visualisation of XAML code. With this capability, developers can deftly craft and refine user interfaces, swiftly pinpoint potential issues, and witness the immediate effects of their alterations.
Unlike Visual Studio, VS Code will reuse the single preview window. Hence, the previewer will refresh everytime when we switch between multiple XAML files.
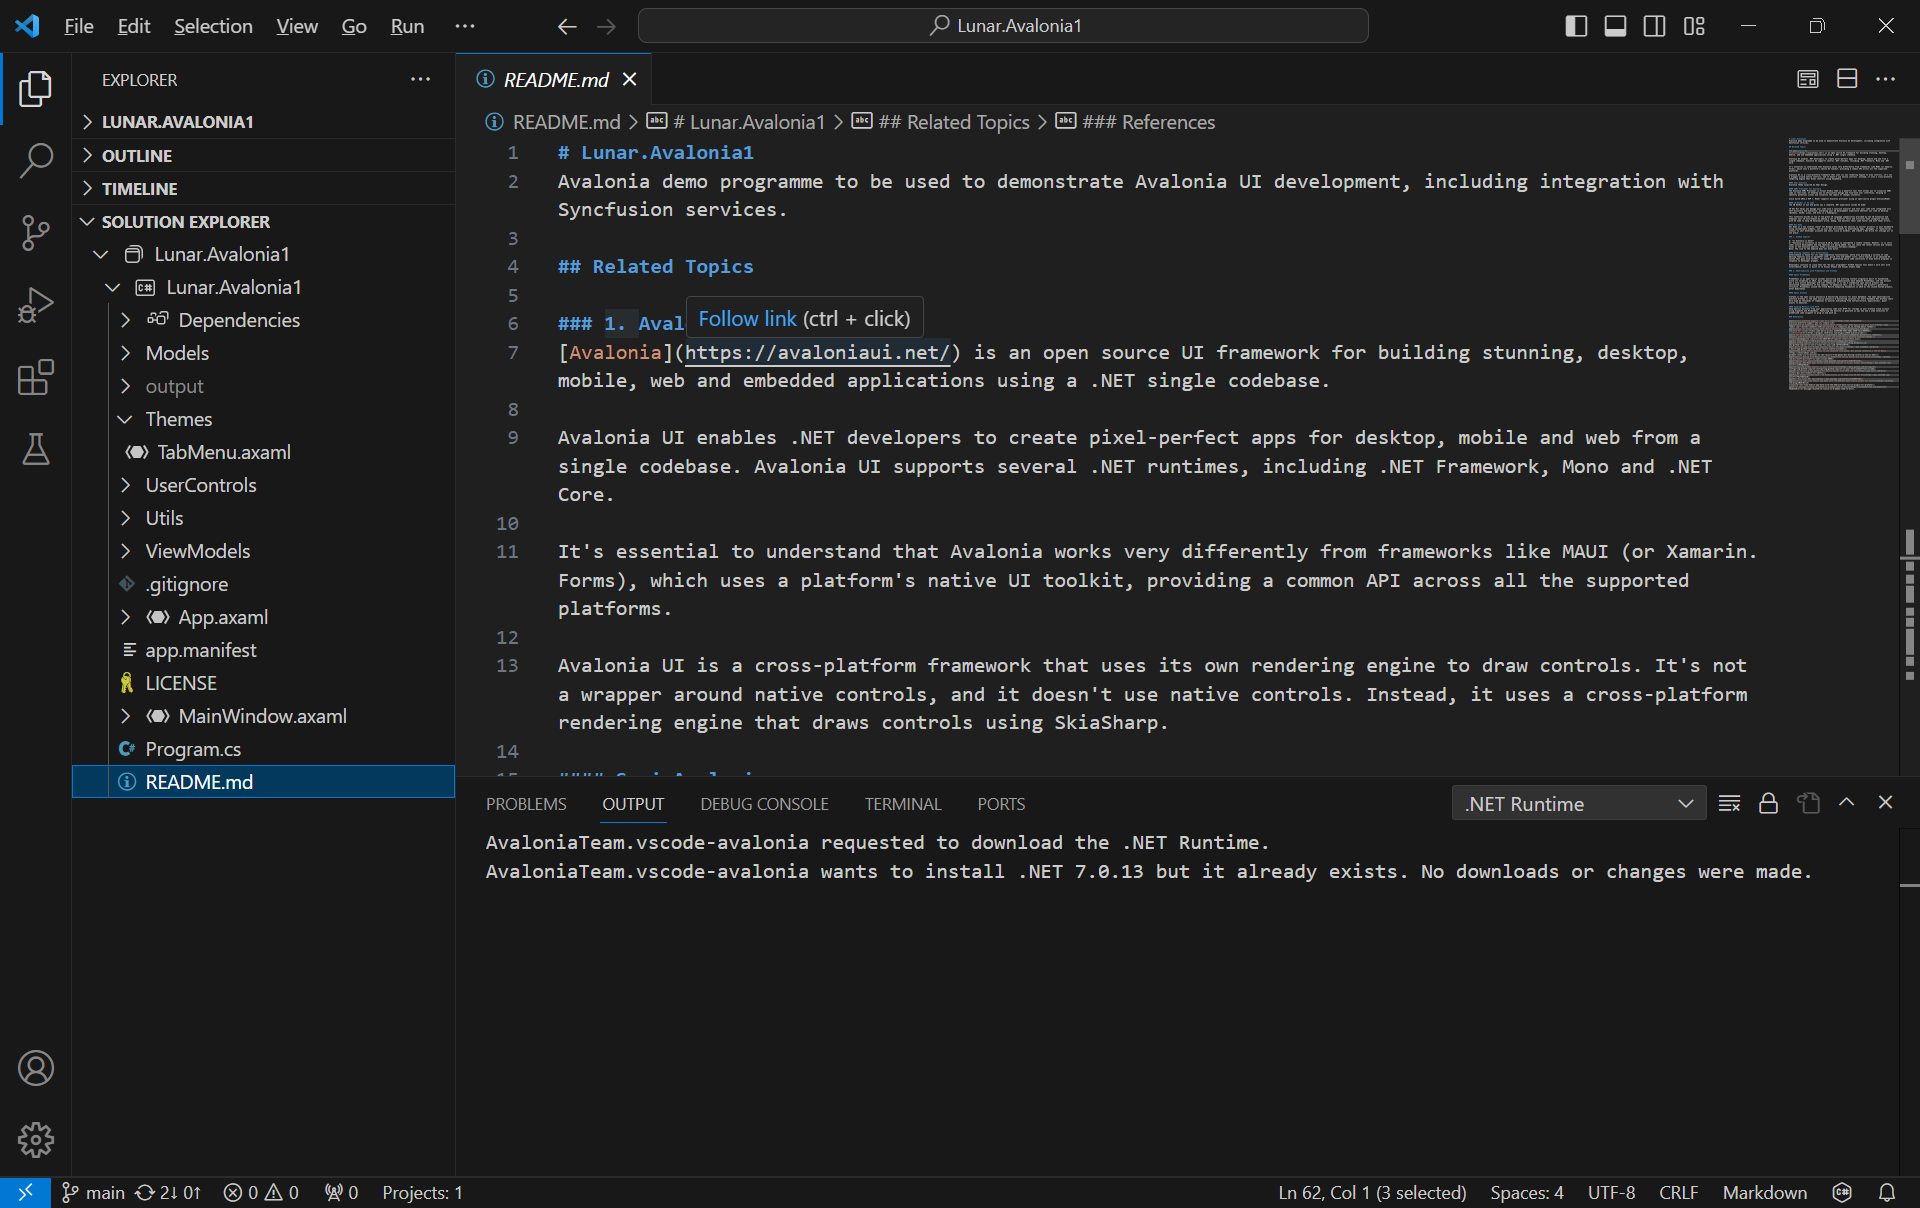
With C# Dev Kit, we can now manage our projects with the Solution Explorer that we have been very familiar with on the Visual Studio.
Besides the normal file explorer, we now can have the Solution Explorer in VS Code too.
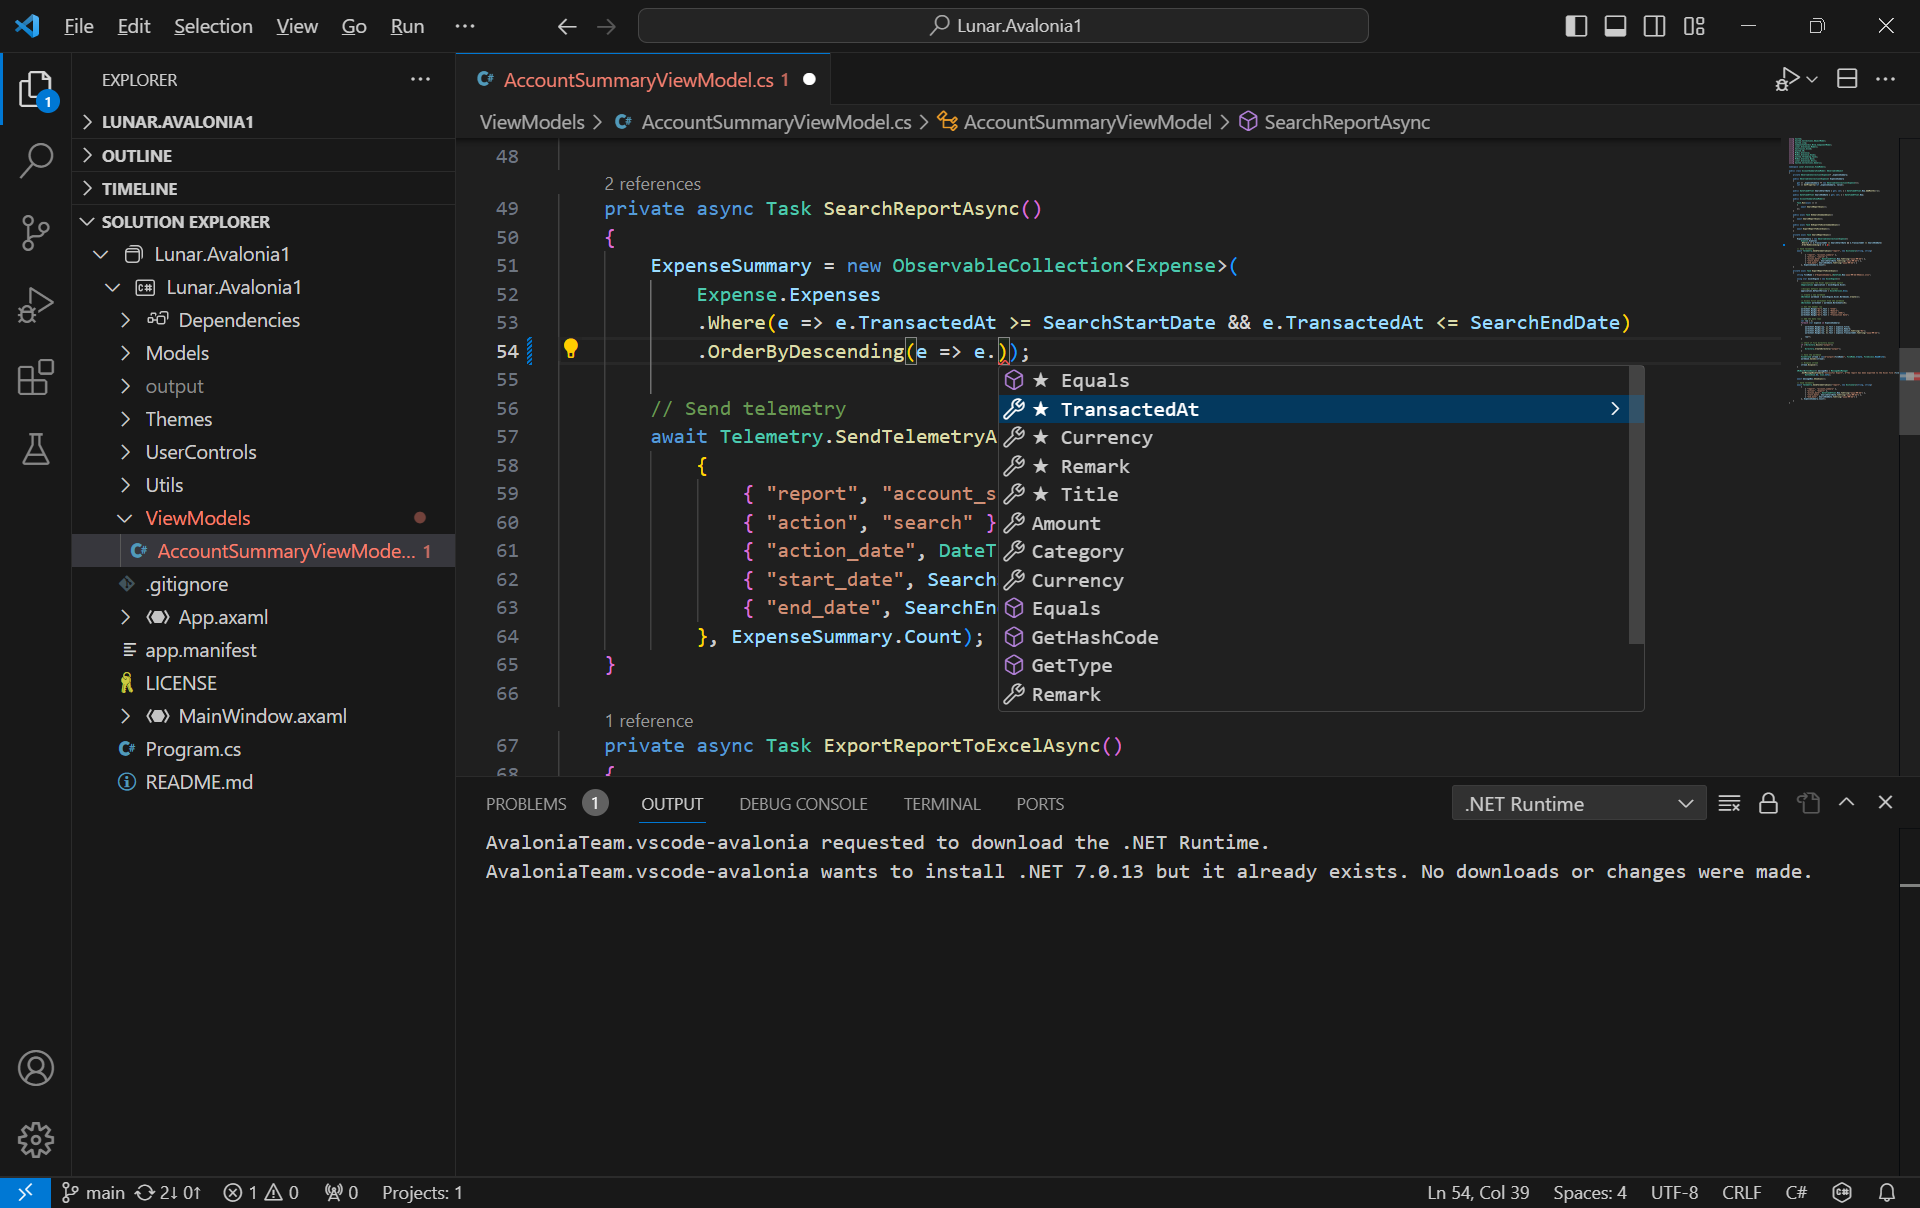
Since the IntelliCode for C# Dev Kit extension is installed together, on top of the basic IntelliSense code-completion found in the existing C# extension, we can also get powerful IntelliCode features such as whole-line completions and starred suggestions based on our personal codebase.
AI-assisted IntelliCode predicts the most likely correct method to use in VSCode.
Grafana Dashboard
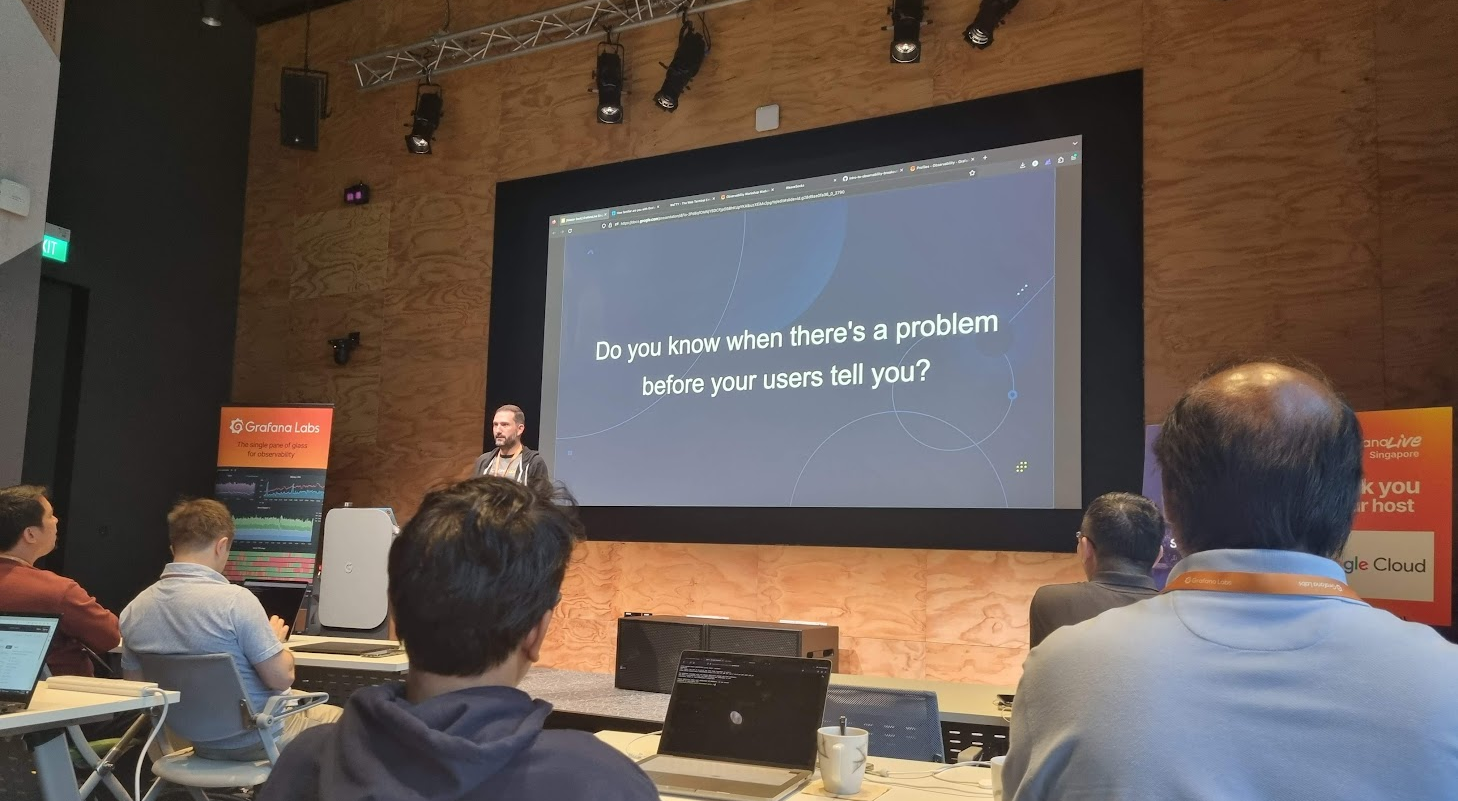
Next, I would like to talk about the observability of an app.
Observability plays a crucial role in system and app management, allowing us to gain insights into the inner workings of the system, understand its functions, and leverage the data it produces effectively.
In the realm of observability, our first concern is to assess how well the system can gauge its internal status merely by examining its external output. This aspect of observability is crucial for proactive issue detection and troubleshooting, as it allows us to gain a deeper insight into performance and potential problems of the system without relying on manual methods.
Effective observability not only aids in diagnosing problems but also in understanding the system behavior in various scenarios, contributing to better decision-making and system optimisation.
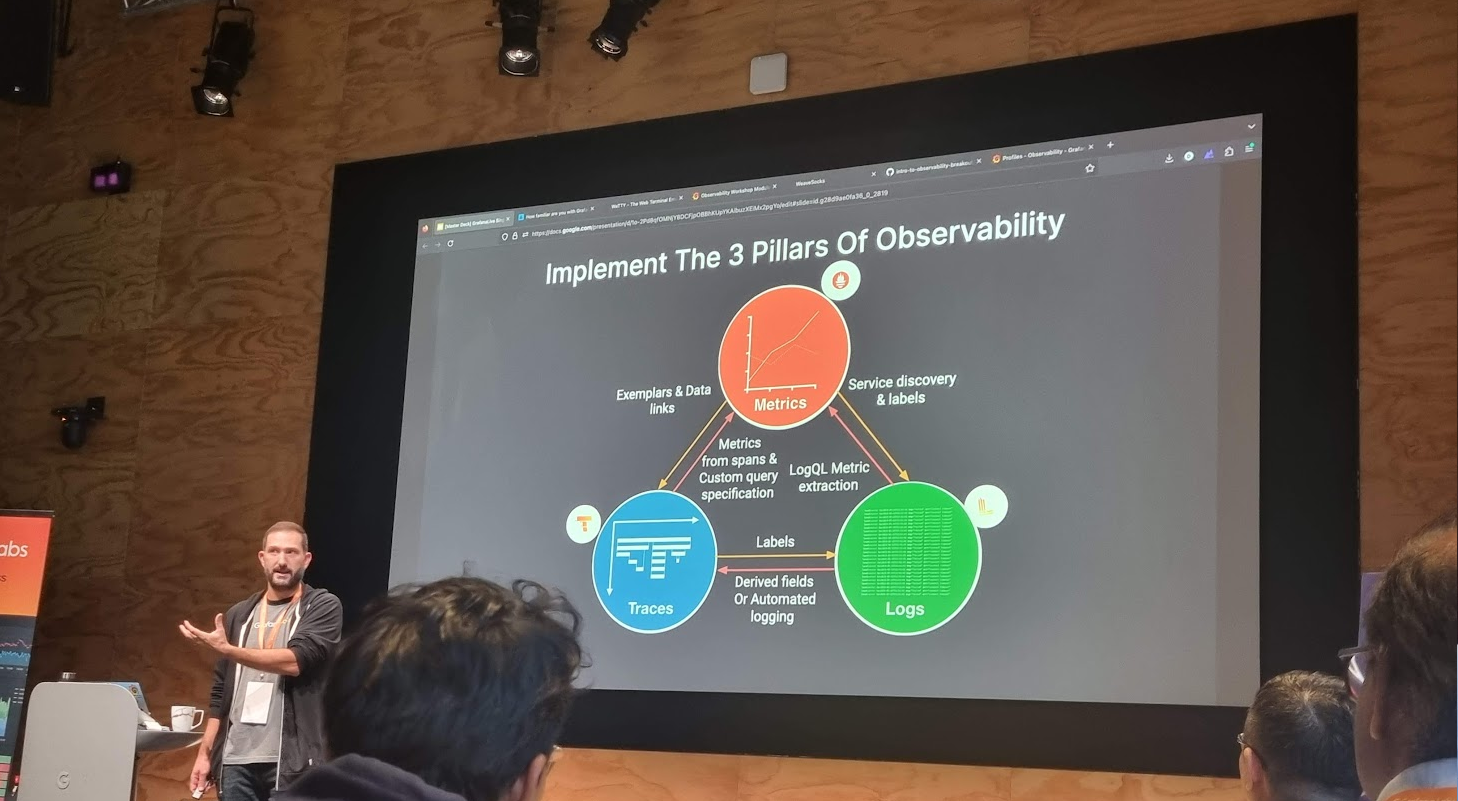
Grafana engineer shared about the 3 pillars of observability.
There are three fundamental components of observability, i.e. monitoring, logging, and tracing. Monitoring enhances the understanding of system actions by collecting, storing, searching, and analysing monitoring metrics from the system.
Prometheus and Grafana are two widely used open-source monitoring tools that, when used together, provide a powerful solution for monitoring and observability. Often, Prometheus collects metrics from various systems and services. Grafana then connects to Prometheus as a data source to fetch these metrics. Finally, we design customised dashboards in Grafana, incorporating the collected metrics.
A simple dashboard collecting metrics from the Avalonia app though HTTP metrics.
We can get started quickly with Grafana Cloud, a hosted version of Grafana, without the need to set up and manage infrastructure components.
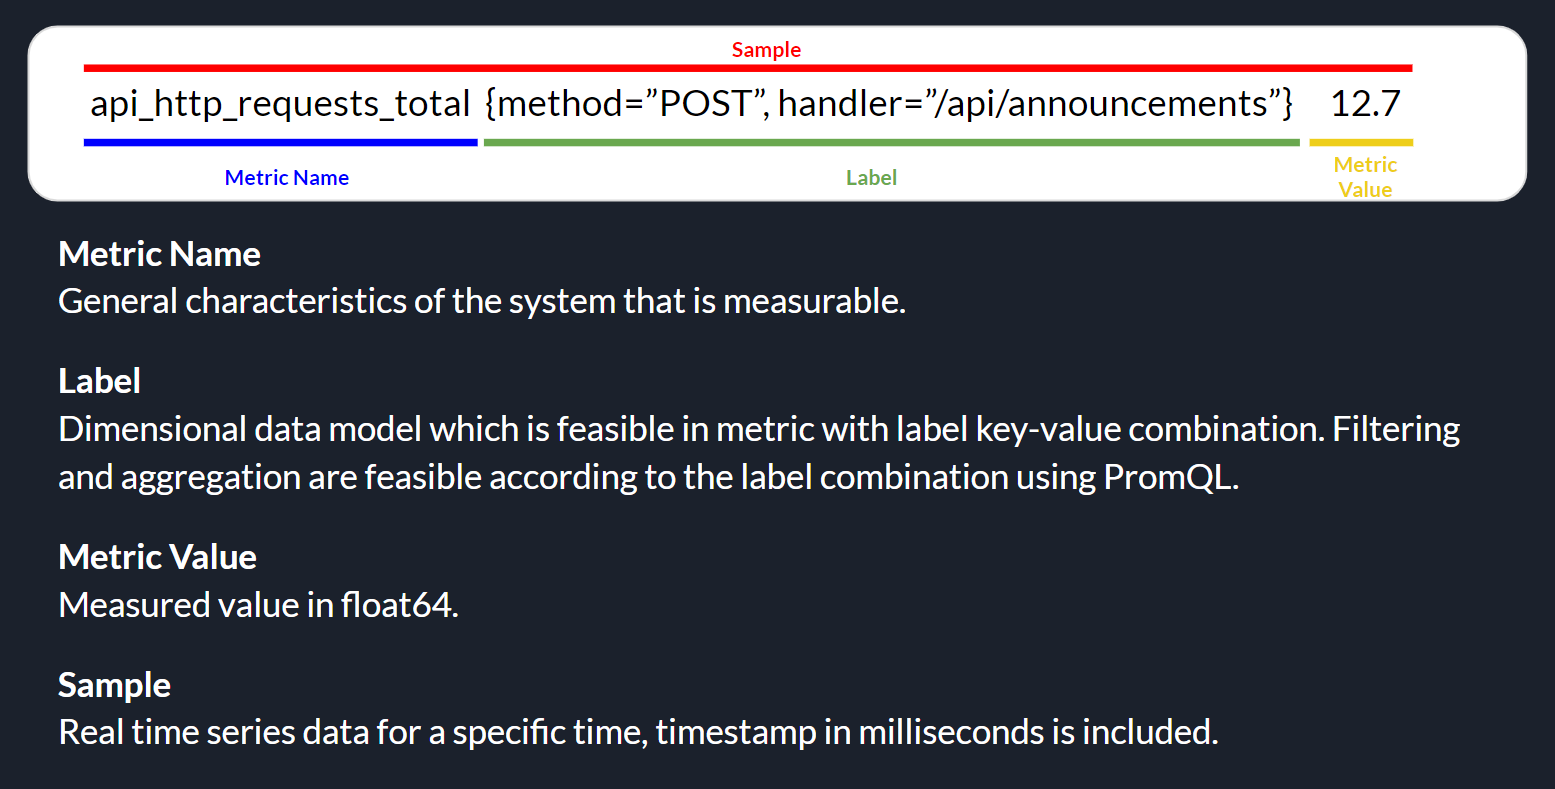
On Grafana Cloud, using the “HTTP Metrics”, we are able to easily send metrics directly from our app over HTTP for storage in the Grafana Cloud using Prometheus. Prometheus uses a specific data model for organising and querying metrics, which includes the components as highlighted in the following image.
Prometheus metrics basic structure.
Thus, in our Avalonia project, we can easily send metrics to Grafana Cloud with the codes below, where apiUrl, userId, and apiKey are given by the Grafana Cloud.
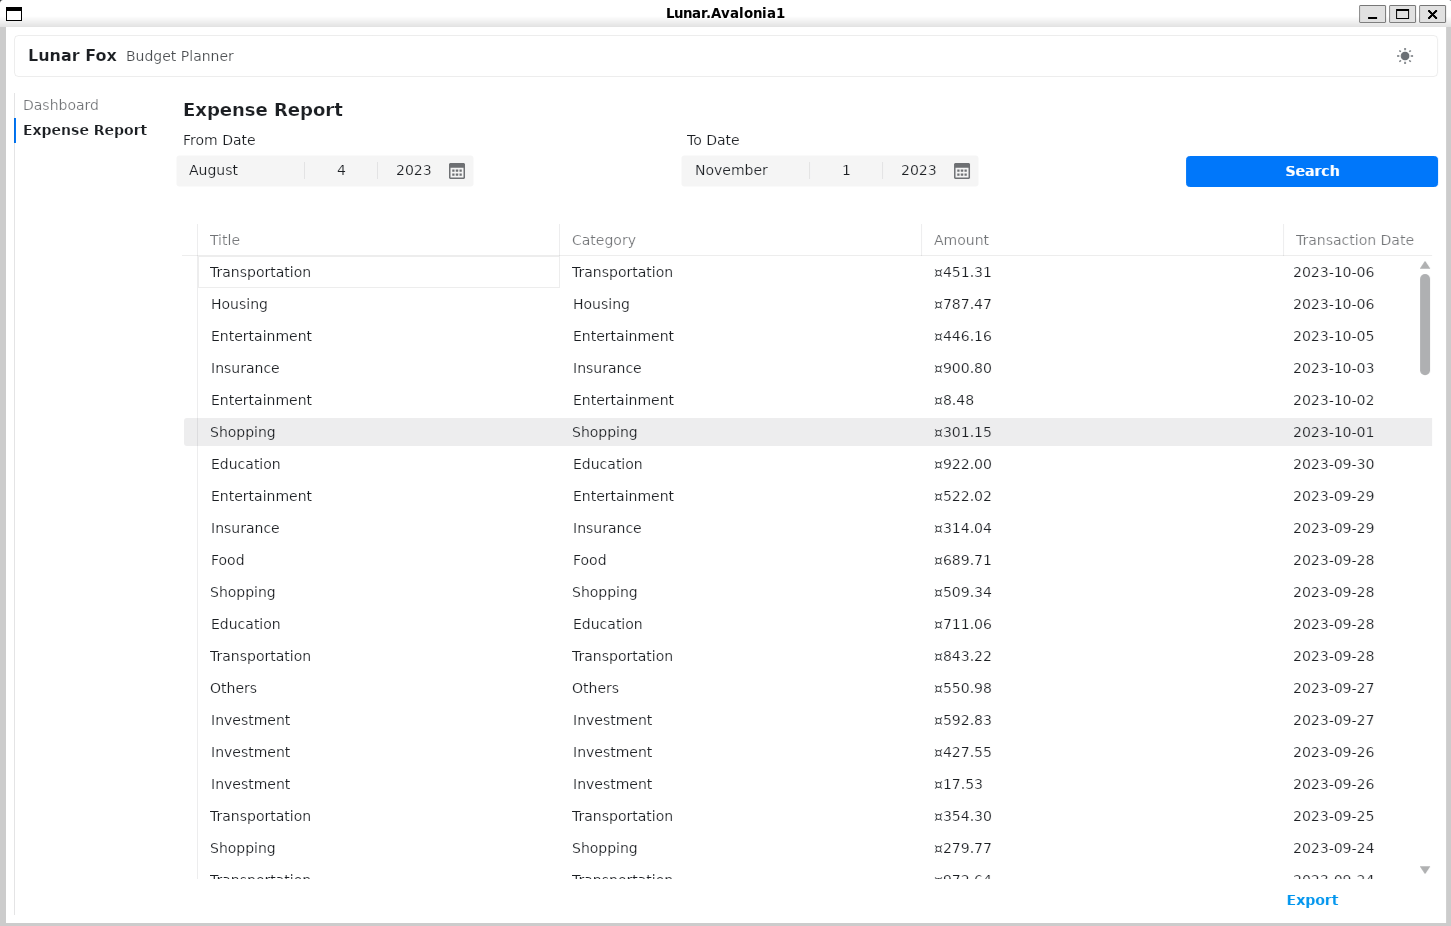
The complete source code of this project can be found at https://github.com/goh-chunlin/Lunar.Avalonia1. In the Readme file, I have also included both the presentation slide and recording for my presentation in the Singapore .NET Developers Community meetup in October 2023.
My Avalonia app can run on WSLg without any major issues.
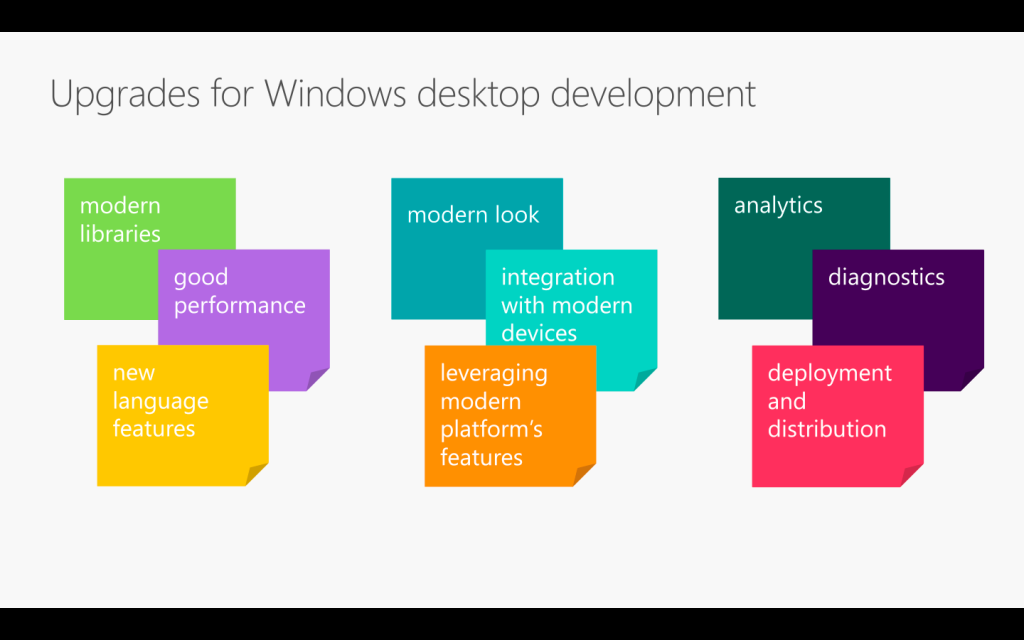
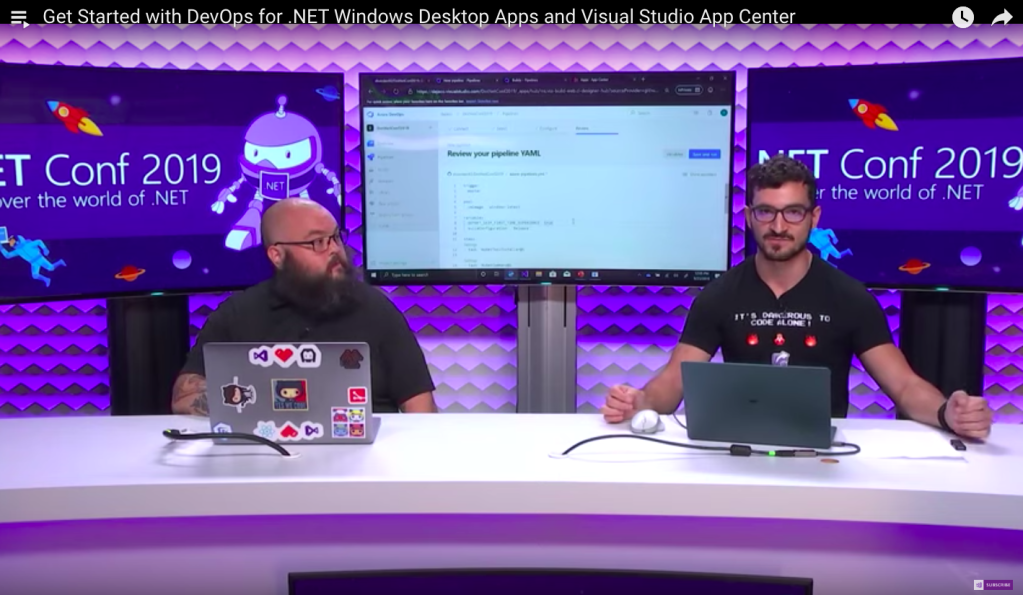
The topic that I delivered in the event is “Development and DevOps of Desktop Apps with .NET Core 3.0”. It is a 45-minute talk combining the content from the following three talks.
From coding, converting, to deploying. (Image Credit: .NET Conf 2019)
If you watch the videos above, the total length is about 70 minutes. So covering three of them in a 45-minute talk is a challenge to me. Luckily, I have Sabrina to help me out by co-speaking with me.
If you have watched our session, you will realise it’s quite different from the official .NET Conf. In this post, I am going to brief you through about my thoughts and development process of our talk content.
Let’s Hashtag Together!
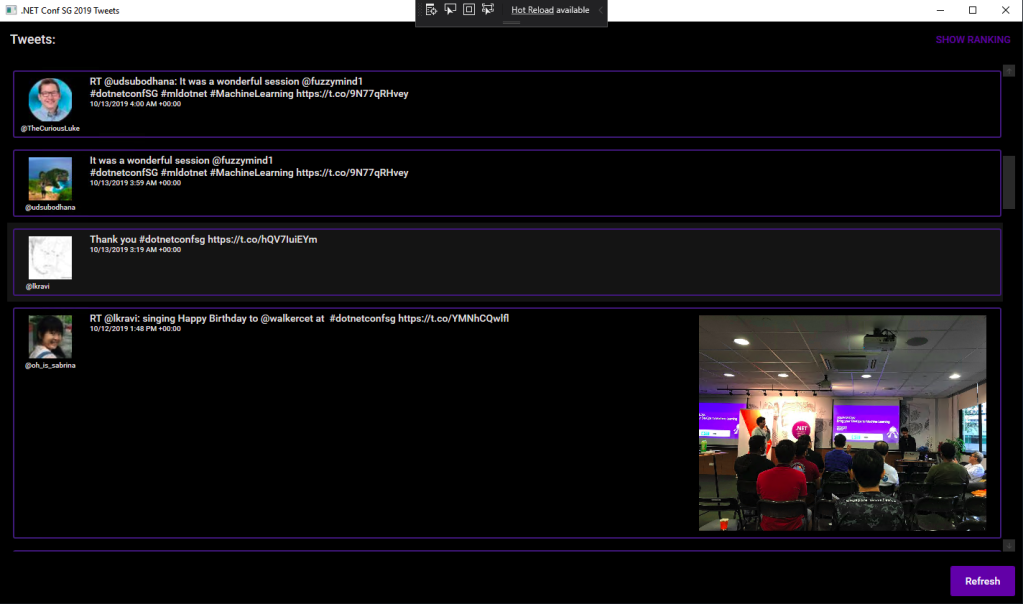
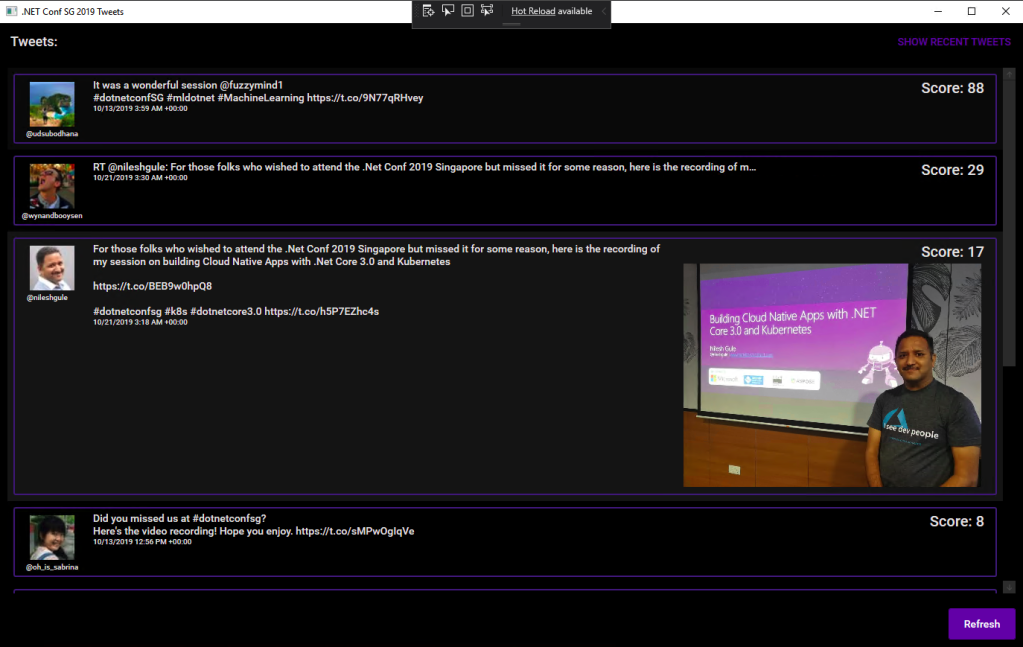
In order to make the conference to be more engaging, after discussing with Sabrina, I came out with a desktop app which will shows the recent tweets having #dotnetconfsg hashtag, which looks like the following.
Participants tweeting about our sessions.
To make this “game” more interesting, I announced that the top four participants who earn the highest scores would receive prizes from me. The formula to calculate the score is basically
+1 point for one tweet;
+5 point for one retweet of the tweet;
+5 point for one like of the tweet.
Throughout the conference, we thus had seen a huge number of tweets about our event and speakers. Some of them even tweeted with great photos (I should have given 5 points for great photos too).
In our talk, we used this desktop app as our sample. The app is built in .NET Framework 4.7. Sabrina started the demo with showing how we can modernise it to a .NET Core desktop app. I then covered a bit about Hot Reload, the runtime tools (the small little black bar on top of locally launched WPF app), and DevOps part of desktop app.
I am using the Tweetinvi library to retrieve the tweets easily. I originally tried calling the Tweeter APIs directly from C# and it’s a painful experience. Instead of wasting resources on researching the Tweeter APIs, I change to use Tweetinvi because it allows me to easily get the tweets in just two lines of codes.
To improve the GUI, I use the Material Design in XAML Toolkit. So, I can easily change the WPF application to have dark mode. This is very important to me because I realise light mode isn’t displayed well on the projected screen during the event. So, it now looks as shown in the following screenshot.
New look with Material Design.
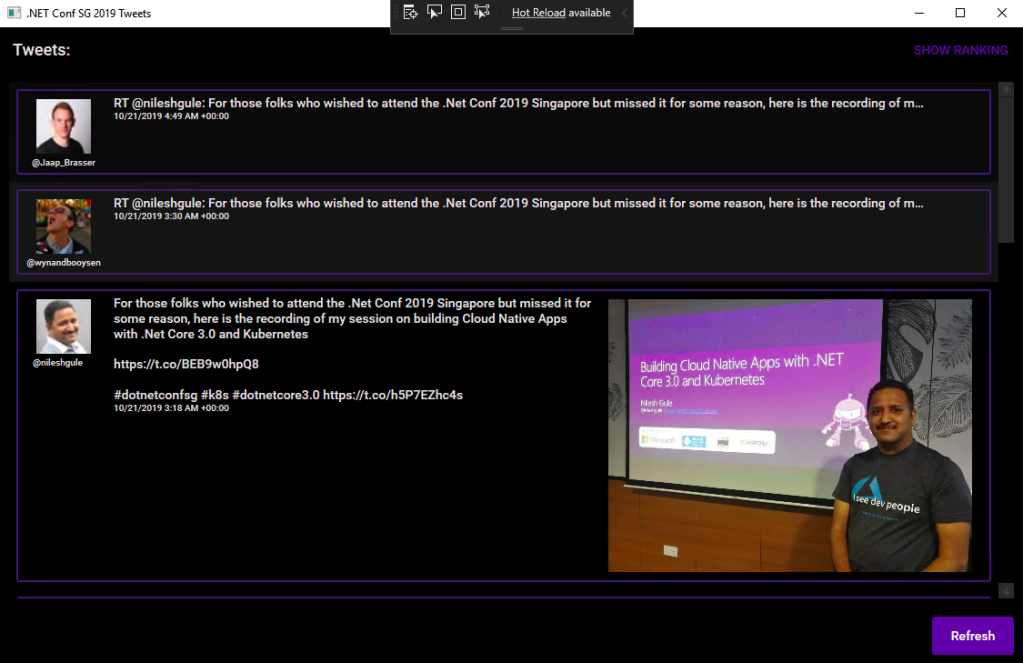
By clicking on the “Show Ranking” button at the top-right corner, we can easily tell the scores received by the participants.
The participants are sorted according to the score they receive.
Migrating to .NET Core 3.0
Now with many third-party libraries used in our WPF application, is the desktop app still compatible with .NET Core? Well, to answer this question, there is a tool from Microsoft called Portability Analyzer can give us a detail report on the set of APIs referenced in our apps that are not yet available in NET Core 3.0.
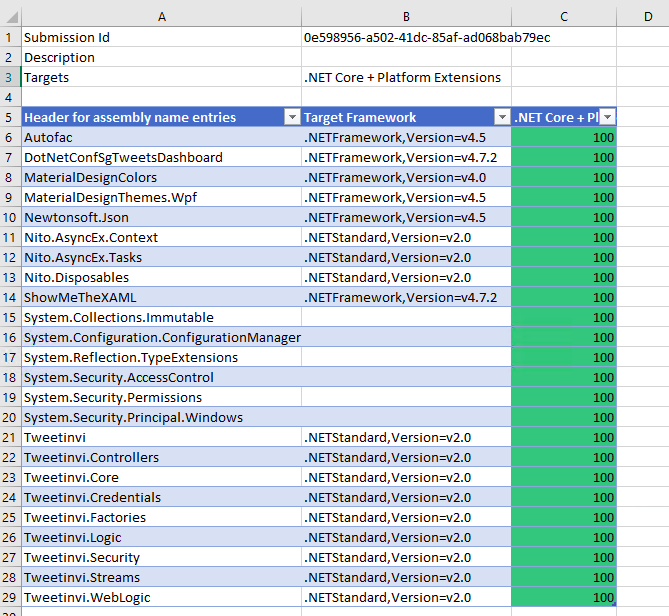
After downloading it and using it to check our application above, we received the following report.
This says that our WPF application is 100% portable to the .NET Core.
The Excel report comes with three tabs, i.e. Portability Summary (the one shown above), Details (empty), and Missing assemblies. There is one item in the report Missing assemblies though, as shown below.
However, if we proceed to use try-convert to migrate our WPF application from .NET Framework to .NET Core, it will be a successful conversion, as shown in the screenshot below.
Converted a .NET Framework project to .NET Core 3.0.
The following screenshot shows how the app looks like after being migrated to .NET Core 3.0. Nothing significant is changed. If you would like to find out what have been changed, please visit the commit of this project on GitHub.
This is a WPF app in .NET Core 3.0.
XAML Islands
There is another thing that I shared in my talk is about XAML Islands. In fact, I talked about XAML Islands in Microsoft Insider Dev Tour too when I was sharing about WinUI.
Microsoft Insider Dev Tour (Image Credit: Microsoft Malaysia – Insider Dev Tour Kuala Lumpur)
XAML Islands is a feature that allows us to host UWP controls in non-UWP desktop applications. The reason of having it is to improve the UX of existing Win32 apps by leveraging UWP controls.
Although the documentation says it is enabled only starting from Windows 10, version 1903. However, if you are using version 1809, XAML Islands feature is also available already, just that not yet stable. So, the best choice is still using version 1903 and above.
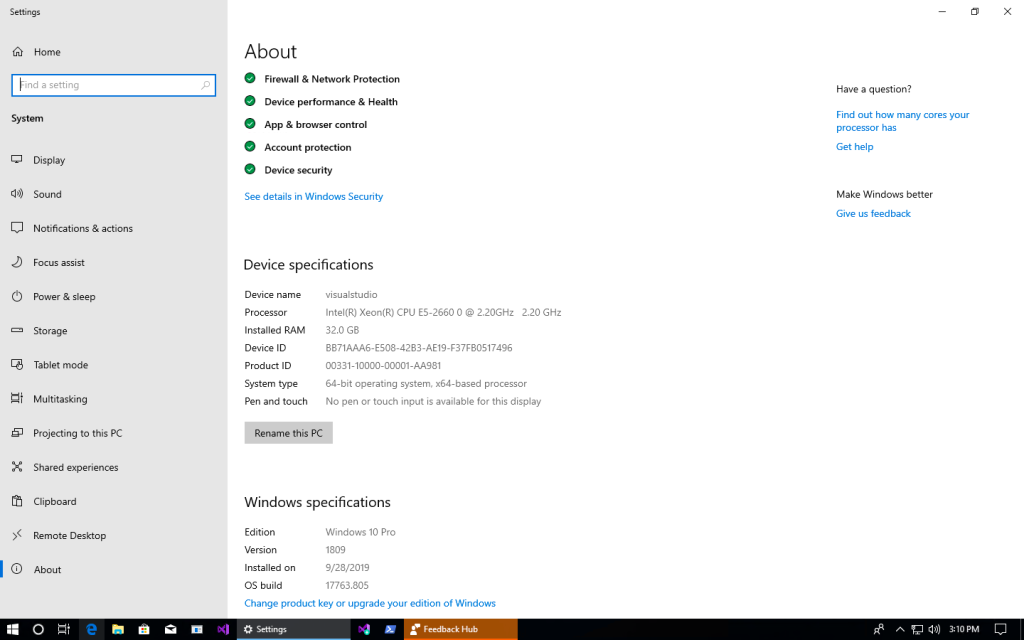
In my presentation, since I was using the Windows 10 image hosted on Microsoft Azure VM, the best version I could get is 1809.
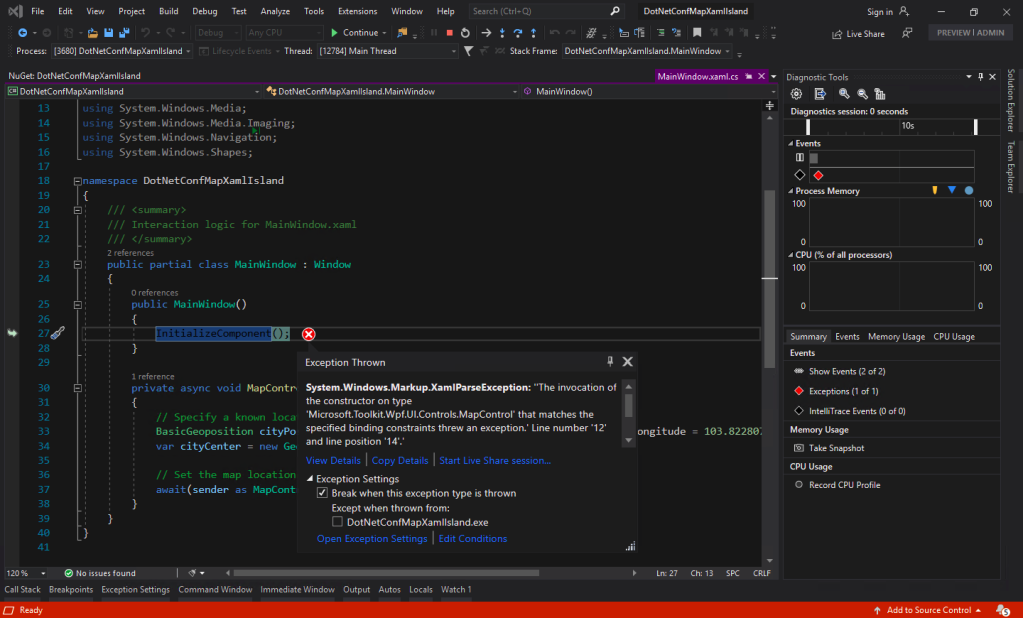
You may ask why I am using version 5.1.1 of the Microsoft.Toolkit.Wpf.UI.Controls. On the day of .NET Conf Singapore, the version 6.0 (Preview 9.1) of it is already out. However, when I try to use the library, it threw the exception, as shown in the screenshot below.
Oops, app crashes with Microsoft.Toolkit.Wpf.UI.Controls 6.0 (Preview 9.1).
I could only demonstrated how I used the MapControl in a WPF app with XAML Islands.
Such a beautiful map displayed on WPF app!
Creating Build Pipeline in Azure DevOps
Now, with the codes of our WPF application on GitHub, we can create a Build pipeline for the app on Azure DevOps. This is not a new feature but it is nice to see how we can now build a .NET Core WPF app on Azure DevOps.
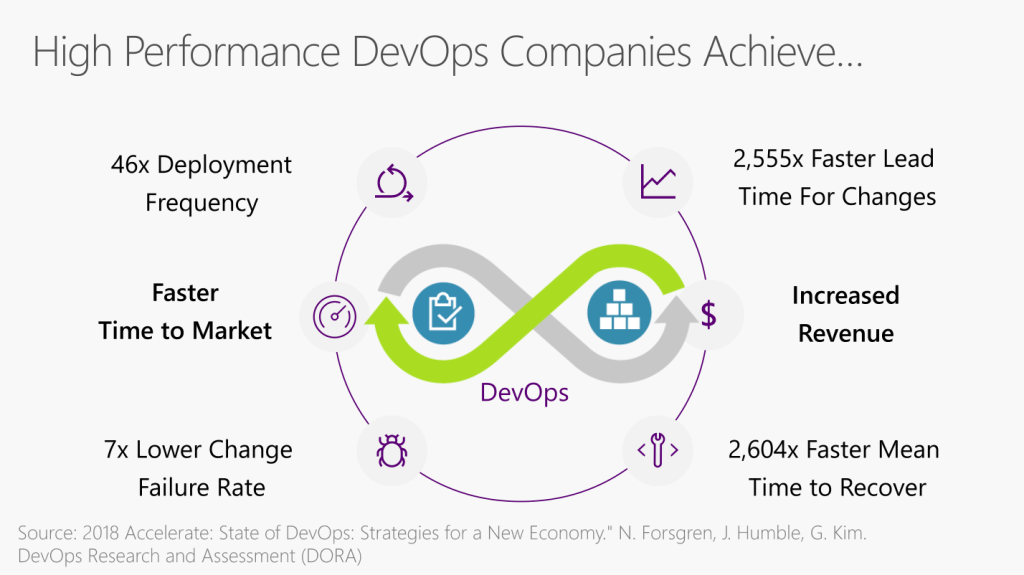
Benefits of DevOps (Image Credit: .NET Conf 2019)
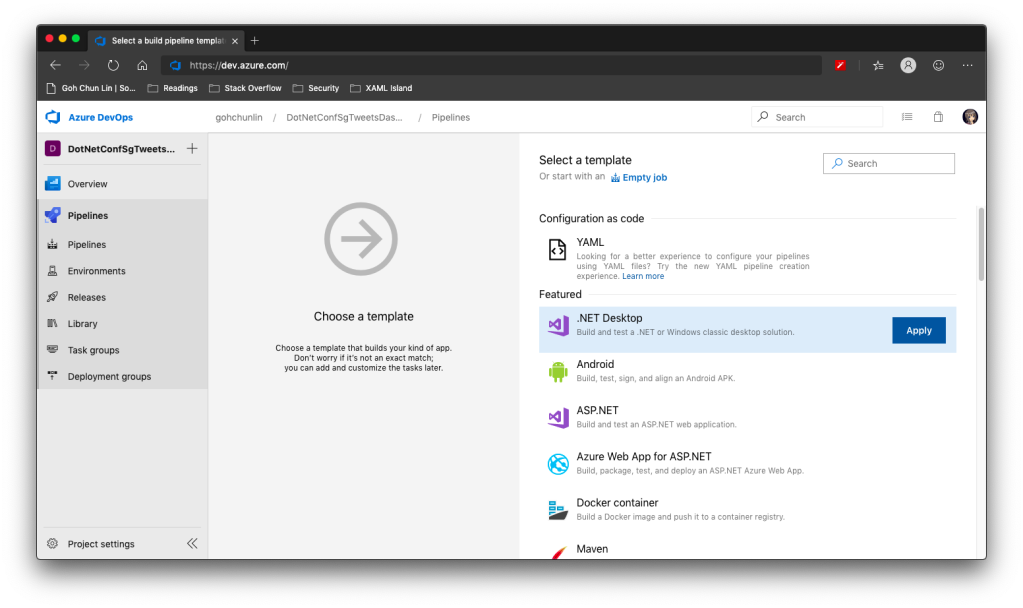
There is a template available on Azure DevOps to build .NET Desktop app.
We can apply this template to build .NET Desktop app on Azure DevOps.
However, before we proceed to start the build, we need to make a few changes to it.
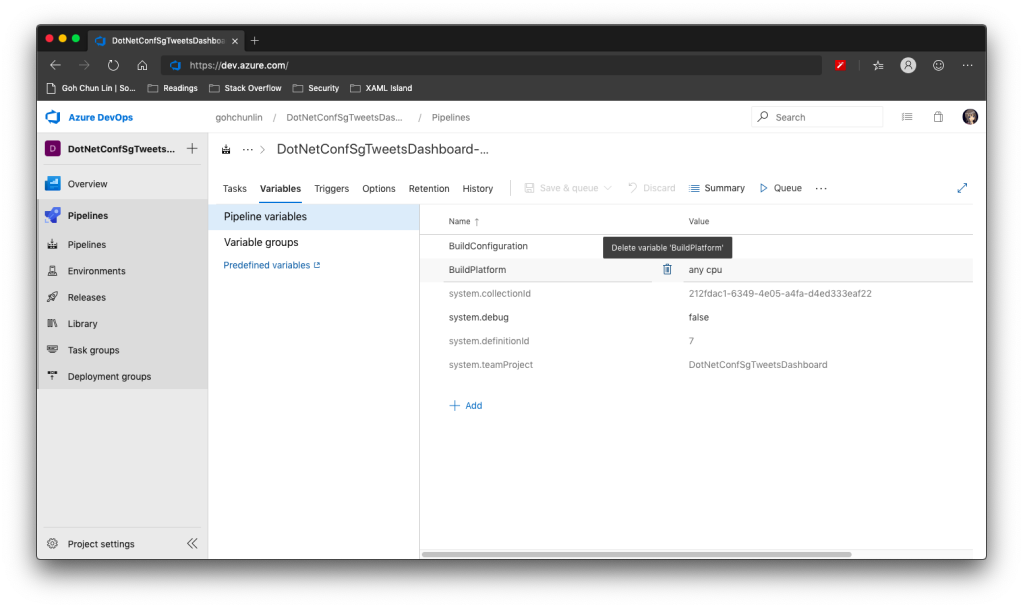
Since we will be using dotnet publish later, so the BuildPlatform variable is not necessary and can be removed.
Removing BuildPlatform variable from the pipeline.
Instead, we need to add a new variable called DOTNET_SKIP_FIRST_TIME_EXPERIENCE and set it to true. This is to speed up the build process because by default when we run any .NET Core SDK command on Azure DevOps, it does some caching. However, now we are running this on a hosted build agent, so this caching will never be useful because the agent will be discarded right after the build is completed. Thanks Daniel Jacobson for highlighting this in his video.
Daniel Jacobson (right) explains about Azure DevOps and .NET Core SDK commands. (Image source: YouTube video)
After that, we need to remove all the default steps because we need to start from scratch for .NET Core.
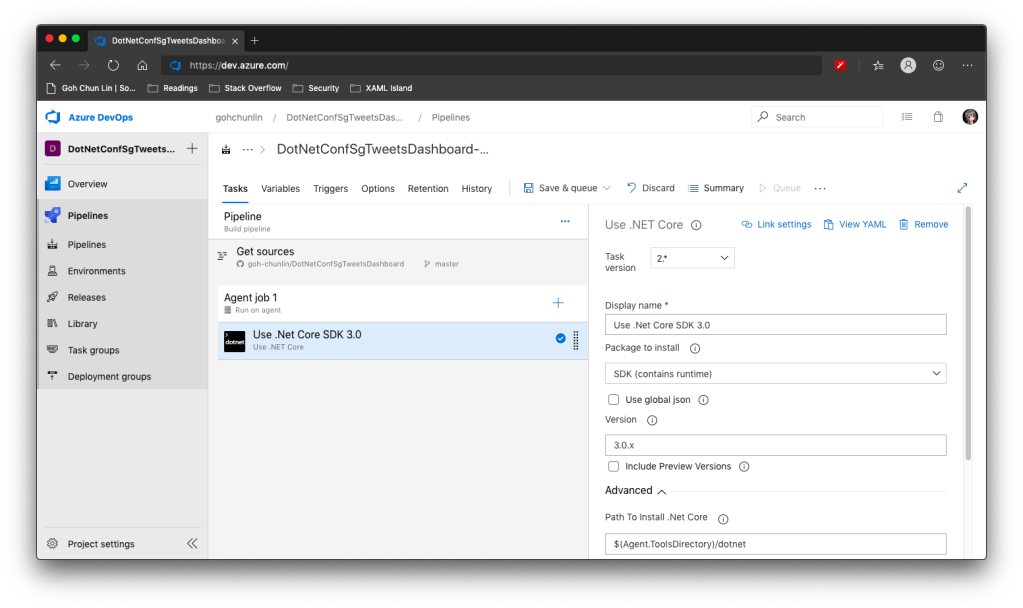
The first step is to install .NET Core SDK 3.0. Remember to state “3.0.x” as the version otherwise if there is a minor update to .NET Core 3.0, we will still be using the outdated one to build.
Step 1: Use .NET Core SDK 3.0
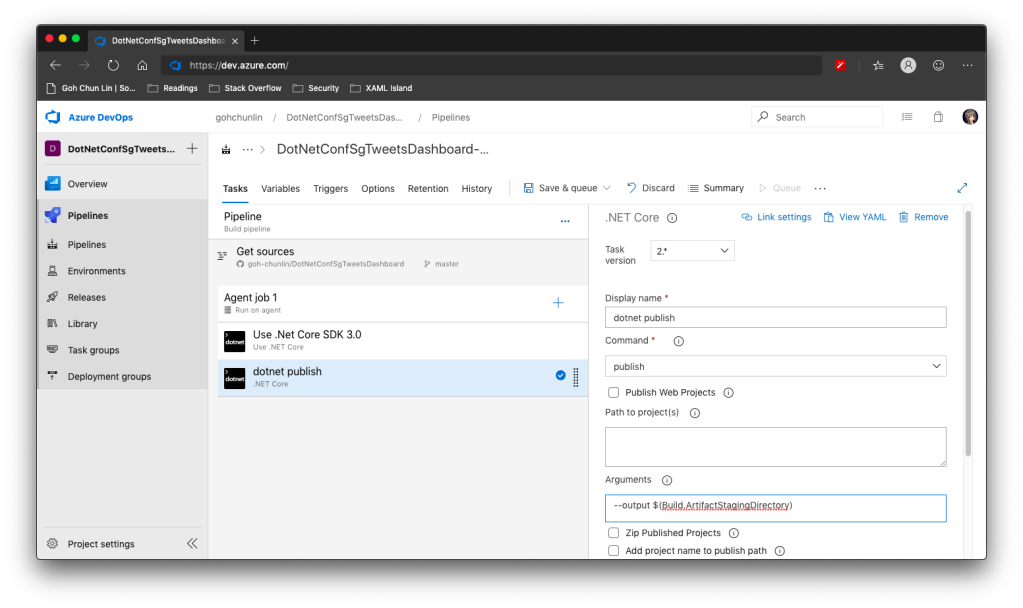
After that, we are going to do dotnet publish.
Starting with .NET Core 2.0, we don’t have to run dotnet restore because it’s run implicitly by all commands that require a restore to occur. Also dotnet publish will build the project, so we do not need to run dotnet build.
Since this is a WPF project, so we have to uncheck the “Publish Web Projects” checkbox, together with the other two checkboxes “Zip Published Projects” and “Add project name to publish path”, as shown in the screenshot below.
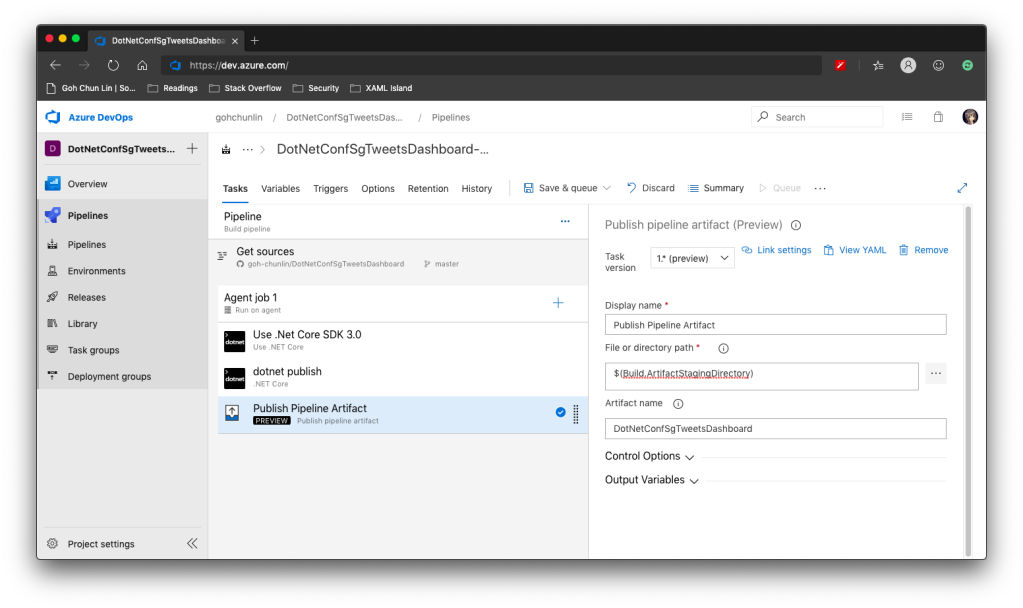
Now we proceed to add the next step, which is to publish the artifact. Here we specify $(Build.ArtifactStagingDirectory) as the path of the directory to publish. Then we also specify a user friendly name for the artifact.
Step 3: Publish Pipeline Artifact
Now we can click the “Save & queue” to run this pipeline.
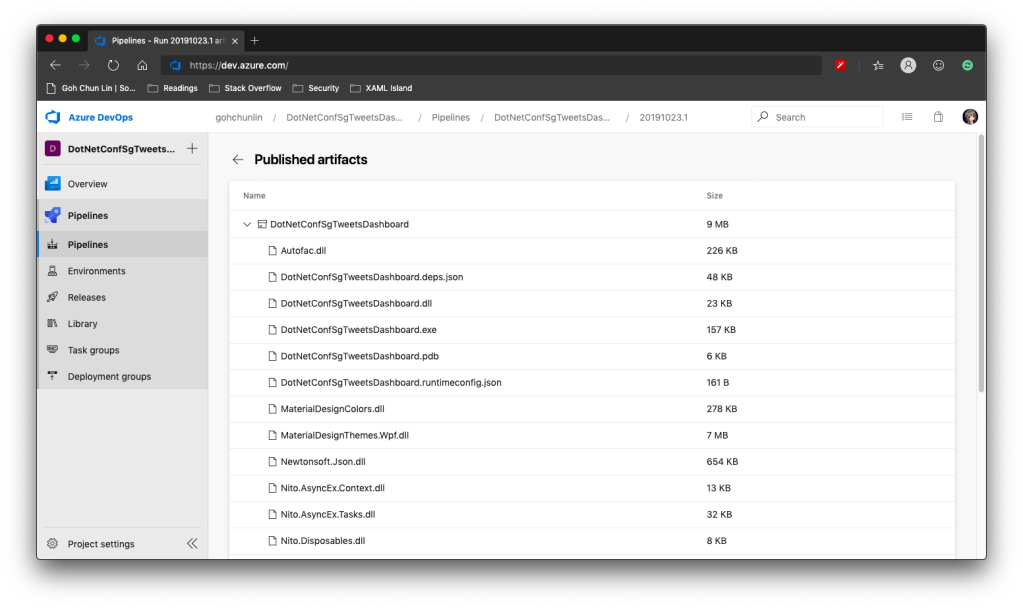
In the published artifact, we will see the following.
Published artifact in our first attempt.
Wow, there are a lot of DLLs! The .exe file alone is only 157KB.
Fortunately, starting from .NET Core 3.0, as long as we specify the following in our csproj file, it will produce a single .exe file.
<PublishSingleFile>true</PublishSingleFile>
However, there is one more thing to take note is that if we miss out the <RuntimeIdentifier>, there will be an error NETSDK1097 which says, “It is not supported to publish an application to a single-file without specifying a RuntimeIdentifier. Please either specify a RuntimeIdentifier or set PublishSingleFile to false.”
<RuntimeIdentifier>win-x86</RuntimeIdentifier>
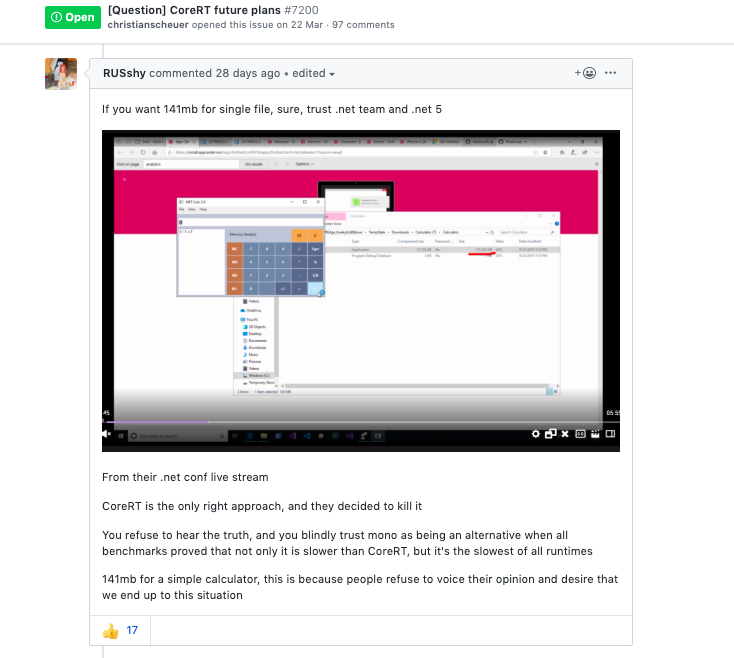
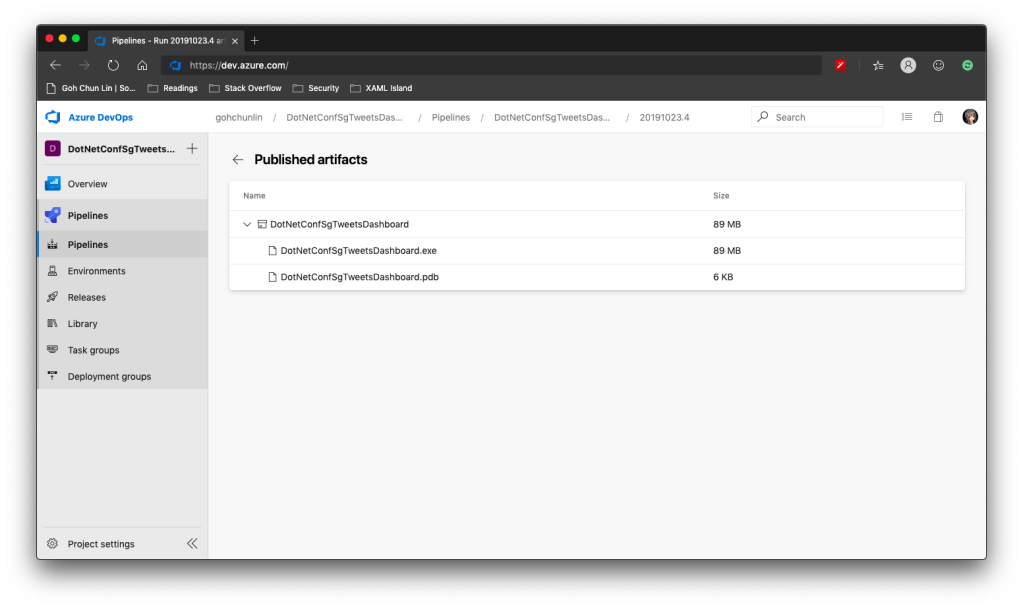
With this change, when we run the Build pipeline again, we get the following.
Published artifact with <PublishSingleFile>.
We now only have one .exe file but its size has grown from 157KB to 145MB!
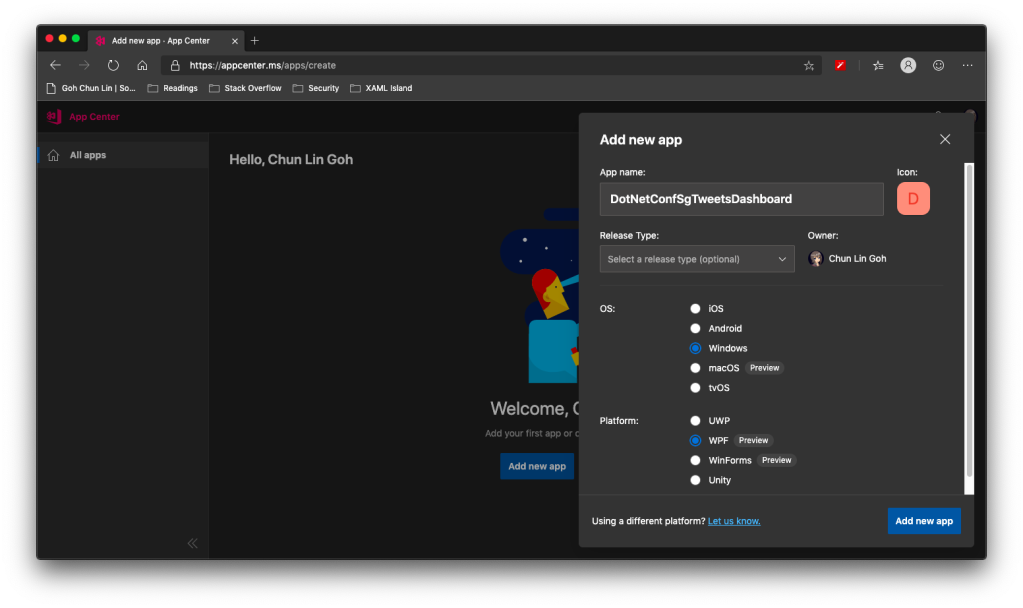
WinForms and WPF are now available on VS App Center but still in preview.
So, the artifact generated in Azure DevOps Build pipeline cannot be automatically delivered to VS App Center even after .NET Conf 2019. We now have to do it manually.
Firstly, we need to download the actifact as a zipped file in Azure DevOps.
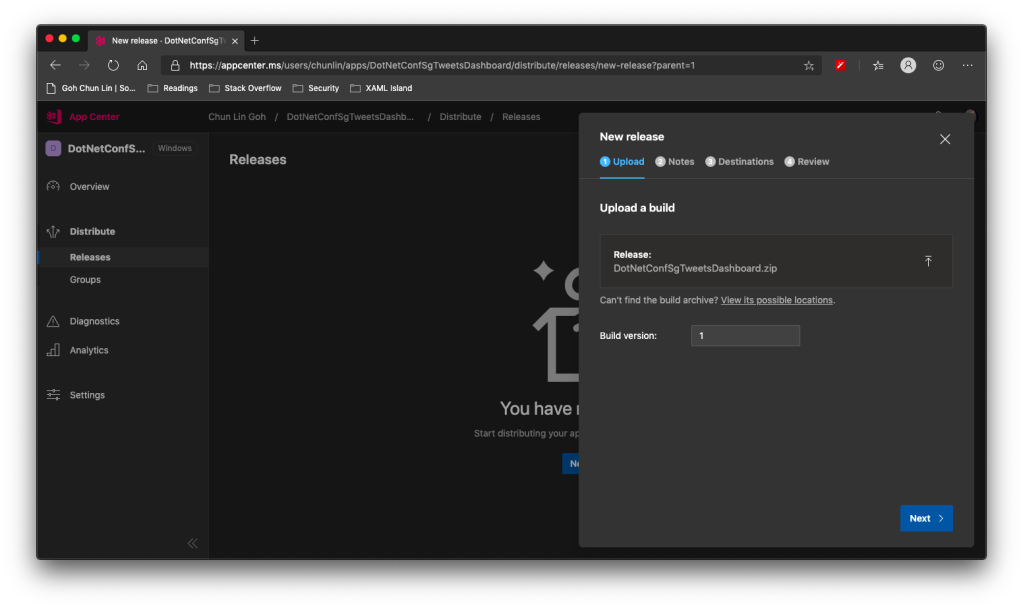
Secondly, we need to upload the zipped file to the VS App Center in its Releases tab, as shown in the following screenshot.
Setting Build version to 1 because this is our first release of the app.
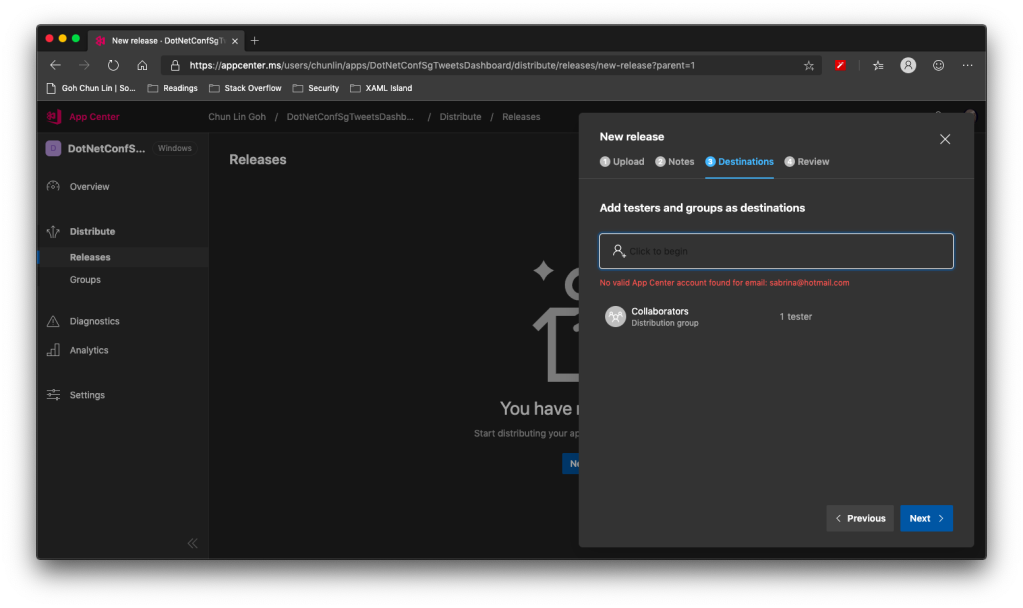
After keying the release notes, we will be landed on a page to choose who we should distribute the app to. Normally they are our developers, business analysts, and testers. Here, in my example, I only have one group called Collaborator and I am the only one in the group.
We are not allowed to add those who are not in our App Center as testers.
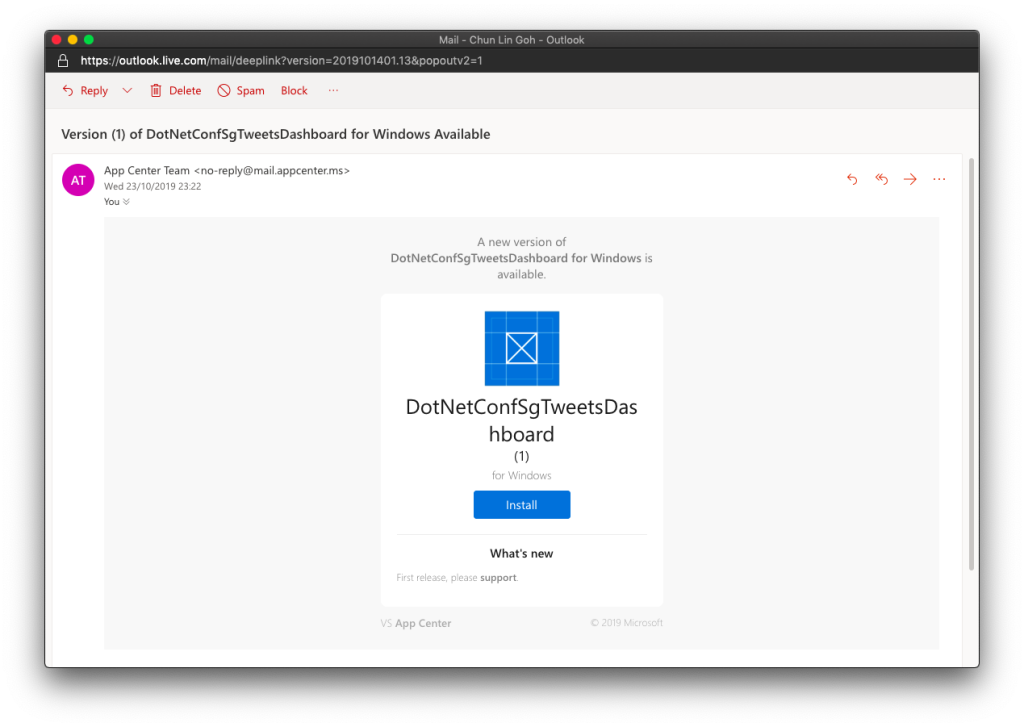
Finally, we will hit the “Distribute” button to release our app to testers. As tester, I will receive the email notifying about the new release.
Yay, new release available for in-house testing.
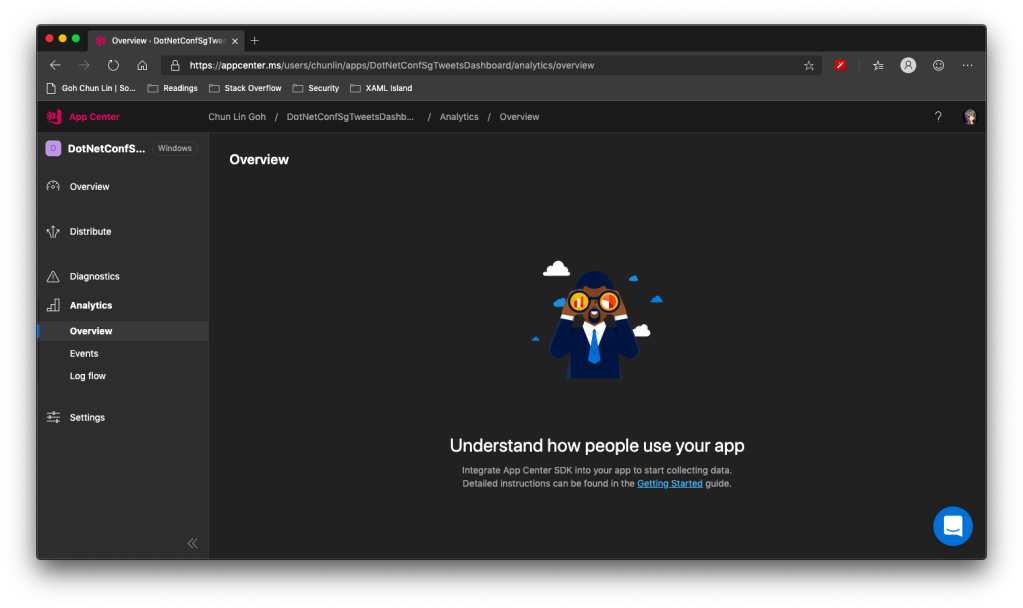
Analytics with App Center SDK
We can also integrate our WPF desktop app with App Center SDK to further collect data to find out how people use our app as well as the crashes in our app.
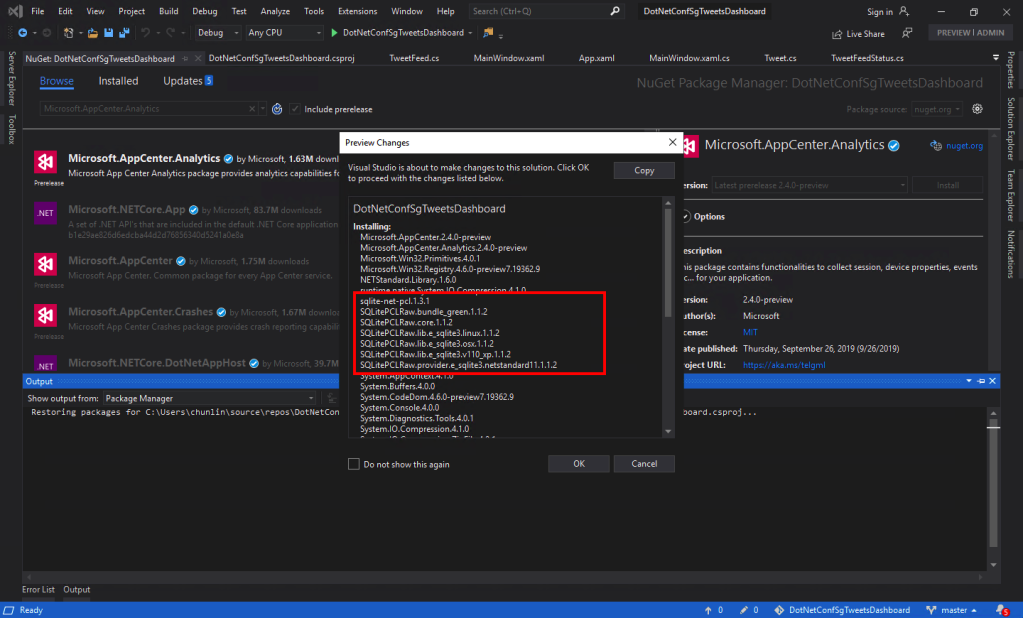
To do so, firstly, we need to install the following two Nuget packages. As the support for WPF SDK is still in preview, please remember to check the “Include prerelease” checkbox.
Microsoft.AppCenter.Analytics;
Microsoft.AppCenter.Crashes.
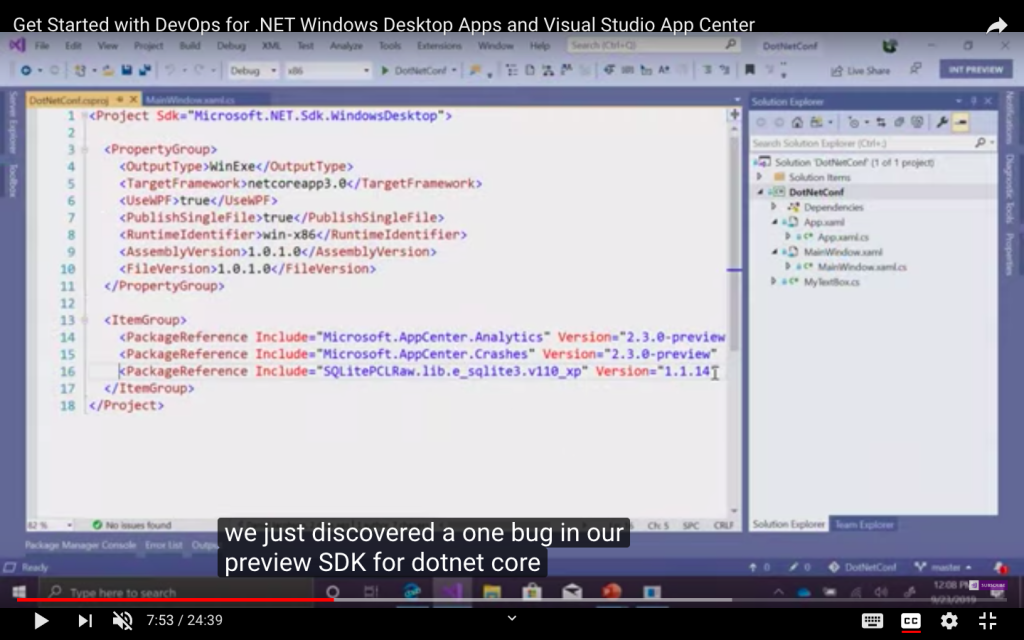
SQLitePLCRaw is being installed when we install the App Center SDK.
Now we can proceed to put the following code in the first window that will be launched in our app. In my case, it is the MainWindow. So, right after the InitializeComponent() is called, the following codes will be executed.
Yup, if you have noticed earlier when we’re installing the App Center SDK, SQLitePCLRaw was being installed also. Just because of the bug in the SDK, this line was not added to the project file and thus we have to manually reference it. Hopefully this bug gets fixed soon.
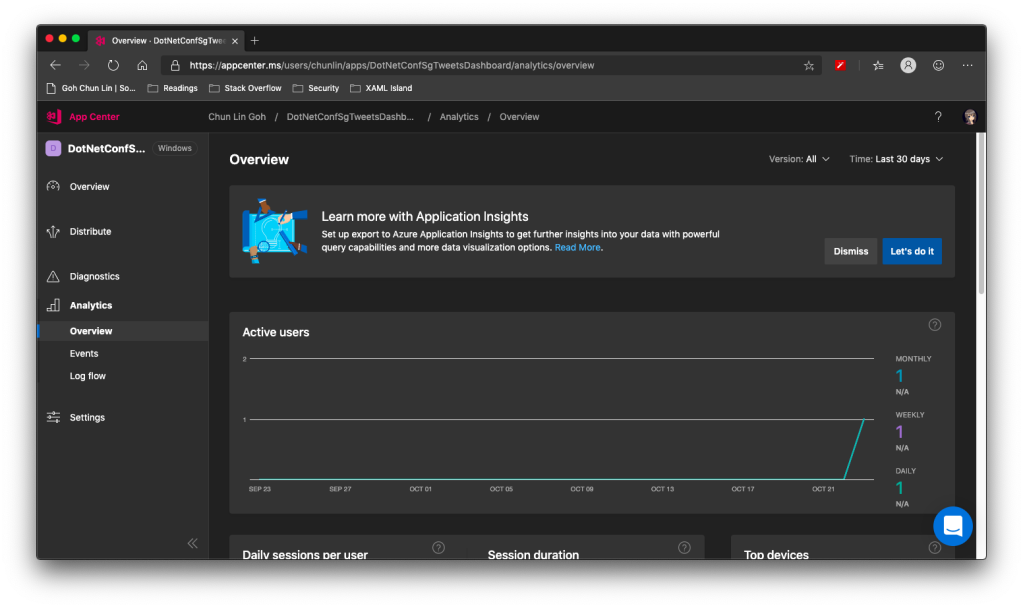
Now when we launch our WPF app again, the nice dashboard will show there is 1 user. Yay!
+1 active user in our app!
Conclusion
That’s all so far for what I’d like to share in addition to what I have shared in .NET Conf Singapore 2019.