SilverVector: The “Day 0” Dashboard Prototyping Tool

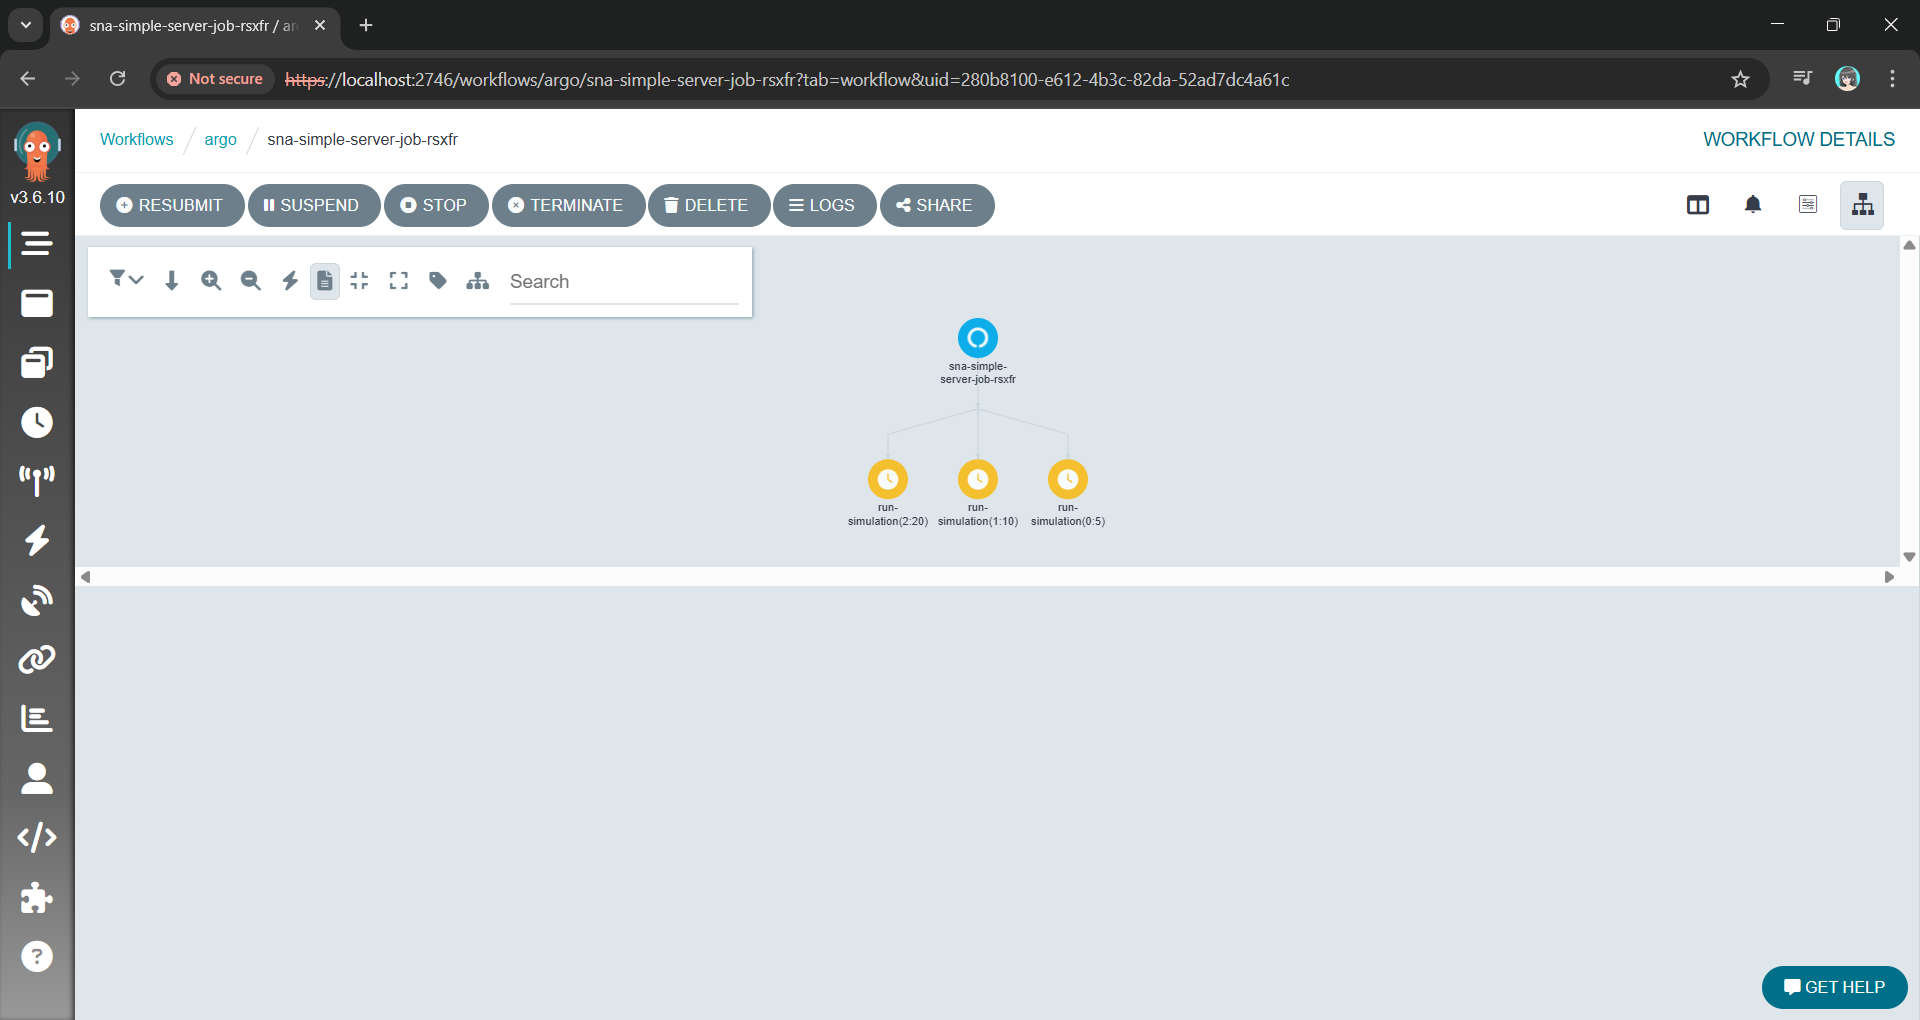
In the world of data visualisation, Grafana is the leader. It is the gold standard for observability, used by industry leaders to monitor everything from bank transactions to Mars rovers. However, for a local e-commerce shop in Penang or a small digital agency in Singapore, Grafana can feel like bringing a rocket scientist tool to cut fruits because it is powerful, but perhaps too difficult to use.

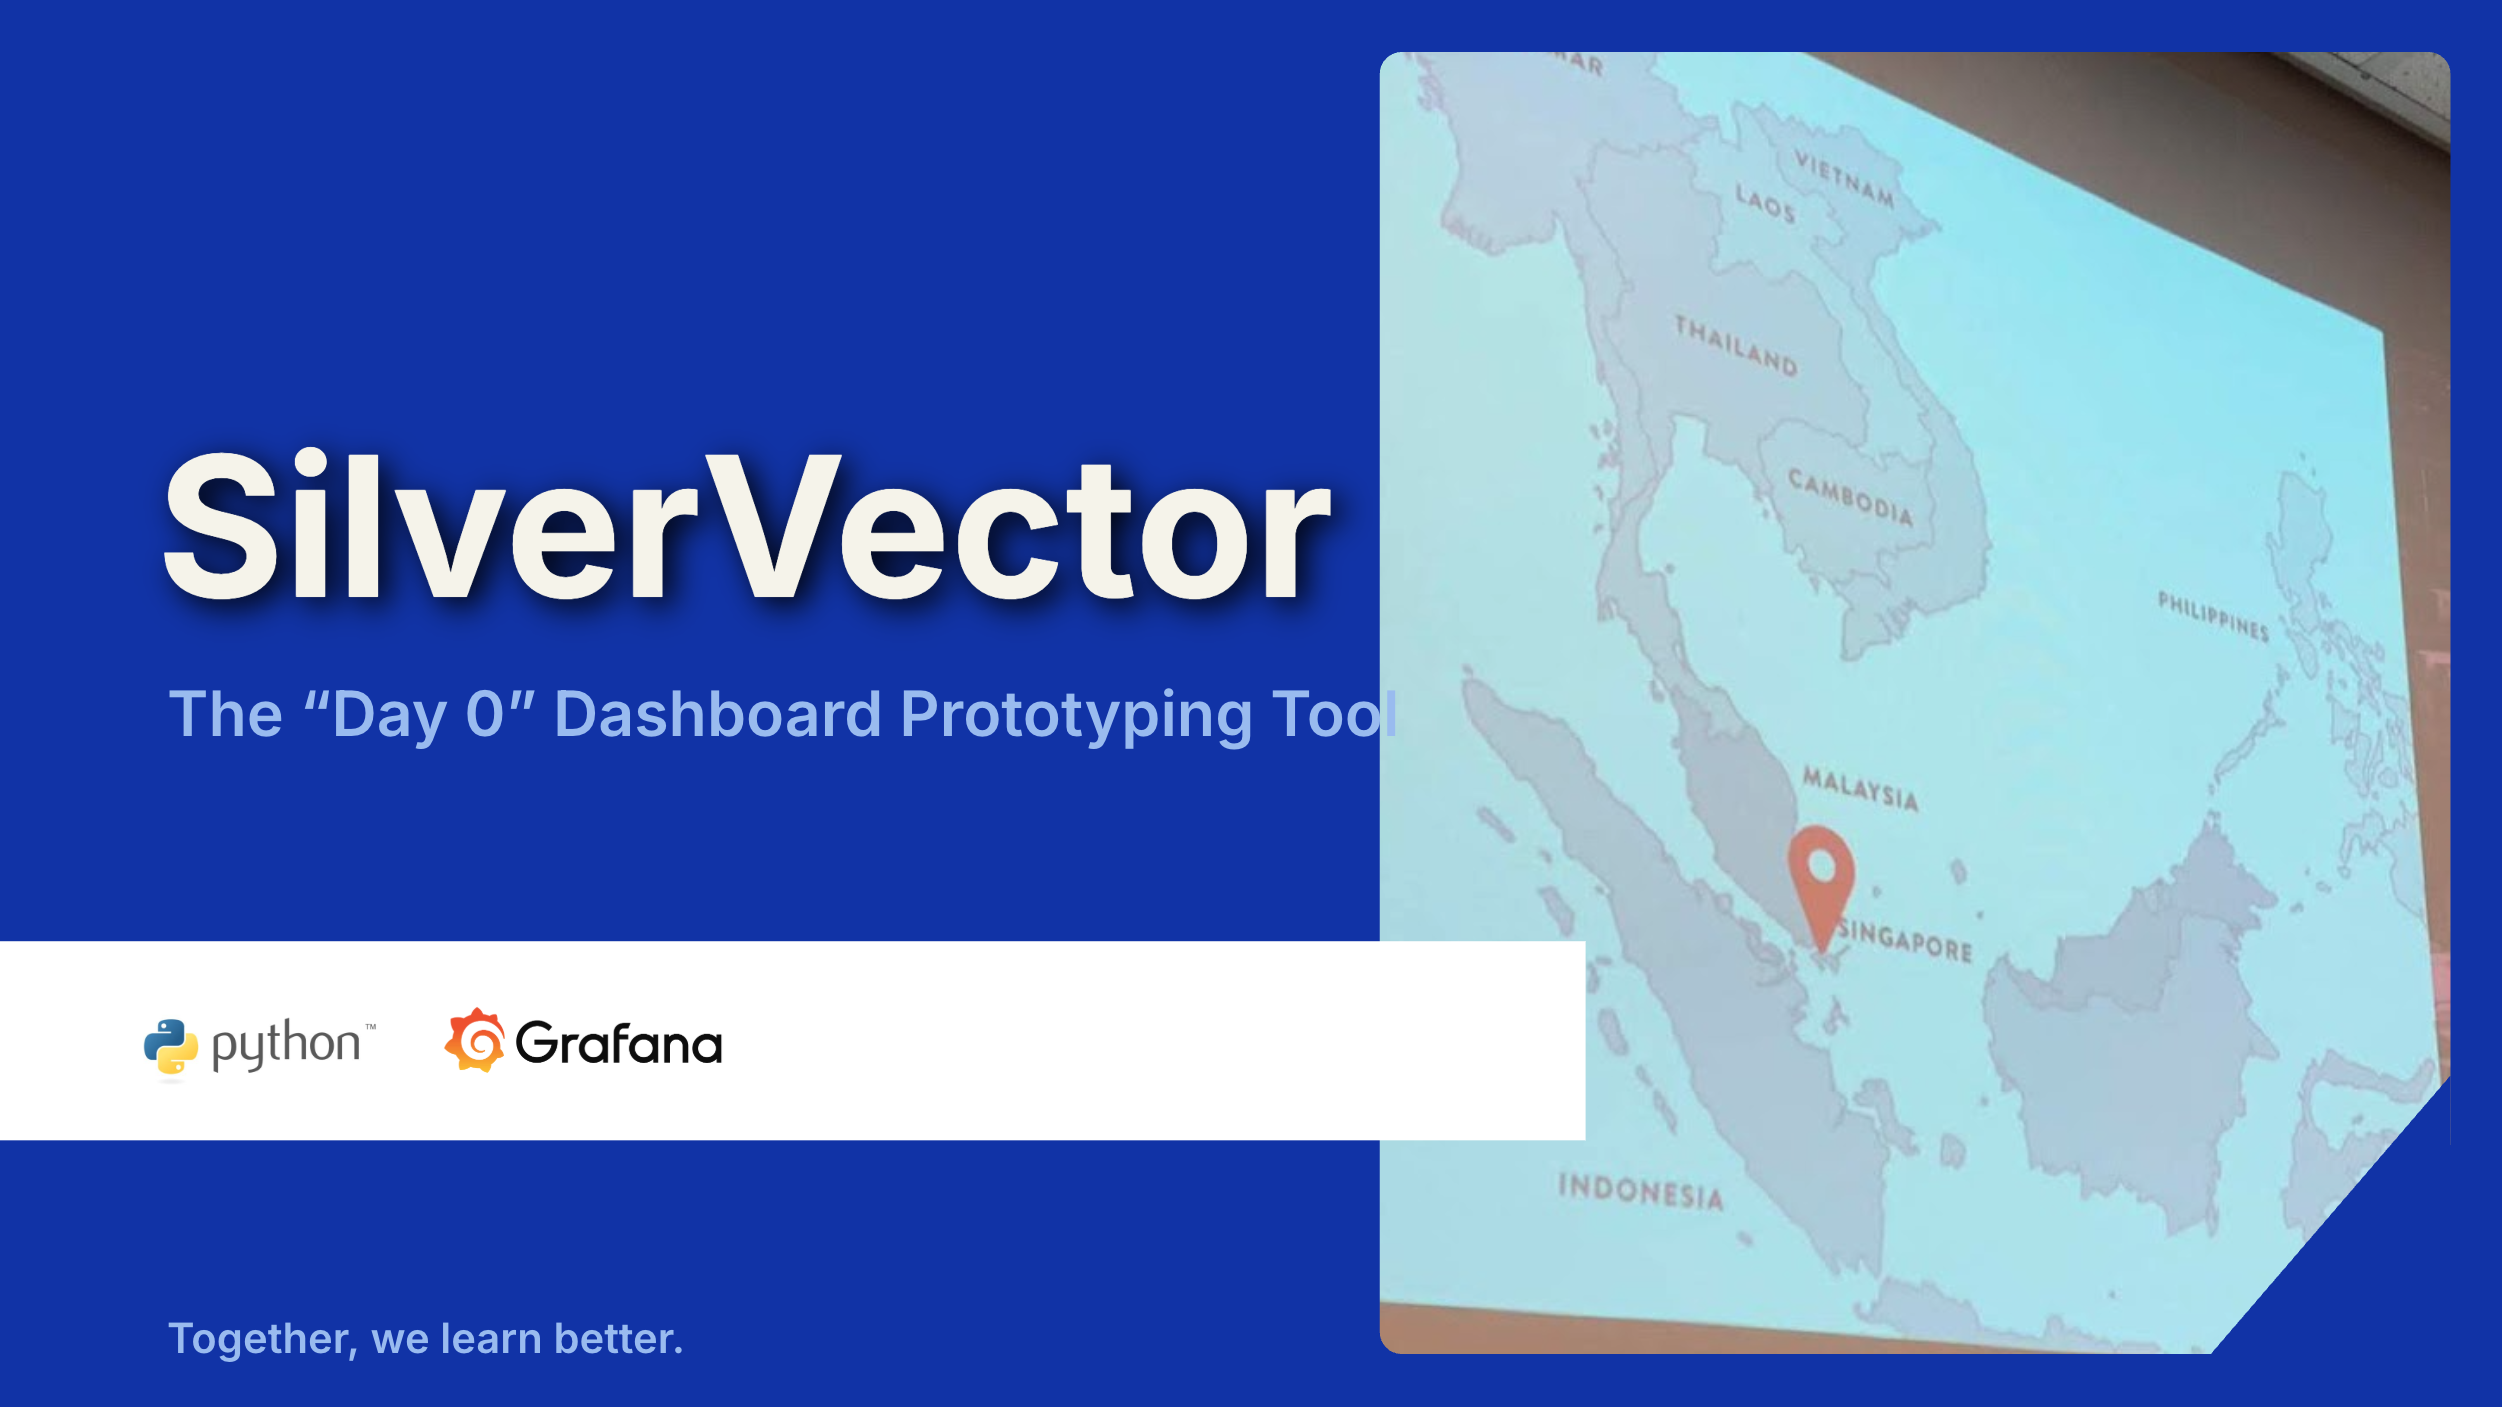
This is why we build SilverVector.

SilverVector generates standard Grafana JSON from DDL.

Why SilverVector?

In Malaysia and Singapore, SMEs are going digital very fast. However, they rarely have a full DevOps team. Usually, they just rely on The Solo Engineer, i.e. the freelancer, the agency developer, or the “full-stack developer” who does everything.

A common mistake in growing SMEs is asking full-stack developers to build meaningful business insights. The result is almost always a custom-coded “Admin Panel”.

While functional, these custom tools are hidden technical debt:

  • High Maintenance: Every new metric requires a code change and a deployment;
  • Poor Performance: Custom dashboards are often unoptimised;
  • Lack of Standards: Every internal tool looks different.
Custom panels developed in-house in SMEs are often ugly, hard to maintain, and slow because they often lack proper pagination or caching.

SilverVector allows you to skip building the internal tool entirely. By treating Grafana as your GUI layer, you get a standardised, performant, and beautiful interface for free. You supply the SQL and Grafana handles the rendering.

In addition, to some of the full-stack developers, building a proper Grafana dashboard from scratch involves hours of repetitive GUI clicking.

For an SME, “Zero Orders in the last hour” is not just a statistic. Instead, it is an emergency. SilverVector focuses on this Operational Intelligence, helping backend engineers visualise their system health easily.

Why not just use Terraform?

Terraform (and GitOps) is the gold standard for long-term maintenance. But terraform import requires an existing resource. SilverVector acts as the prototyping engine. It helps us in Day 0, i.e. getting us from “Zero” to “First Draft” in a few seconds. Once the client approves the dashboard, we can export that JSON into our GitOps workflow. We handle the chaotic “Drafting Phase” so our Terraform manages the “Stable Phase.”

Another big problem is trust. In the enterprise world, shadow IT is a nightmare. In the SME world, managers are also afraid to give API keys or database passwords to a tool they just found on GitHub.

SilverVector was built on a strict “Zero-Knowledge” principle.

  • We do not ask for database passwords;
  • We do not ask for API keys;
  • We do not connect to your servers.

We only ask for one safe thing: Schema (DDL). By checking the structure of your data (like CREATE TABLE orders...) and not the meaningful data itself, we can generate the dashboard configuration file. You take that file and upload it to your own Grafana yourself. We never connect to your production environment.

Key Technical Implementation

Building this tool means we act like a translator: SQL DDL -> Grafana JSON Model. Here is how we did it.

We did not use a heavy full SQL engine because we are not trying to be a database. We simply want to be a shortcut.

We built SilverVectorParser using regex and simple logic to solve the “80/20” problem. It guesses likely metrics (e.g., column names like amount, duration) and dimensions. However, regex is not perfect. That is why the Tooling matters more than the Parser. If our logic guesses wrong, you do not have to debug our python code. You just uncheck the box in the UI.

The goal is not to be a perfect compiler. Instead, it is to be a smart assistant that types the repetitive parts for you.

Screenshot of the SilverVector UI Main Window.

For the interface, we choose CustomTkinter. Why a desktop GUI instead of a web app?

It comes down to Speed and Reality.

  • Offline-First: Network infrastructure in parts of Malaysia, from remote industrial sites in Sarawak to secure server basements in Johor Bahru can be spotty. This is critical for engineers deploying to Self-Hosted Grafana (OSS) instances where Internet access is restricted or unavailable;
  • Zero Configuration: Connecting a tool to your Grafana API requires generating service accounts, copying tokens, and configuring endpoints. It is tedious. SilverVector bypasses this “configuration tax” by generating a standard JSON file when you can just generate, drag, and drop.
  • Human-in-the-Loop: A command-line tool runs once and fails if the regex is wrong. Our UI allows you to see the detection and correct it instantly via checkboxes before generating the JSON.

To make the tool feel like a real developer product, we integrate a proper code experience. We use pygments to read both the input SQL and the output JSON. We then map those tokens to Tkinter text tags colours. This makes it look familiar, so you can spot syntax errors in the input schema easily.

Close-up zoom of the text editor area in SilverVector.

Technical Note:
To ensure the output actually works when you import it:

  1. Datasources: We set the Data Source as a Template Variable. On import, Grafana will simply ask you: “Which database do you want to use?” You do not need to edit the JSON helper IDs manually.
  2. Performance: Time-series queries automatically include time range clauses (using $__from and $__to). This prevents the dashboard from accidentally scanning your entire 10-year history every time you refresh;
  3. SQL Dialects: The current version uses SQLite for the local demo so anyone can test it immediately without spinning up Docker containers.

Future-Proofing for Growth

SilverVector is currently in its MVP phase, and the vision is simple: Productivity.

If you are a consultant or an engineer who has to set up observability for many projects, you know the pain of configuring panel positions manually. SilverVector is the painkiller. Stop writing thousands of lines of JSON boilerplate. Paste your schema, click generate, and spend your time on the queries that actually matter.

The resulting Grafana dashboard generated by SilverVector.

A sensible question that often comes up is: “Is this just a short-term fix? What happens when I hire a real team?”

The answer lies in Standardisation.

SilverVector generates standard Grafana JSON, which is the industry default. Since you own the output file, you will never be locked in to our tool.

  1. Ownership: You can continue to edit the dashboard manually in Grafana OSS or Grafana Cloud as your requirements change;
  2. Scalability: When you eventually hire a full DevOps engineer or migrate to Grafana Cloud, the JSON generated by SilverVector is fully compatible. You can easily convert it into advanced Code (like Terraform) later. We simply do the heavy lifting of writing the first 500 lines for them;
  3. Stability: By building on simple SQL principles, the dashboard remains stable even as your data grows.

In addition, since SilverVector generates SQL queries that read from your database directly, you must be a responsible engineer to ensure your columns (especially timestamps) are indexed properly. A dashboard is only as fast as the database underneath it!

In short, we help you build the foundation quickly so you can renovate freely later.


Check out the open-source project on GitHub: SilverVector Repository.

From k6 to Simulation: Optimising AWS Burstable Instances

Photo Credit: Nitro Card, Why AWS is best!

In cloud infrastructure, the ultimate challenge is building systems that are not just resilient, but also radically efficient. We cannot afford to provision hardware for peak loads 24/7 because it is simply a waste of money.

In this article, I would like to share how to keep this balance using AWS burstable instances, Grafana observability, and discrete event simulation. Here is the blueprint for moving from seconds to milliseconds without breaking the bank.

The Power (and Risk) of Burstable Instances

To achieve radical efficiency, AWS offers the T-series (like T3 and T4g). These instances allow us to pay for a baseline CPU level while retaining the ability to “burst” during high-traffic periods. This performance is governed by CPU Credits.

Modern T3 instances run on the AWS Nitro System, which offloads I/O tasks. This means nearly 100% of the credits we burn are spent on our actual SQL queries rather than background noise.

By default, Amazon RDS T3 instances are configured for “Unlimited Mode”. This prevents our database from slowing down when credits hit zero, but it comes with a cost: We will be billed for the Surplus Credits.

How CPU Credits are earned vs. spent over time. (Source: AWS re:Invent 2018)

The Experiment: Designing the Stress Test

To truly understand how these credits behave under pressure, we built a controlled performance testing environment.

Our setup involved:

  • The Target: An Amazon RDS db.t3.medium instance.
  • The Generator: An EC2 instance running k6. We chose k6 because it allows us to write performance tests in JavaScript that are both developer-friendly and incredibly powerful.
  • The Workload: We simulated 200 concurrent users hitting an API that triggered heavy, CPU-bound SQL queries.

Simulation Fidelity with Micro-service

If we had k6 connect directly to PostgreSQL, it would not look like real production traffic. In order to make our stress test authentic, we introduce a simple NodeJS micro-service to act as the middleman.

This service does two critical things:

  1. Implements a Connection Pool: Using the pg library Pool with a max: 20 setting, it mimics how a real-world app manages database resources;
  2. Triggers the “Heavy Lifting”: The /heavy-query endpoint is designed to be purely CPU-bound. It forces the database to perform 1,000,000 calculations per request using nested generate_series.
const express = require('express');
const { Pool } = require('pg');
const app = express();
const port = 3000;
const pool = new Pool({
user: 'postgres',
host: '${TargetRDS.Endpoint.Address}',
database: 'postgres',
password: '${DBPassword}',
port: 5432,
max: 20,
ssl: { rejectUnauthorized: false }
});

app.get('/heavy-query', async (req, res) => {
try {
const result = await pool.query('SELECT count(*) FROM generate_series(1, 10000) as t1, generate_series(1, 100) as t2');
res.json({ status: 'success', data: result.rows[0] });
} catch (err) {
res.status(500).json({ error: err.message }); }
});

app.listen(port, () => console.log('API listening'));

In our k6 load test, we do not just flip a switch. We design a specific three-stage lifecycle for our RDS instance:

  1. Ramp Up: We started with a gradual ramp-up from 0 to 50 users. This allows the connection pool to warm up and ensures we are not seeing performance spikes just from initial handshakes;
  2. High-load Burn: We push the target to 200 concurrent users. These users will be hitting a /heavy-query endpoint that forces the database to calculate a million rows per second. This stage is designed to drain the CPUCreditBalance and prove that “efficiency” has its limits;
  3. Ramp Down: Finally, we ramp back down to zero. This is the crucial moment in Grafana where we watch to see if the CPU credits begin to accumulate again or if the instance remains in a “debt” state.
import http from 'k6/http';
import { check, sleep } from 'k6';

export const options = {
stages: [
{ duration: '30s', target: 50 }, // Profile 1: Ramp up
{ duration: '5m', target: 200 }, // Profile 1: Burn
{ duration: '1m', target: 0 }, // Profile 1: Ramp down
],
};

export default function () {
const res = http.get('http://localhost:3000/heavy-query');
check(res, { 'status was 200': (r) => r.status == 200 });
sleep(0.1);
}

Monitoring with Grafana

If we are earning CPU credits slower than we are burning them, we are effectively walking toward a performance (or financial) cliff. To be truly resilient, we must monitor our CPUCreditBalance.

We use Grafana to transform raw CloudWatch signals into a peaceful dashboard. While “Unlimited Mode” keeps the latency flat, Grafana reveals the truth: Our credit balance decreases rapidly when CPU utilisation goes up to 100%.

Grafana showing the inverse relationship between high CPU Utilisation and a dropping CPU Credit Balance.

Predicting the Future with Discrete Event Simulation

Physical load testing with k6 is essential, but it takes real-time to run and costs real money for instance uptime.

To solve this, we modelled Amazon RDS T3 instance using discrete event simulation and the Token Bucket Algorithm. Using the SNA library, a lightweight open-source library for C# and .NET, we can now:

  • Simulate a 24-hour traffic spike in just a few seconds;
  • Mathematically prove whether a rds.t3.medium is more cost-effective for a specific workload;
  • Predict exactly when an instance will run out of credits before we ever deploy it.
Simulation results from the SNA.

Final Thoughts

Efficiency is not just about saving money. Instead, it is about understanding the mathematical limits of our architecture. By combining AWS burstable instances with deep observability and predictive discrete event simulation, we can build systems that are both lean and unbreakable.

For those interested in the math behind the simulation, check out the SNA Library on GitHub.

A Kubernetes Lab for Massively Parallel .NET Parameter Sweeps

Let’s start with a problem that many of us in the systems engineering world have faced. You have a computationally intensive application such as a financial model, a scientific process, or in my case, a Discrete Event Simulation (DES). The code is correct, but it is slow.

In some DES problems, to get a statistically reliable answer, you cannot just run it once. You need to run it 5,000 times with different inputs, which is a massive parameter sweep combined with a Monte Carlo experiment to average out the randomness.

If you run this on your developer machine, it will finish in 2026. If you rent a single massive VM on cloud, you are burning money while one CPU core works and the others idle.

This is a brute-force computation problem. How do you solve it without rewriting your entire app? You build a simulation lab on Kubernetes. Here is the blueprint.

About Time

My specific app is a DES built with a C# library called SNA. In DES, the integrity of the entire system depends on a single, unified virtual clock and a centralised Future Event List (FEL). The core promise of the simulation engine is to process events one by one, in strict chronological order.

The FEL is a core component of a DES, which manages and schedules all future events that will occur in the simulation.

This creates an architectural barrier. You cannot simply chop a single simulation into pieces and run them on different pods on Kubernetes. Each pod has its own system clock, and network latency would destroy the causal chain of events. A single simulation run is, by its nature, an inherently single-threaded process.

We cannot parallelise the simulation, but we can parallelise the experiment.

This is what is known as an Embarrassingly Parallel problem. Since the multiple simulation runs do not need to talk to each other, we do not need a complex distributed system. We need an army of independent workers.

The Blueprint: The Simulation Lab

To solve this, I moved away from the idea of a “server” and toward the idea of a “lab”.

Our architecture has three components:

  • The Engine: A containerised .NET app that can run one full simulation and write its results as structured logs;
  • The Orchestrator: A system to manage the parameter sweep, scheduling thousands of simulation pods and ensuring they all run with unique inputs;
  • The Observatory: A centralised place to collect and analyse the structured results from the entire army of pods.

The Engine: Headless .NET

The foundation is a .NET console programme.

We use System.CommandLine to create a strict contract between the container and the orchestrator. We expose key variables of the simulation as CLI arguments, for example, arrival rates, resource counts, service times.

using System.CommandLine;

var rootCommand = new RootCommand
{
Description = "Discrete Event Simulation Demo CLI\n\n" +
"Use 'demo <subcommand> --help' to view options for a specific demo.\n\n" +
"Examples:\n" +
" dotnet DemoApp.dll demo simple-generator\n" +
" dotnet DemoApp.dll demo mmck --servers 3 --capacity 10 --arrival-secs 2.5"
};

// Show help when run with no arguments
if (args.Length == 0)
{
Console.WriteLine("No command provided. Showing help:\n");
rootCommand.Invoke("-h"); // Show help
return 1;
}

// ---- Demo: simple-server ----
var meanArrivalSecondsOption = new Option<double>(
name: "--arrival-secs",
description: "Mean arrival time in seconds.",
getDefaultValue: () => 5.0
);

var simpleServerCommand = new Command("simple-server", "Run the SimpleServerAndGenerator demo");
simpleServerCommand.AddOption(meanArrivalSecondsOption);

simpleServerCommand.SetHandler((double meanArrivalSeconds) =>
{
Console.WriteLine($"====== Running SimpleServerAndGenerator (Mean Arrival (Unit: second)={meanArrivalSeconds}) ======");
SimpleServerAndGenerator.RunDemo(loggerFactory, meanArrivalSeconds);
}, meanArrivalSecondsOption);

var demoCommand = new Command("demo", "Run a simulation demo");
demoCommand.AddCommand(simpleServerCommand);

rootCommand.AddCommand(demoCommand);

return await rootCommand.InvokeAsync(args);

This console programme is then packaged into a Docker container. That’s it. The engine is complete.

The Orchestrator: Unleashing an Army with Argo Workflows

How do you manage a great number of pods without losing your mind?

My first attempt was using standard Kubernetes Jobs. Kubernetes Jobs are primitive, so they are hard to visualise, and managing retries or dependencies requires writing a lot of fragile bash scripts.

The solution is Argo Workflows.

Argo allows us to define the entire parameter sweep as a single workflow object. The killer feature here is the withItems. Alternative, using withParam loop, we can feed Argo a JSON list of parameter combinations, and it handles the rest: Fan-out, throttling, concurrency control, and retries.

apiVersion: argoproj.io/v1alpha1
kind: Workflow
metadata:
generateName: sna-simple-server-job-
spec:
entrypoint: sna-demo
serviceAccountName: argo-workflow
templates:
- name: sna-demo
steps:
- - name: run-simulation
template: simulation-job
arguments:
parameters:
- name: arrival-secs
value: "{{item}}"
withItems: ["5", "10", "20"]

- name: simulation-job
inputs:
parameters:
- name: arrival-secs
container:
image: chunlindocker/sna-demo:latest
command: ["dotnet", "SimNextgenApp.Demo.dll"]
args: ["demo", "simple-server", "--arrival-secs", "{{inputs.parameters.arrival-secs}}"]

This YAML file is our lab manager. It can also be extended to support scheduling, retries, and parallelism, transforming a complex manual task into a single declarative manifest.

The Argo Workflow UI with the fan-out/parallel nodes using the YAML above.

Instead of managing pods, we are now managing a definition of an experiment.

The Observatory: Finding the Needle in a Thousand Haystacks

With a thousand pods running simultaneously, kubectl logs is useless. You are generating gigabytes of text per minute. If one simulation produces an anomaly, finding it in a text stream is impossible.

We solve this with Structured Logging.

By using Serilog, our .NET Engine does not just write text. Instead, it emits machine-readable events with key-value pairs for our parameters and results. Every log entry contains the input parameters (for example, { "WorkerCount": 5, "ServiceTime": 10 }) attached to the result.

These structured logs are sent directly to a centralised platform like Seq. Now, instead of a thousand messy log streams, we have a single, queryable database of our entire experiment results.

Viewing the structured log on Seq generated with Serilog.

Wrap-Up: A Reusable Pattern

This architecture allows us to treat the Kubernetes not just as a place to host websites, but as a massive, on-demand supercomputer.

By separating the Engine from the Orchestrator and the Observatory, we have taken a problem that was too slow for a single machine and solved it using the native strengths of the Kubernetes. We did not need to rewrite the core C# logic. Instead, we just needed to wrap it in a clean interface and unleash a container army to do the work.

The full source code for the SNA library and the Argo workflow examples can be found on GitHub: https://github.com/gcl-team/SNA

The turnout for my DES session in Taipei confirmed a growing hunger in our industry for proactive, simulation-driven approaches to engineering.

P.S. I presented an early version of this blueprint at the Hello World Developer Conference 2025 in Taipei. The discussions with other engineers there were invaluable in refining these ideas.

Beyond the Cert: In the Age of AI

For the fourth consecutive year, I have renewed my Azure Developer Associate certification. It is a valuable discipline that keeps my knowledge of the Azure ecosystem current and sharp. The performance report I received this year was particularly insightful, highlighting both my strengths in security fundamentals and the expected gaps in platform-specific nuances, given my recent work in AWS.

Objectives

Renewing Azure certification is a hallmark of a professional craftsman because it sharpens our tools, knowing our trade. For a junior or mid-level engineer, this path of structured learning and certification is the non-negotiable foundation of a solid career. It is the path I walked myself. It builds the grammar of our trade.

However, for a senior engineer, for an architect, the game has changed. The world is now saturated with competent craftsmen who know the grammar. In the age of AI-assisted coding and brutal corporate “flattening,” simply knowing the tools is no longer a defensible position. It has become table stakes.

The paradox of the senior cloud software engineer is that the very map that got us here, i.e. the structured curriculum and the certification path, is insufficient to guide us to the next level. The renewal assessment results for Microsoft Certified: Azure Developer Associate I received was a perfect map of the existing territory. However, an architect’s job is not to be a master of the known world. It is to be a cartographer of the unknown. The report correctly identified that I need to master Azure specific trade-offs, like choosing ‘Session’ consistency over ‘Strong’ for low-latency scenarios in CosmosDB. The senior engineer learns that rule. The architect must ask a deeper question: “How can I build a model that predicts the precise cost and P99 latency impact of that trade-off for my specific workload, before I write a single line of code?”

Attending AWS Singapore User Group monthly meetup.

About the Results

Let’s make this concrete by looking at the renewal assessment report itself. It was a gift, not because of the score, but because it is a perfect case study in the difference between the Senior Engineer’s path and the Architect’s.

Where the report suggests mastering Azure Cosmos DB five consistency levels, it is prescribing an act of knowledge consumption. The architect’s impulse is to ask a different question entirely: “How can I quantify the trade-off?” I do not just want to know that Session is faster than Strong. I should know, for a given workload, how much faster, at what dollar cost per million requests, and with what measurable impact on data integrity. The architect’s response is to build a model to turn the vendor’s qualitative best practice into a quantitative, predictive economic decision.

This pattern continues with managed services. The report correctly noted my failure to memorise the specific implementation of Azure Container Apps. The path it offers is to better learn the abstraction. The architect’s path is to become professionally paranoid about abstractions. The question is not “What is Container Apps?” but “Why does this abstraction exist, and what are its hidden costs and failure modes?” The architect’s response is to design experiments or simulations to stress-test the abstraction and discover its true operational boundaries, not just to read its documentation.

DHH has just slain the dragon of Cloud Dependency, the largest, most fearsome dragon in our entire cloud industry. (Twitter Source: DHH)

This is the new mandate for senior engineers in this new world where we keep on listening senior engineers being out of work: We must evolve from being consumers of complexity to being creators of clarity. We must move beyond mastering the vendor’s pre-defined solutions and begin forging our own instruments to see the future.

From Cert to Personal Project

This is why, in parallel to maintaining my certifications, I have embarked on a different kind of professional development. It is a path of deep, first-principles creation. I am building a discrete event simulation engine not as a personal hobby project, but as a way to understand more about the most expensive and unpredictable problems in our industry. My certification proves I can solve problems the “Azure way.” This new work is about discovering the the fundamental truths that govern all cloud platforms.

Certifications are the foundation. They are the bedrock of our shared knowledge. However, they are not the lighthouse. In this new era, we must be both.

AWS + Azure.

Certifications are an essential foundation. They represent the bedrock of our shared professional knowledge and a commitment to maintaining a common standard of excellence. However they are not, by themselves, the final destination.

Therefore, my next major “proof-of-work” will not be another certificate. It will be the first in a series of public, data-driven case studies derived from my personal project.

Ultimately, a certificate proves that we are qualified and contributing members of our professional ecosystem. This next body of work is intended to prove something more than that. We need to actively solve the complex, high-impact problems that challenge our industry. In this new era, demonstrating both our foundational knowledge and our capacity to create new value is no longer an aspiration. Instead, it is the new standard.

Together, we learn better.