From Design to Implementation: Crafting Headless APIs in Orchard Core with Apidog

Last month, I had the opportunity to attend an online meetup hosted by the local Microsoft MVP Dileepa Rajapaksa from the Singapore .NET Developers Community, where I was introduced to ApiDog.

During the session, Mohammad L. U. Tanjim, the Product Manager of ApiDog, gave a detailed walkthrough of the API-First design and how Apidog can be used for this approach.

Apidog helps us to define, test, and document APIs in one place. Instead of manually writing Swagger docs and using API tool separately, ApiDog combines everything. This means frontend developers can get mock APIs instantly, and backend developers as well as QAs can get clear API specs with automatic testing support.

Hence, for the customised headless APIs, we will adopt an API-First design approach. This approach ensures clarity, consistency, and efficient collaboration between backend and frontend teams while reducing future rework.

Session “Build APIs Faster and Together with Apidog, ASP.NET, and Azure” conducted by Mohammad L. U. Tanjim.

API-First Design Approach

By designing APIs upfront, we reduce the likelihood of frequent changes that disrupt development. It also ensures consistent API behaviour and better long-term maintainability.

For our frontend team, with a well-defined API specification, they can begin working with mock APIs, enabling parallel development. This eliminates dependencies where frontend work is blocked by backend completion.

For QA team, API spec will be important to them because it serve as a reference for automated testing. The QA engineers can validate API responses before implementation.

API Design Journey

In this article, we will embark on an API Design Journey by transforming a traditional travel agency in Singapore into an API-first system. To achieve this, we will use Apidog for API design and testing, and Orchard Core as a CMS to manage travel package information. Along the way, we will explore different considerations in API design, documentation, and integration to create a system that is both practical and scalable.

Many traditional travel agencies in Singapore still rely on manual processes. They store travel package details in spreadsheets, printed brochures, or even handwritten notes. This makes it challenging to update, search, and distribute information efficiently.

The reliance on physical posters and brochures of a travel agency is interesting in today’s digital age.

By introducing a headless CMS like Orchard Core, we can centralise travel package management while allowing different clients like mobile apps to access the data through APIs. This approach not only modernises the operations in the travel agency but also enables seamless integration with other systems.

API Design Journey 01: The Design Phase

Now that we understand the challenges of managing travel packages manually, we will build the API with Orchard Core to enable seamless access to travel package data.

Instead of jumping straight into coding, we will first focus on the design phase, ensuring that our API meets the business requirements. At this stage, we focus on designing endpoints, such as GET /api/v1/packages, to manage the travel packages. We also plan how we will structure the response.

Given the scope and complexity of a full travel package CMS, this article will focus on designing a subset of API endpoints, as shown in the screenshot below. This allows us to highlight essential design principles and approaches that can be applied across the entire API journey with Apidog.

Let’s start with eight simple endpoints.

For the first endpoint “Get all travel packages”, we design it with the following query parameters to support flexible and efficient result filtering, pagination, sorting, and text search. This approach ensures that users can easily retrieve and navigate through travel packages based on their specific needs and preferences.

GET /api/v1/packages?page=1&pageSize=20&sortBy=price&sortOrder=asc&destinationId=4&priceRange[min]=500&priceRange[max]=2000&rating=4&searchTerm=spa
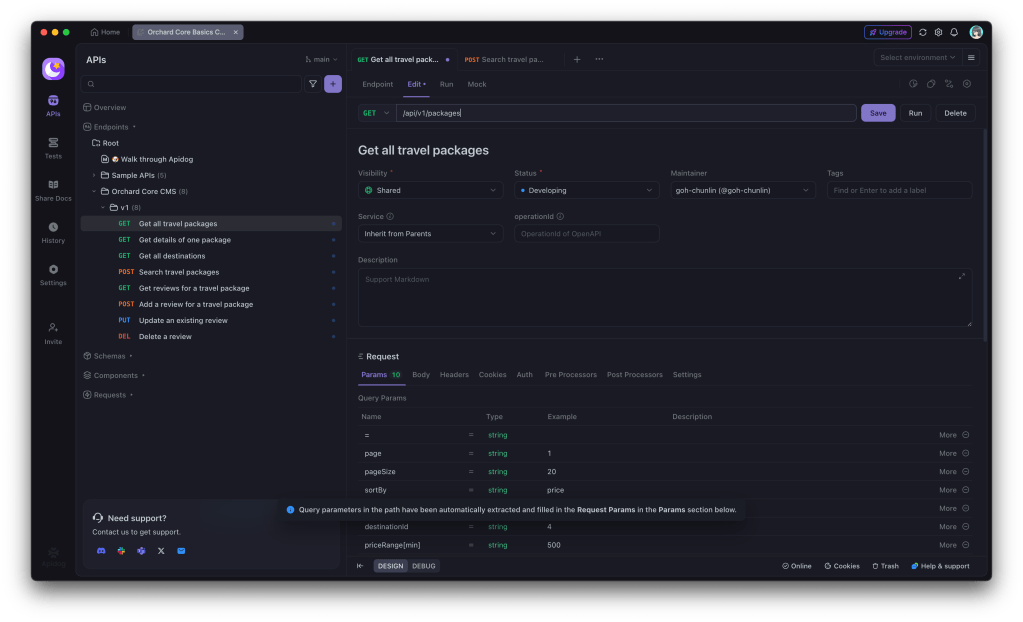
Pasting the API path with query parameters to the Endpoint field will auto populate the Request Params section in Apidog.

Same with the request section, the Response also can be generated based on a sample JSON that we expect the endpoint to return, as shown in the following screenshot.

As shown in the Preview, the response structure can be derived from a sample JSON.

In the screenshot above, the field “description” is marked as optional because it is the only property that does not exist in all the other entry in “data”.

Besides the success status, we also need another important HTTP 400 status code which tells the client that something is wrong with their request.

By default, for generic error responses like HTTP 400, there are response components that we can directly use in Apidog.

The reason why we need HTTP 400 is that, instead of processing an invalid request and returning incorrect or unexpected results, our API should explicitly reject it, ensuring that the client knows what needs to be fixed. This improves both developer experience and API reliability.

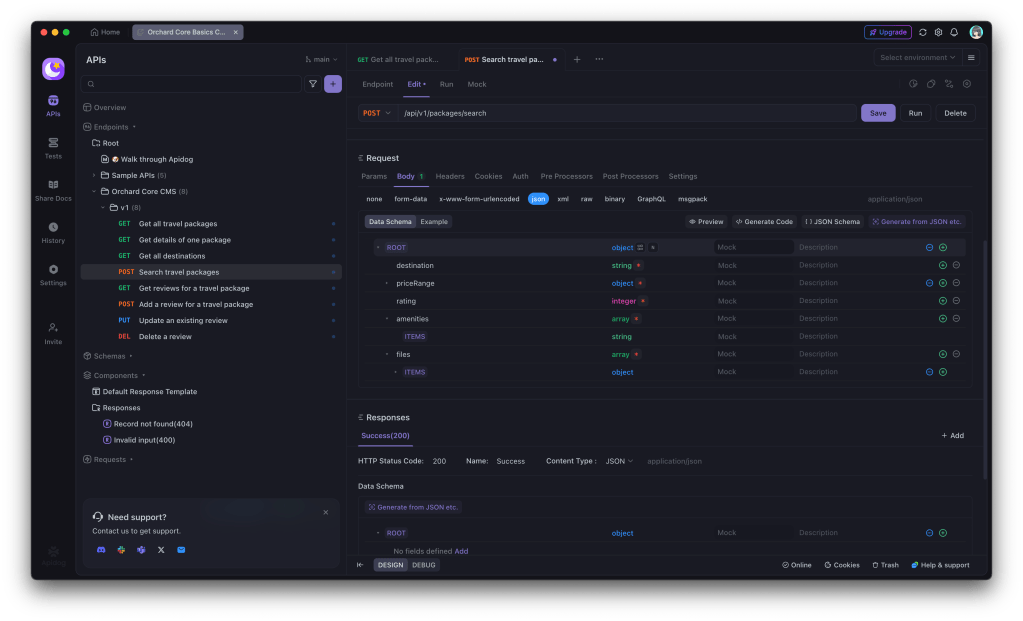
After completing the endpoint for getting all travel packages, we also have another POST endpoint to search travel packages.

While GET is the standard method for retrieving data from an API, complex search queries involving multiple parameters, filters, or file uploads might require the use of a POST request. This is particularly true when dealing with advanced search forms or large amounts of data, which cannot be easily represented as URL query parameters. In these cases, POST allows us to send the parameters in the body of the request, ensuring the URL remains manageable and avoiding URL length limits.

For example, let’s assume this POST endpoint allows us to search for travel packages with the following body.

{
"destination": "Singapore",
"priceRange": {
"min": 500,
"max": 2000
},
"rating": 4,
"amenities": ["pool", "spa"],
"files": [
{
"fileType": "image",
"file": "base64-encoded-image-content"
}
]
}

We can also easily generate the data schema for the body by pasting this JSON as example into Apidog, as shown in the screenshot below.

Setting up the data schema for the body of an HTTP POST request.

When making an HTTP POST request, the client sends data to the server. While JSON in the request body is common, there is also another format used in APIs, i.e. multipart/form-data (also known as form-data).

The form-data is used when the request body contains files, images, or binary data along with text fields. So, if our endpoint /api/v1/packages/{id}/reviews allows users to submit both text (review content and rating) and an image, using form-data is the best choice, as demonstrated in the following screenshot.

Setting up a request body which is multipart/form-data in Apidog.

API Design Journey 02: Prototyping with Mockups

When designing the API, it is common to debate, for example, whether reviews should be nested inside packages or treated as a separate resource. By using Apidog, we can quickly create mock APIs for both versions and tested how they would work in different use cases. This helps us make a data-driven decision instead of endless discussions.

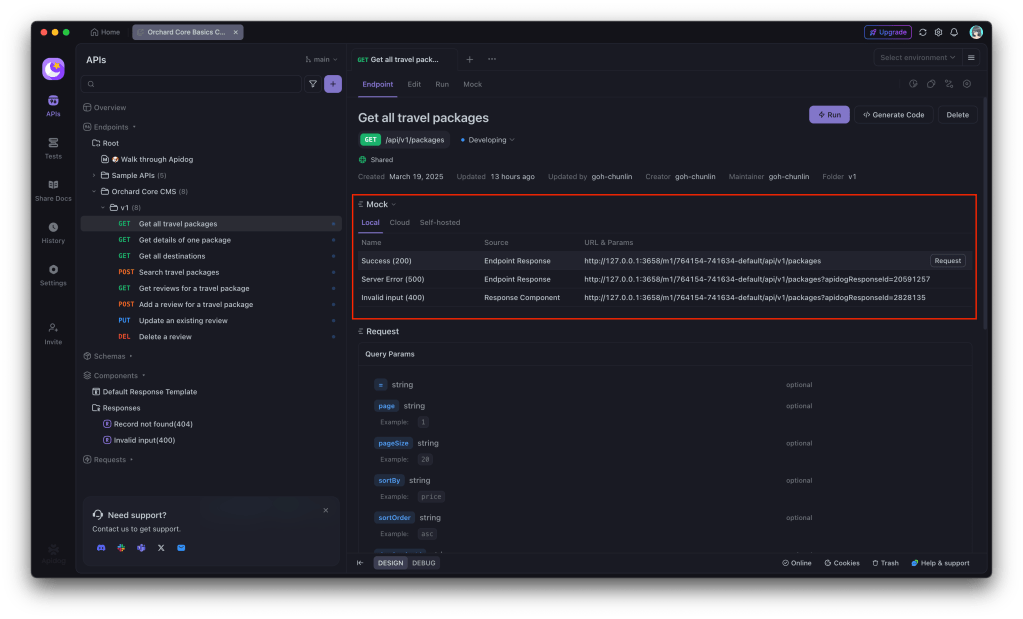
Once our endpoint is created, Apidog automatically generates a mock API based on our defined API spec, as shown in the following screenshot.

A list of mock API URLs for our “Get all travel packages” endpoint.

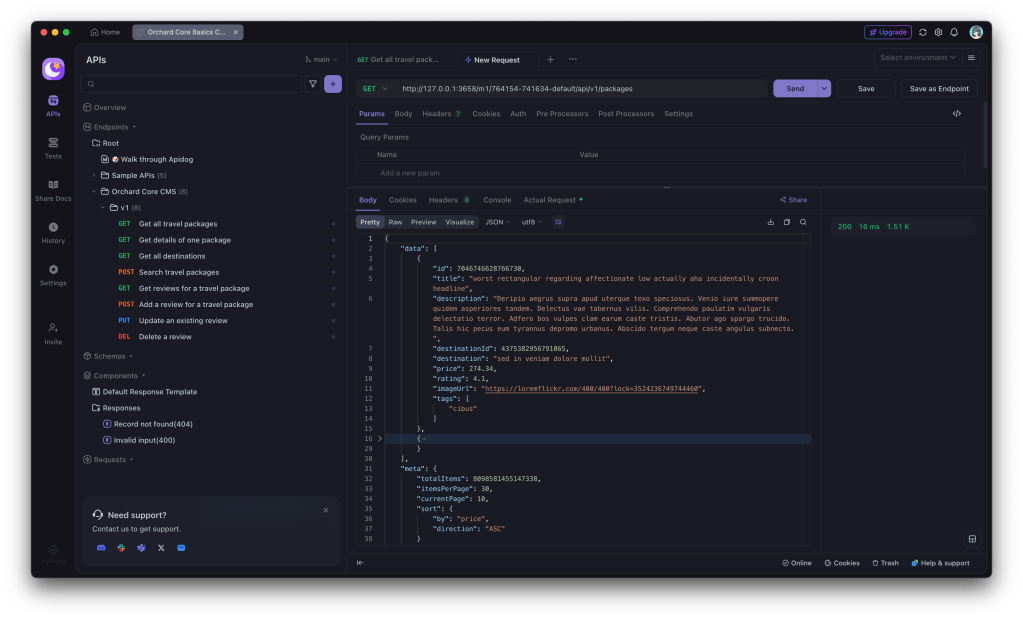
Clicking on the “Request” button next to each of the mock API URL will bring us to the corresponding mock response, as shown in the following screenshot.

Default mock response for HTTP 200 of our first endpoint “Get all travel packages”.

As shown in the screenshot above, some values in the mock response are not making any sense, for example negative id and destinationId, rating which is supposed to be between 1 and 5, “East” as sorting direction, and so on. How could we fix them?

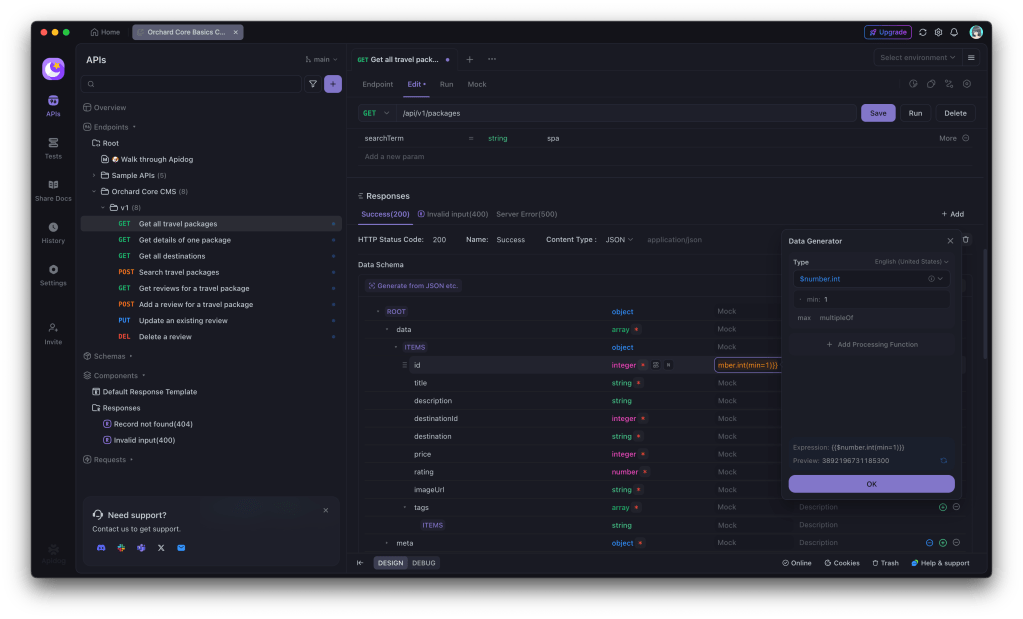
Firstly, we will set the id (and destinationId) to be any positive integer number starting from 1.

Setting id to be a positive integer number starting from 1.

Secondly, we update both the price and rating to be float. In the following screenshot, we specify that the rating can be any float from 1.0 to 5.0 with single fraction digit.

Apidog is able to generate an example based on our condition under “Preview”.

Finally, we will indicate that the sorting direction can only be either ASC or DESC, as shown in the following screenshot.

Configuring the possible value for the direction field.

With all the necessary mock values configuration, if we fetch the mock response again, we should be able to get a response with more reasonable values, as demonstrated in the screenshot below.

Now the mock response looks more reasonable.

With the mock APIs, our frontend developers will be able to start building UI components without waiting for the backend to be completed. Also, as shown above, a mock API responds instantly, unlike real APIs that depend on database queries, authentication, or network latency. This makes UI development and unit testing faster.

Speaking of testing, some test cases are difficult to create with a real API. For example, what if an API returns an error (500 Internal Server Error)? What if there are thousands of travel packages? With a mock API, we can control the responses and simulate rare cases easily.

In addition, Apidog supports returning different mock data based on different request parameters. This makes the mock API more realistic and useful for developers. This is because if the mock API returns static data, frontend developers may only test one scenario. A dynamic mock API allows testing of various edge cases.

For example, our travel package API allows admins to see all packages, including unpublished ones, while regular users only see public packages. We thus can setup in such a way that different bearer token will return different set of mock data.

We are setting up the endpoint to return drafts when a correct admin token is provided in the request header with Mock Expectation.

With Mock Expectation feature, Apidog can return custom responses based on request parameters as well. For instance, it can return normal packages when the destinationId is 1 and trigger an error when the destinationId is 2.

API Design Journey 03: Documenting Phase

With endpoints designed properly in earlier two phases, we can now proceed to create documentation which is offers a detailed explanation of the endpoints in our API. This documentation will include the information such as HTTP methods, request parameters, and response formats.

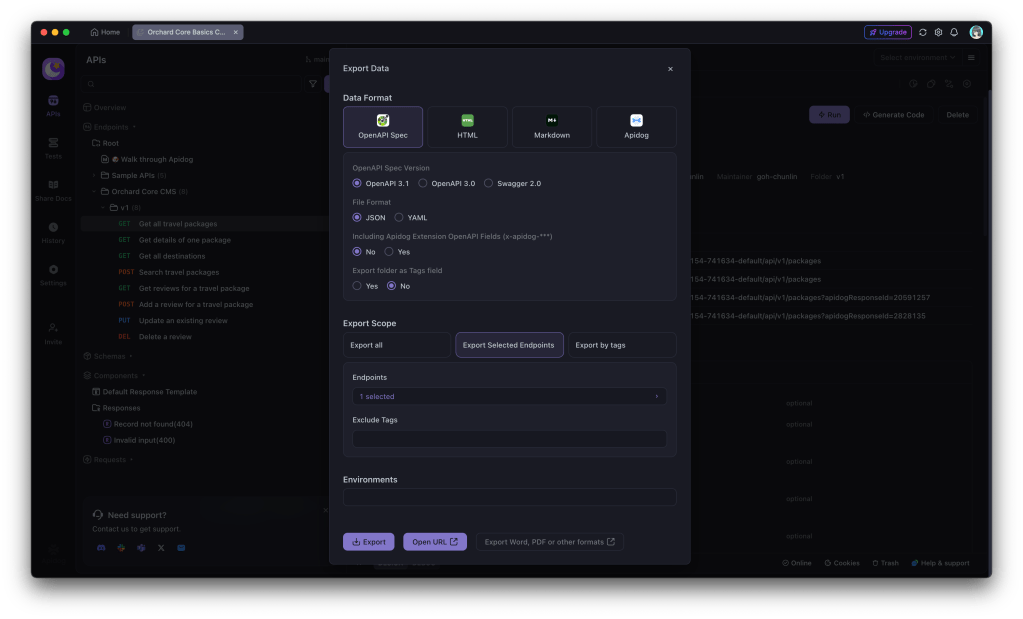
Fortunately, Apidog makes the documentation process smooth by integrating well within the API ecosystem. It also makes sharing easy, letting us export the documentation in formats like OpenAPI, HTML, and Markdown.

Apidog can export API spec in formats like OpenAPI, HTML, and Markdown.

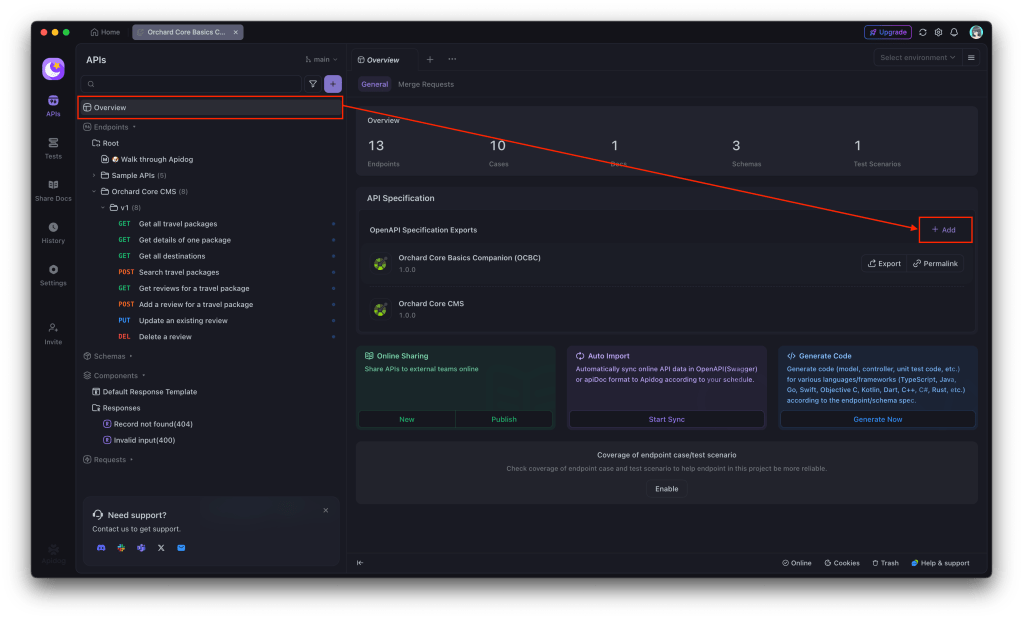
We can also export our documentation on folder basis to OpenAPI Specification in Overview, as shown below.

Custom export configuration for OpenAPI Specification.

We can also export the data as an offline document. Just click on the “Open URL” or “Permalink” button to view the raw JSON/YAML content directly in the Internet browser. We then can place the raw content into the Swagger Editor to view the Swagger UI of our API, as demonstrated in the following screenshot.

The exported content from Apidog can be imported to Swagger Editor directly.

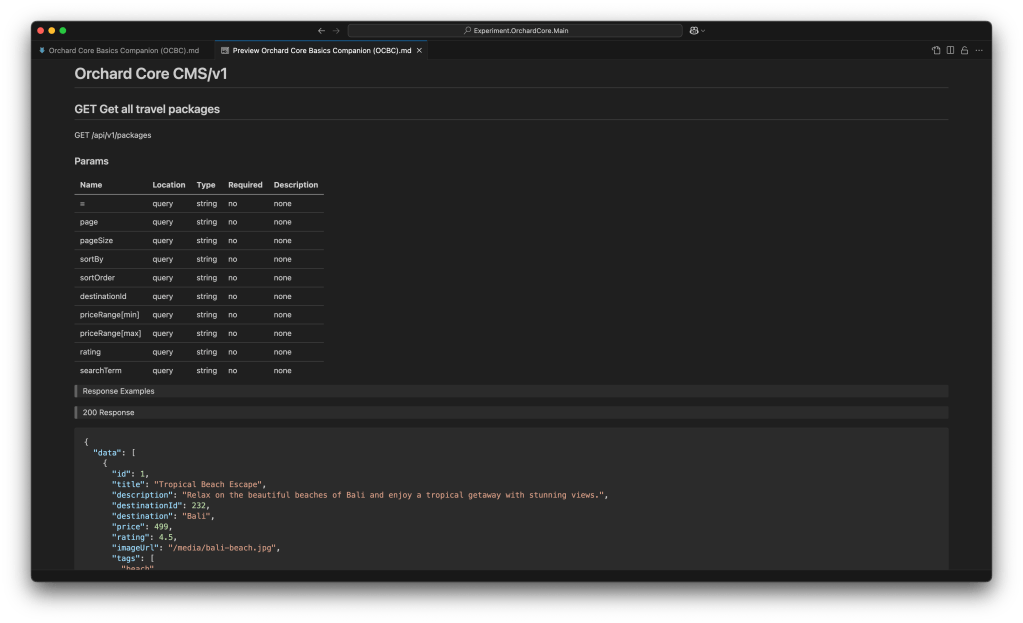
Let’s say now we need to share the documentation with our team, stakeholders, or even the public. Our documentation thus needs to be accessible and easy to navigate. That is where exporting to HTML or Markdown comes in handy.

Documentation is Markdown format, generated by Apidog.

Finally, Apidog also allows us to conveniently publish our API documentation as a webpage. There are two options: Quick Share, for sharing parts of the docs with collaborators, and Publish Docs, for making the full documentation publicly available.

Quick Share is great for API collaborators because we can set a password for access and define an expiration time for the shared documentation. If no expiration is set, the link stays active indefinitely.
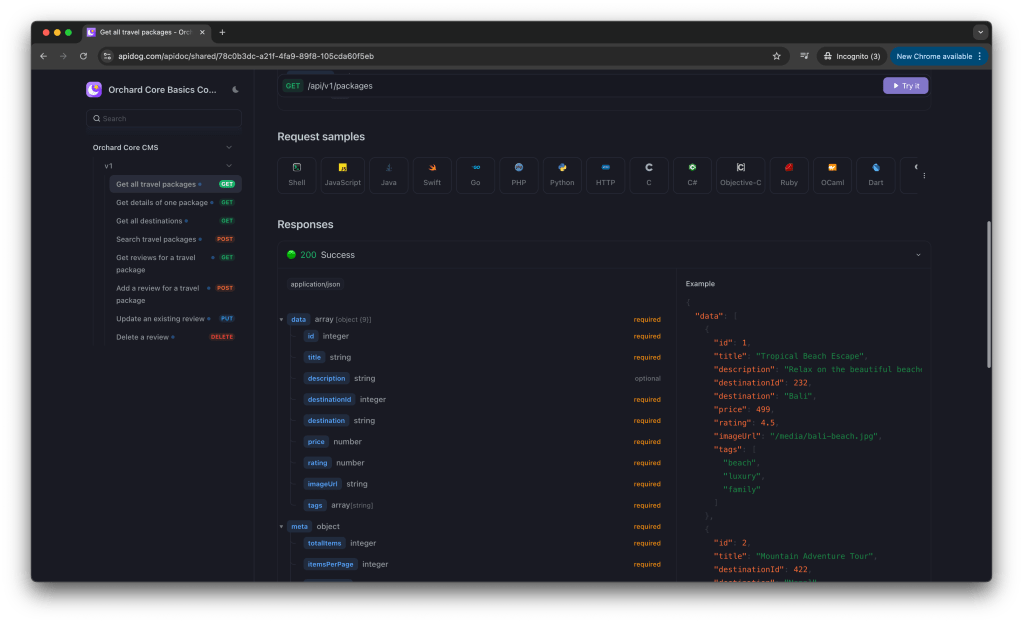
API spec presented as a website and accessible by the collaborators. It also enables collaborators to generate client code for different languages.

API Design Journey 04: The Development Phase

With our API fully designed, mocked, and documented, it is time to bring it to life with actual code. Since we have already defined information such as the endpoints, request format, and response formats, implementation becomes much more straightforward. Now, let’s start building the backend to match our API specifications.

Orchard Core generally supports two main approaches for designing APIs, i.e. Headless and Decoupled.

In the headless approach, Orchard Core acts purely as a backend CMS, exposing content via APIs without a frontend. The frontend is built separately.

In the decoupled approach, Orchard Core still provides APIs like in the headless approach, but it also serves some frontend rendering. It is a hybrid approach because we use Razor Pages some parts of the UI are rendered by Orchard, while others rely on APIs.

So in fact, we can combine the good of both approaches so that we can build a customised headless APIs on Orchard Core using services like IOrchardHelper to fetch content dynamically and IContentManager to allow us full CRUD operations on content items. This is in fact the approach mentioned in the Orchard Core Basics Companion (OCBC) documentation.

For the endpoint of getting a list of travel packages, i.e. /api/v1/packages, we can define it as follows.

[ApiController]
[Route("api/v1/packages")]
public class PackageController(
IOrchardHelper orchard,
...) : Controller
{
[HttpGet]
public async Task<IActionResult> GetTravelPackages()
{
var travelPackages = await orchard.QueryContentItemsAsync(q =>
q.Where(c => c.ContentType == "TravelPackage"));

...

return Ok(travelPackages);
}

...
}

In the code above, we are using Orchard Core Headless CMS API and leveraging IOrchardHelper to query content items of type “TravelPackage”. We are then exposing a REST API (GET /api/v1/packages) that returns all travel packages stored as content items in the Orchard Core CMS.

API Design Journey 05: Testing of Actual Implementation

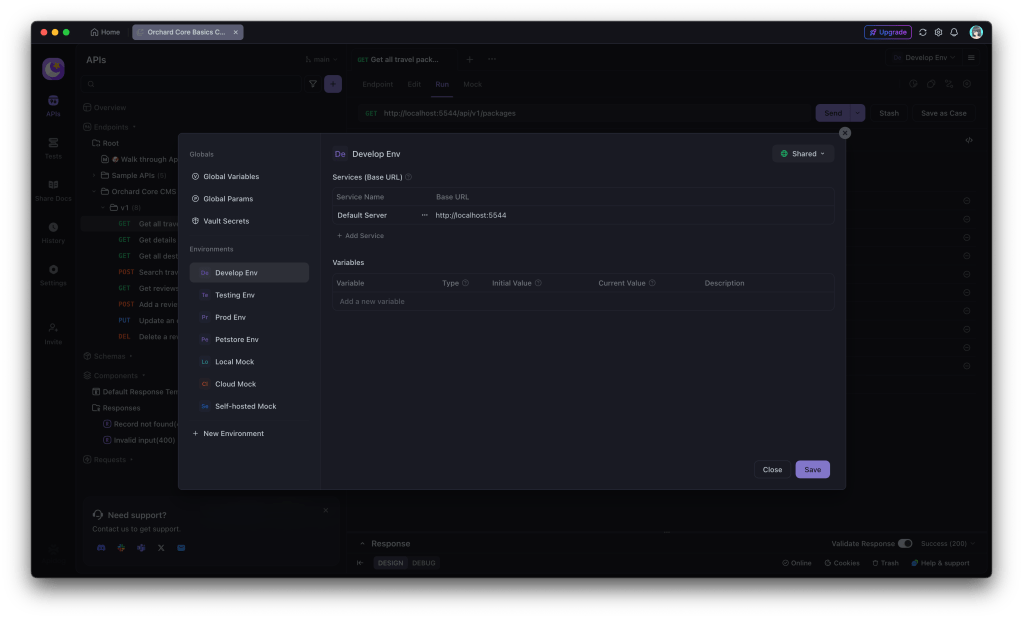
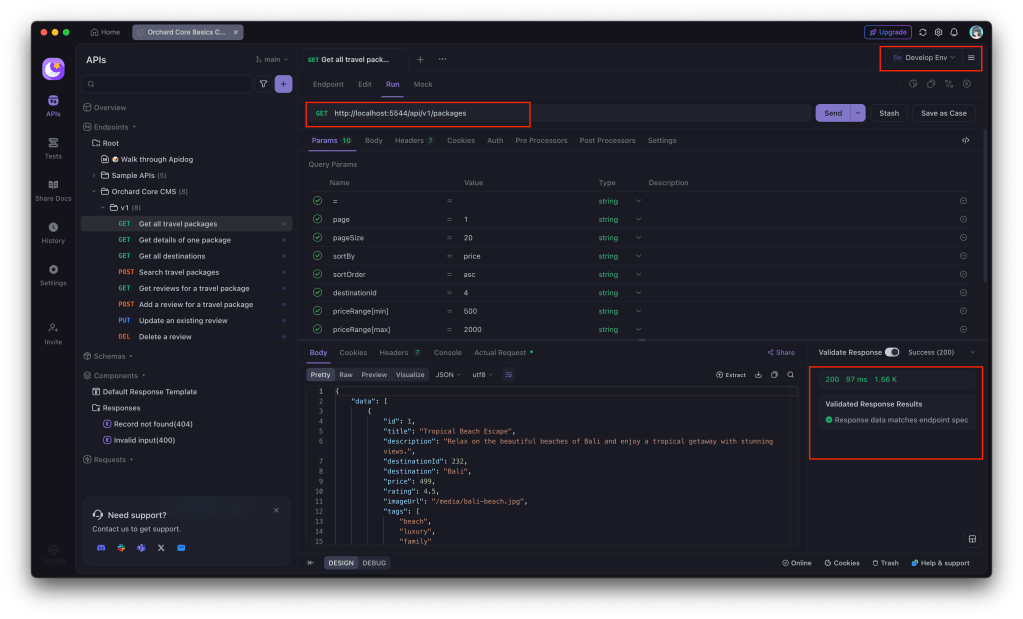
Let’s assume our Dev Server Base URL is localhost. This URL is set as a variable in the Develop Env, as shown in the screenshot below.

Setting Base URL for Develop Env on Apidog.

With the environment setup, we can now proceed to run our endpoint under that environment. As shown in the following screenshot, we are able to immediately validate the implementation of our endpoint.

Validated the GET endpoint under Develop Env.

The screenshot above shows that through API Validation Testing, the implementation of that endpoint has met all expected requirements.

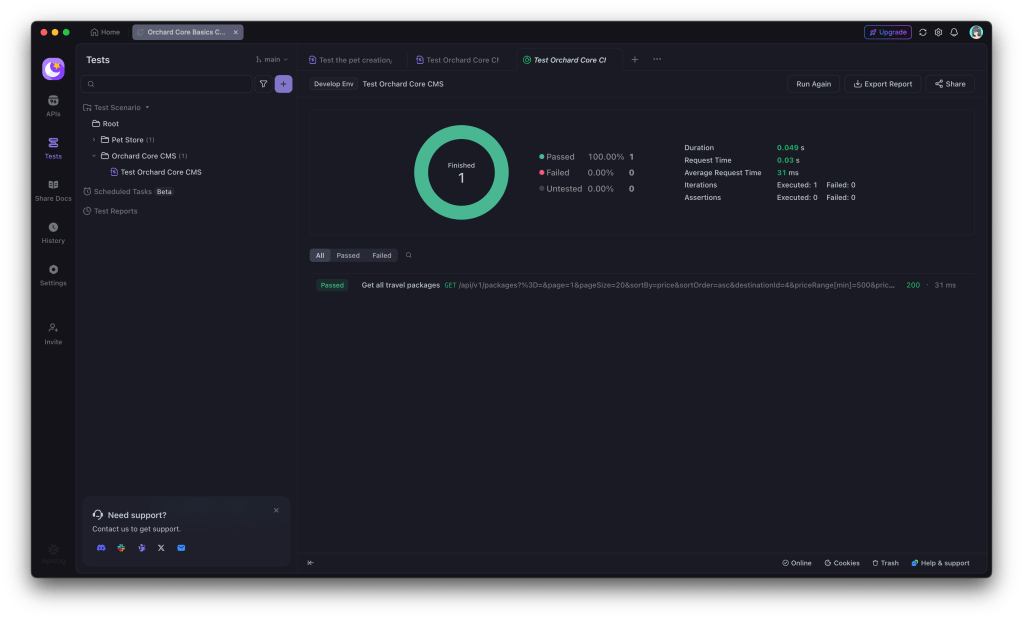
API validation tests are not just for simple checks. The feature is great for handling complex, multi-step API workflows too. With them, we can chain multiple requests together, simulate real-world scenarios, and even run the same requests with different test data. This makes it easier to catch issues early and keep our API running smoothly.

Populate testing steps based on our API spec in Apidog.

In addition, we can also set up Scheduled Tasks, which is still in Beta now, to automatically run our test scenarios at specific times. This helps us monitor API performance, catch issues early, and ensure everything works as expected automatically. Plus, we can review the execution results to stay on top of any failures.

Result of running one of the endpoints on Develop Env.

Wrap-Up

Throughout this article, we have walked through the process of designing, mocking, documenting, implementing, and testing a headless API in Orchard Core using Apidog. By following an API-first approach, we ensure that our API is well-structured, easy to maintain, and developer-friendly.

With this approach, teams can collaborate more effectively, reduce friction in development. Now that the foundation is set, the next step could be integrating this API into a frontend app, optimising our API performance, or automating even more tests.

Finally, with .NET 9 moving away from built-in Swagger UI, developers now have to find alternatives to set up API documentation. As we can see, Apidog offers a powerful alternative, because it combines API design, testing, and documentation in one tool. It simplifies collaboration while ensuring a smooth API-first design approach.

From Legacy to .NET 8: Migrating with NDepend

Quick note: I received a free license for NDepend to try it out and share my experience. All opinions in this blog post are on my own.

From O2DES.Net to Ea

In 2019, I had the honour of working closely with the team behind the O2DES.NET during my time working at the C4NGP research center in NUS, where I spent around two and a half years. After I left the team in 2022, O2DES.NET has not been actively updated on their GitHub public repository and it is still targeting at .NET Standard 2.1.

While .NET Standard 2.1 is not as old as the .NET Framework, it is considered somewhat outdated compared to the latest .NET versions. In the article “The Future of .NET Standard” written by Immo Landwerth, .NET Standard has been largely superseded by .NET 5 (and later versions), which unify these platforms into a single runtime. Hence, moving to .NET 8 is a forward-looking decision that aligns with current and future software development trends.

Immo Landwerth, program manager on the .NET Framework team at Microsoft, talked about .NET Standard 2.0 back in 2016. (Image Credit: dotnet – YouTube Channel)

Hence, in this article, I will walk you through the process of migrating O2DES.NET from targeting .NET Standard 2.1 to supporting .NET 8. To prevent any confusion, I’ve renamed the project to ‘Ea’ because I am no longer the active developer of O2DES.NET. Throughout this article, ‘Ea’ will refer to the version of the project updated to .NET 8.

In this migration journey, I will be relying on NDepend, a static code analysis tool for .NET developers.

Show Me the Code!

The complete source code of my project after migrating O2DES.NET to target at .NET 8 can be found on GitHub at https://github.com/gcl-team/Ea.

About NDepend: Why Do We Need a Static Code Analysis?

Why do we need NDepend, a static code analysis tool?

Static code analysis is a way of automatically checking our code for potential issues without actually running our apps. Think of it like a spell-checker, but for programming, scanning our codebase to find bugs, performance issues, and security vulnerabilities early in the development process.

During the migration of an older library, such as moving O2DES.NET from .NET Standard 2.1 to .NET 8, the challenges can add up. We are expected to run into outdated code patterns, performance bottlenecks, or even compatibility issues.

The O2DES.NET on GitHub has some of its NuGet references outdated too.

NDepend is designed to help with this by performing a deep static analysis of the entire codebase. It gives us detailed reports on code quality, shows where our dependencies are, and highlights areas that need attention. We can then focus on modernising the code with confidence, knowing that we are not likely introducing new bugs or performance issues as we are updating the codebase.

NDepend also helps enforce good coding practices by pointing out issues like overly complex methods, dead code, or potential security vulnerabilities. With features like code metrics, dependency maps, and rule enforcement, it acts as a guide to help us write better, more maintainable code.

Bringing Down Debt from 6.22% to 0.35%

One of the standout features of NDepend is its comprehensive dashboard, which I heavily rely on to get an overview of the entire O2DES.NET codebase.

Right after targeting the O2DES.NET library to .NET 8, a lot of issues surfaced.

From code quality metrics to technical debt, the dashboard presents critical insights in a visual and easy-to-understand format. Having all this information in one place is indeed invaluable to us during the migration project.

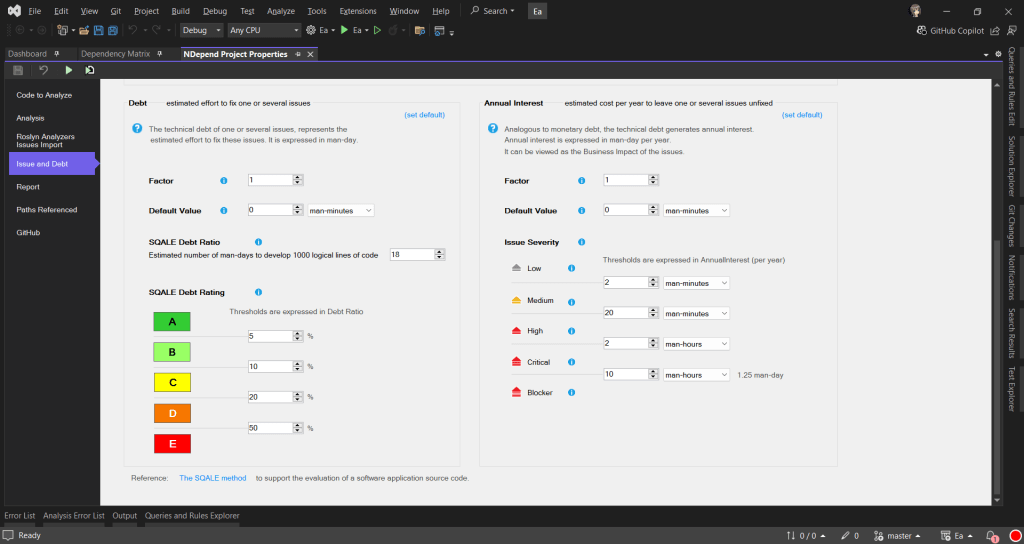
To help us better understand how much effort is needed to fix or improve the codebase, NDepend uses the Debt Ratio and Debt Rating, both of which are part of the SQALE method.

We can configure the SQALE Debt Ratio and Debt Rating.

In the book, the SQALE method for Managing Technical Debt written by Jean-Louis Letouzey, SQALE stands for Software Quality Assessment based on Life Expectations. SQALE is a method used to assess and manage technical debt in software projects. In the context of NDepend, the SQALE method is used to calculate the Debt Ratio and Debt Rating:

Debt Ratio: The percentage of effort needed to fix the technical debt compared to rewriting the code from scratch.

Debt Rating: A letter-based rating (A to E) derived from the Debt Ratio to give a quick overview of the severity of technical debt.

As shown in one of the earlier screenshots, Ea has a Debt Ratio of 6.22% and a B rating. This means that its technical debt is considered moderate and manageable. Nevertheless, it is a signal that it is now time we should start addressing the identified issues before they accumulate.

After just two weeks of code cleanup, we successfully reduced Ea’s Debt Ratio from 6.22% to an impressive 0.35%, elevating its rating to an A. This significant improvement not only enhances the overall quality of the codebase but also positions Ea for better maintainability.

The most recent analysis shows that the Debt Ratio of Ea is down to just 0.35%.

Issues and Trends

In Visual Studio, NDepend also provides interactive UI which indicates the number of critical rules violated and critical issues to solve. Unlike most of the static code analysis tools that show overwhelming number of issues, NDepend has this concept of baseline.

When we first set up an NDepend project, the very first analysis of our code becomes the “baseline.” This baseline serves as a starting point, capturing the current state of our code. As we continue to work on the project, future analyses will be compared against this baseline. The idea is to track how our code changes over time so that we can focus on knowing whether we are improving or introducing more issues to the codebase while we are changing it.

At some point during the code change, we fixed 31 “High” issues (shown in green) while introducing 42 new “High” issues (shown in red).

As shown in the screenshot above, those new issues added since the baseline need to be our priority to fix. This is to make sure the newly written code and refactored code will remain clean.

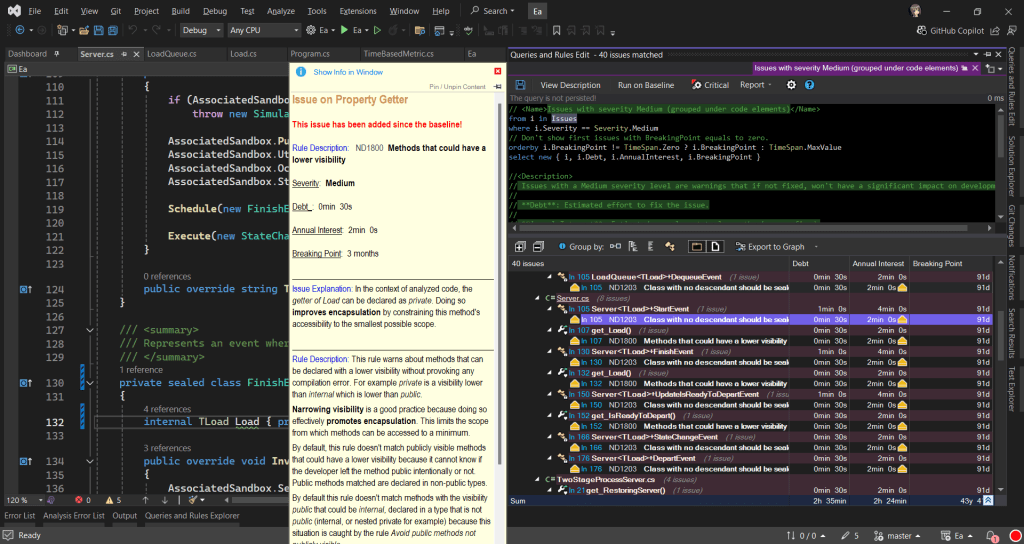
In fact, when fixing the issues, I get to learn from the NDepend rules. When we click on the numbers, we will be shown the corresponding issues. Then clicking on each of the issue will show us the detailed information about it. For example, as shown in the screenshot below, when we click on one of the green numbers, it shows us a list of issues that have been fixed by us.

As indicated, the issue is one which has been fixed since the baseline.

When we click on the red numbers, as shown in the following screenshot, we will get to see the new issues that we need to fix. The following example shows how the original O2DES.NET has some methods declared with high visibility unnecessarily.

This is an issue that has been newly added since the baseline.

By default, the dashboard also comes with some helpful trend charts. These charts give us a visual overview of how our codebase is evolving over time.

We have made significant progress in Ea library development over the past half month.

These charts give us a visual overview of how our codebase is evolving over time. For those new to static code analysis, think of these charts as the “health check” of the project. During the migration, they help us to track important metrics, like code coverage, issues, or technical debt, and show how they change with each analysis.

Code Dependency Graphs

NDepend offers a Dependency Graph. It is used to visually represent the relationships between different components such as namespaces and classes within our codebase. The graph helps us understand how tightly coupled our code is and how different parts of our codebase depend on each other.

When we are refactoring Ea during the migration, we depend on the Dependency Graph to visually shows us how the different parts of the codebase are connected. We use the insight provided by Dependency Graph to plan how to split components, which will then make the code easier to manage.

A dependency diagram made of all classes in the Ea project.

As shown in the diagram above, we can see a graph made of some entangled classes which are connected with a red bi-directional arrow. This is because in the original O2DES.NET library, there are some classes having circular dependency. This thus makes parts of the code heavily reliant on each other, reducing modularity and making it harder to unit test the code independently.

To further investigate the classes, we can double click the edge between those two classes. Doing so will generate a graph made of methods and fields involved in the dependency between the two classes, as shown in the screenshot below.

The coupling graph between two classes.

This coupling graph is a powerful tool for us as it offers detailed insights into how the two classes interact. This level of detail allows us to focus on the exact code causing the coupling, making it easier to assess whether the dependency is necessary or can be refactored. For instance, if multiple methods are too intertwined, it might be time to extract common logic into a new class or interface.

In addition, the Dependency Matrix is another way to visualise the dependencies between namespaces, classes, or methods. A number in a cell at the intersection of two elements indicates how many times the element in the row depends on the element in the column. This gives us an overview of the dependencies within our codebase.

The Dependency Matrix.

From the Dependency Matrix above, we first should look for cells with large numbers. This is because having large numbers indicating the two methods are highly dependent on each other. We should review those methods to understand why there is so much interaction and to make sure they are not tightly coupled.

If there is a cycle in the codebase, there will be a red square shown on the Dependency Matrix. We then can refactor by breaking the cycle, possibly by introducing new interfaces or decoupling responsibilities between the methods.

Code Metrics View

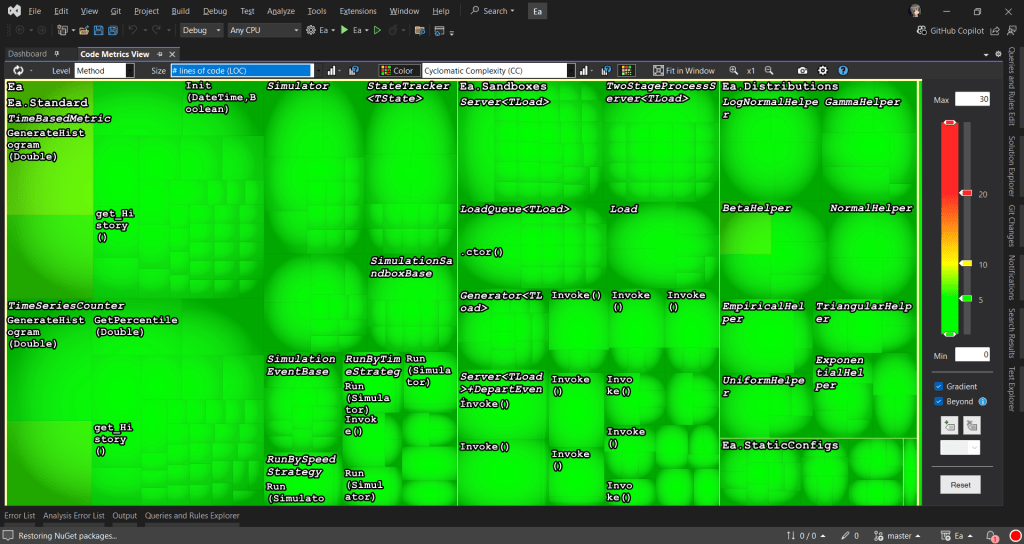
In the Code Metric View, each rectangle represents a method. The area of a rectangle is proportional to metrics such as the # lines of codes (LOC), cyclomatic complexity (CC), of the corresponding method, field, type, namespace, or assembly.

This treemap shows the # lines of code (LOC) of the methods in our project.

During the migration, the tree view format enables us to navigate our codebase and prioritise areas that require refactoring by spotting those methods that are too big and too complex. In addition, to help quickly identify problem areas, NDepend uses colour coding in the tree view. For example, red may indicate high complexity or large size, while green might indicate simpler, more maintainable code.

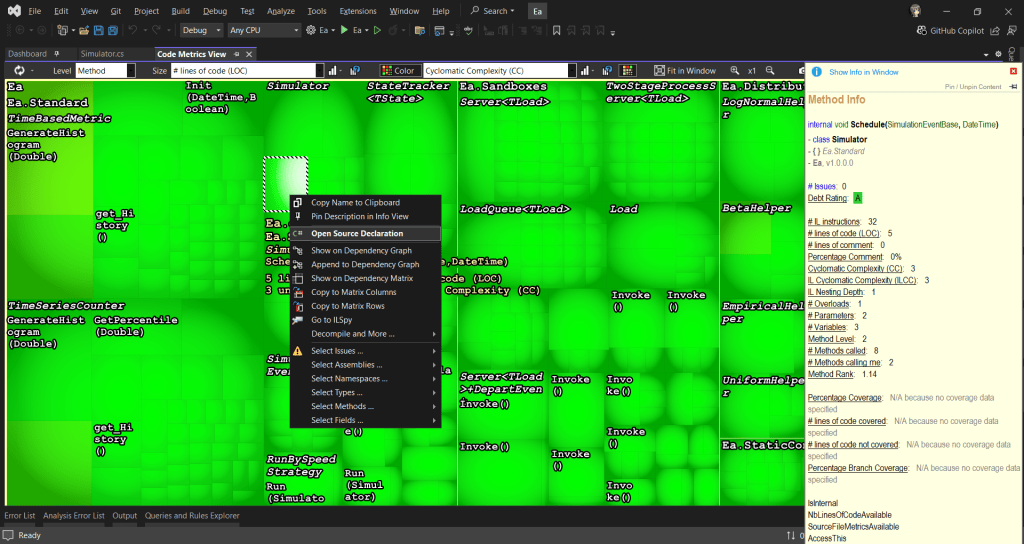
The tree view is interactive. Right-clicking on the rectangles provides options such as opening the source code declaration for the selected element, allowing us to navigate directly to the method.

Right-clicking on the rectangles will show the available actions to perform.

Integrating with GitHub Actions

NDepend integrate well with several CI/CD pipelines, making it a valuable tool for maintaining code quality throughout the development lifecycle. It can automatically analyse our code after each build. This ensures that every change in our codebase adheres to defined quality standards before the merge to main branch.

NDepend comes with Quality Gates that enforce standards such as unfixed critical issues. If the code fails to meet the required thresholds, the build can fail in the pipelines.

In NDepend, Quality Gates are predefined sets of code quality criteria that our project must meet before it is considered acceptable for deployment. They serve as automated checkpoints to help ensure that our code maintains a certain standard of quality, reducing technical debt and promoting maintainability.

One of our build failed because there was code violating a critical rule in our codebase.

As shown in the screenshot above, NDepend provides detailed reports on issues and violations after each build. We can also download the detailed report from the CI servers, such as GitHub Actions. These reports help us quickly identify where issues exist in our code.

NDepend report of the build can be found in the Artifacts of the pipeline.

The NDepend report is divided into seven sections, each providing detailed insights into various aspects of your codebase:

  • Overview: It gives a high-level view of the overall code quality and metrics, similar to what is displayed in the NDepend Dashboard within Visual Studio.
  • Issues: A list of source files with unresolved issues. Along with the number of issues, it also shows the “Debt” for each file, which represents the estimated man-time required to resolve the issues.
  • Projects: Similar to the Issues section but focuses on projects instead of individual files. It displays the total issues and associated debt at the project level.
  • Rules: This section highlights the violated rules, showing the issues and debt in terms of the rules that have been broken. It’s another way to assess code quality by focusing on adherence to coding standards.
  • Quality Gates: This section mirrors the Quality Gates you might have seen earlier in the CI/CD pipelines, such as in GitHub Actions.
  • Trend: The Trend section provides a visualisation of trends over time, similar to the trend charts found in the NDepend Dashboard in Visual Studio.
  • Logs: This section contains the logs generated during NDepend analysis.
Number of un-resolved issues and debt of the files in our project.

As described in the NDpend documentation, it has complete support for Azure DevOps, meaning it can be seamlessly integrated into the CI/CD pipelines without a lot of manual setup. We thus can easily configure NDepend to run as part of our Azure Pipelines, generating code quality reports after each build.

For our Ea project, since it is an open-source project hosted on GitHub, we can also integrate NDepend with our GitHub Actions instead.

To integrate with GitHub Actions, firstly, we need to get associate our NDepend license with our GitHub account (or a copy of 28-day trial activation data). To link the NDepend license (eg. ABC012345) with our GitHub account, we will need to visit the link: “https://www.ndepend.com/activation_githubaction?license=ABC012345&#8221;, as demonstrated in the screenshot below.

Linking our NDepend license with our GitHub account.

To introduce NDepend to our GitHub Actions workflow, the very least configuration that we need to add is as follows.

- name: NDepend
uses: ndepend/ndepend-action@ndependv1.0
with:
license: ${{ secrets.NDependLicense }}
GITHUB_TOKEN: ${{ secrets.GITHUB_TOKEN }}

Read More: Complete Build YAML of Ea

Wrap-Up

In conclusion, NDepend has proven to be an invaluable tool in our journey to modernise and maintain the Ea library.

By offering comprehensive static code analysis, insightful metrics, and seamless integration with CI/CD pipelines like GitHub Actions, it empowers us to catch issues early, reduce technical debt, and ensure a high standard of code quality.

NDepend provides the guidance and clarity needed to ensure our code remains clean, efficient, and maintainable. For any .NET individual or development team serious about improving code quality, NDepend is definitely a must-have in the toolkit.

Kaizen: My Journey to be Azure Developer Associate

I’m grateful to share that I’ve successfully renewed my Microsoft Certified: Azure Developer Associate certification few months before its expiration. This journey has taught me valuable lessons, and I’m eager to share my experiences with you.

Exam Overview

Those who take the exam are responsible for participating in all phases of development, including requirements gathering, design, development, deployment, security, maintenance, performance tuning, and monitoring.

The exam consists of 10 sections to measure different Azure skills, and I have passed 8 of them, which are:

  • Explore Azure Functions;
  • Develop Azure Functions;
  • Implement Azure Key Vault (full score!);
  • Implement Azure App Configuration;
  • Monitor App Performance;
  • Manage Container Images in Azure Container Registry (full score!);
  • Work with Azure Cosmos DB;
  • Consume an Azure Cosmos DB for NoSQL change feed using the SDK.

I didn’t pass the section “Implement Azure Container Apps” and scored 0 in “Run Container Images in Azure Container Instances” section. These areas remind me that there is always room for improvement and growth.

The certificate is signed by Microsoft CEO!

The Kaizen Journey

Since 2019, I have not been actively using Azure at my work. I now work with AWS at work, but I still learn Azure on my own. Even though I’m not using Azure at work, I keep learning and growing my cloud computing skills. I share my AWS knowledge with the community, but my heart is still with Azure too. I want to be good at both AWS and Azure!

As a developer working primarily with AWS, taking the Azure certification may seem unconventional, but it’s a wise move. Not only Azure certification allows me to demonstrate my commitment to continuous learning and adaptability, but also having expertise in multiple cloud platforms makes a developer a more attractive candidate in the current job market.

I hope my journey inspires you to pursue your own path of learning and growth. As Riza Marhaban, my senior who is also Senior Associate Director (IT) at NUS told me, certifications are not just about achieving a credential, but about the journey of self-improvement and the positive impact it can have on those around us.

Riza shared with me the Kaizen philosophy. The Kaisan philosophy teaches us to embrace challenges, learn from failures, and strive for excellence. Hence, I apply this philosophy to my own journeys, embracing each step as an opportunity to learn and grow.

Wrap-Up

Renewing my certification has reminded me of the importance of continuous learning. I hope my story inspires you to stay humble, stay hungry, and always strive for excellence.

Together, we learn better!

Kubernetes CronJob to Send Email via Azure Communication Services

In March 2021, Azure Communication Services was made generally available after being showcased in Microsoft Ignite. In the beginning, it only provides services such as SMS as well as voice and video calling. One year after that, in May 2022, it also offers a way to facilitate high volume transactional emails. However, currently this email function is still in public preview. Hence, the email relevant APIs and SDKs are provided without a SLA, which is thus not recommended for production workloads.

Currently, our Azure account has a set of limitation on the number of email messages that we can send. For all the developers, email sending is limited to 10 emails per minute, 25 emails in an hour, and 100 emails in day.

Setup Azure Communication Services

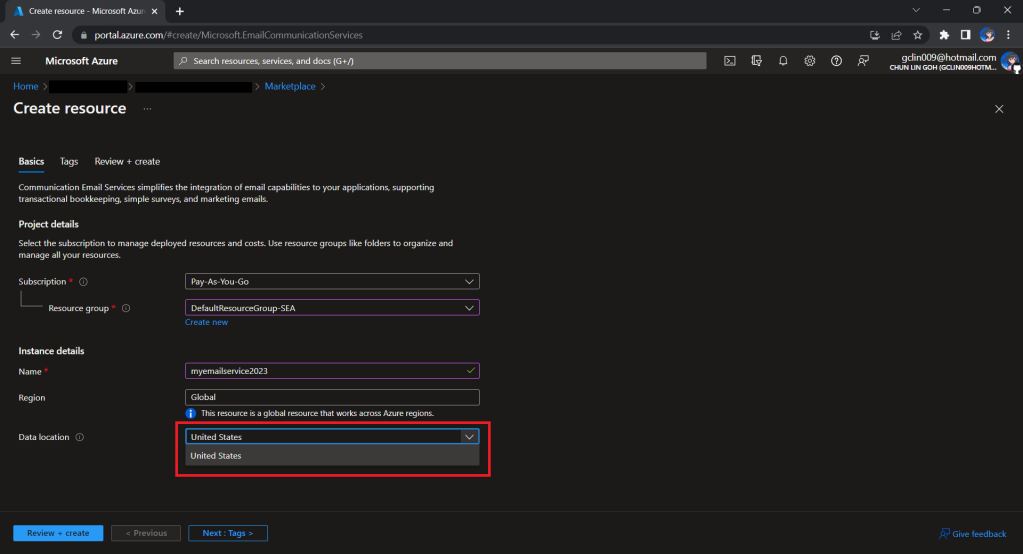
To begin, we need to createa a new Email Communication Services resource from the marketplace, as shown in the screenshot below.

US is the only option for the Data Location now in Email Communication Services.

Take note that currently we can only choose United States as the Data Location, which determines where the data will be stored at rest. This cannot be changed after the resource has been created. This thus make our Azure Communication Services which we need to configure next to store the data in United States as well. We will talk about this later.

Once the Email Communication Service is created, we can begin by adding a free Azure subdomain. With the “1-click add” function, as shown in the following screenshot, Azure will automatically configures the required email authentication protocols based on the email authentication best practices.

Click “1-click add” to provision a free Azure managed domain for sending emails.

We will then have a MailFrom address in the format of donotreply@xxxx.azurecomm.net which we can use to send email. We are allowed to modify the MailFrom address and From display name to more user-friendly values.

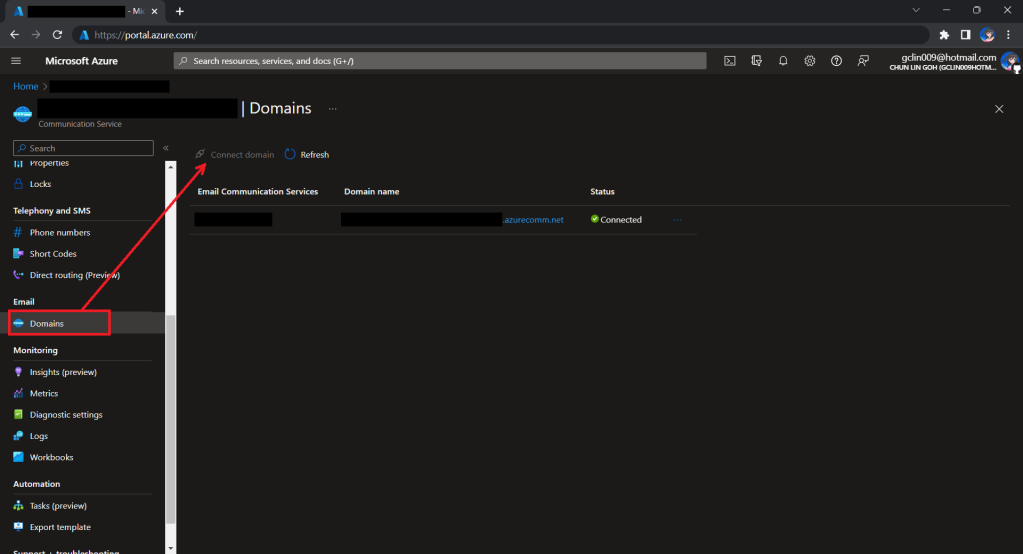
After getting the domain, we need to connect Azure Communication Services to it to send emails.

As we talked earlier, we need to make sure that the Azure Communication Services to have United States as its Data Location as well. Otherwise, we will not be able to link the email domain for email sending.

Successfully connected our email domain. =)

A Simple Console App for Sending Email

Now, we need to create the console app which we will be used in our Kubernetes CronJob later to send the emails with the Azure Communication Services Email client library.

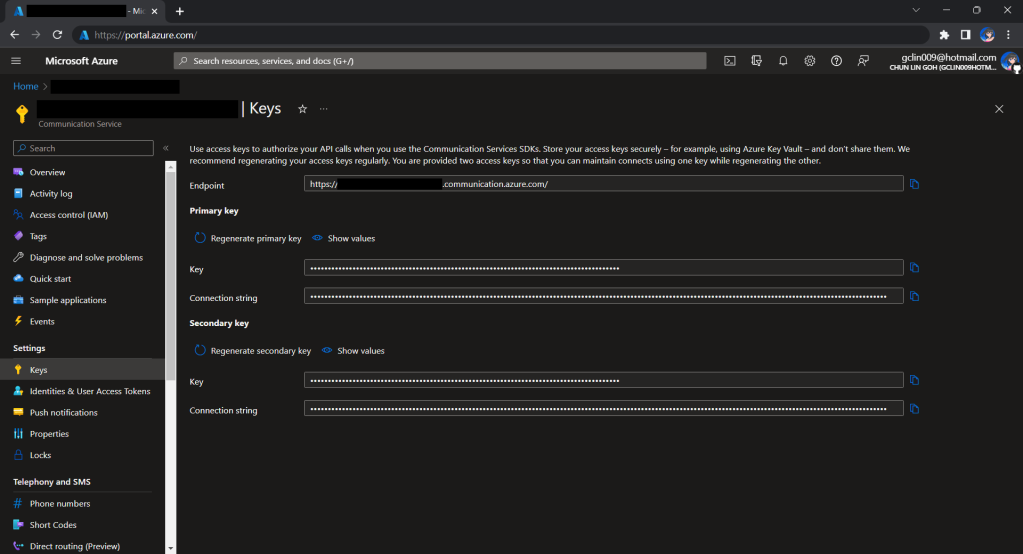
Before we begin, we have to get the connection string for the Azure Communication Service resource.

Getting connection string of the Azure Communication Service.

Here I have the following code to send a sample email to myself.

using Azure.Communication.Email.Models;
using Azure.Communication.Email;

string connectionString = Environment.GetEnvironmentVariable("COMMUNICATION_SERVICES_CONNECTION_STRING") ?? string.Empty;
string emailFrom = Environment.GetEnvironmentVariable("EMAIL_FROM") ?? string.Empty;

if (connectionString != string.Empty)
{
    EmailClient emailClient = new EmailClient(connectionString);

    EmailContent emailContent = new EmailContent("Welcome to Azure Communication Service Email APIs.");
    emailContent.PlainText = "This email message is sent from Azure Communication Service Email using .NET SDK.";
    List<EmailAddress> emailAddresses = new List<EmailAddress> {
            new EmailAddress("gclin009@hotmail.com") { DisplayName = "Goh Chun Lin" }
        };
    EmailRecipients emailRecipients = new EmailRecipients(emailAddresses);
    EmailMessage emailMessage = new EmailMessage(emailFrom, emailContent, emailRecipients);
    SendEmailResult emailResult = emailClient.Send(emailMessage, CancellationToken.None);
}
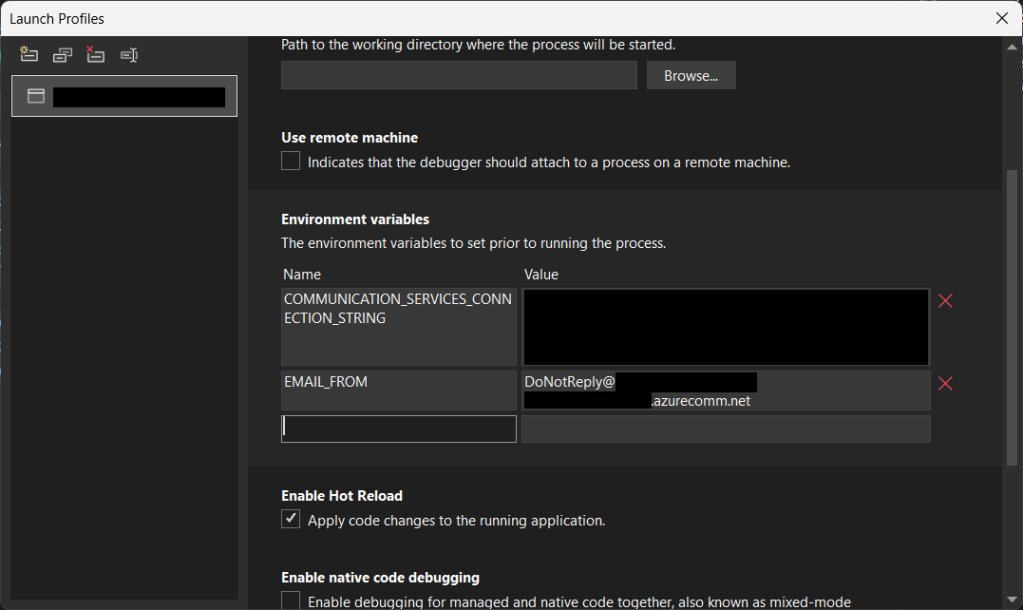
Setting environment variables for local debugging purpose.

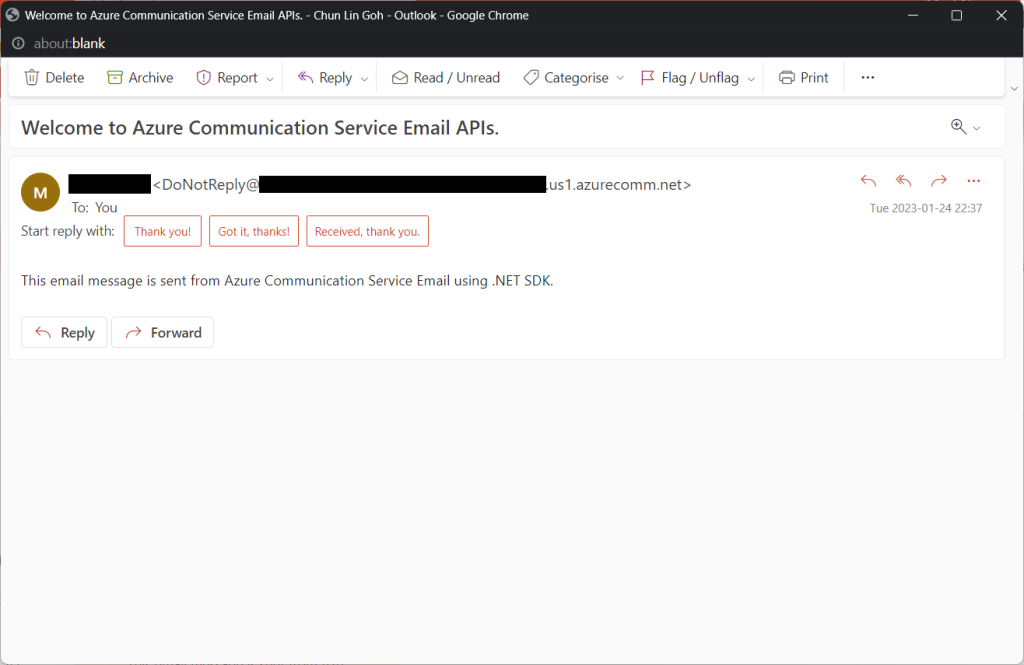
Tada, there should be an email successfully sent out as instructed.

Email is successfully sent and received. =)

Containerise the Console App

Next what we need to do is containerising our console app above.

Assume that our console app is called MyConsoleApp, then we will prepare a Dockerfile as follows.

FROM mcr.microsoft.com/dotnet/runtime:6.0 AS base
WORKDIR /app

FROM mcr.microsoft.com/dotnet/sdk:6.0 AS build
WORKDIR /src
COPY ["MyMedicalEmailSending.csproj", "."]
RUN dotnet restore "./MyConsoleApp.csproj"
COPY . .
WORKDIR "/src/."
RUN dotnet build "MyConsoleApp.csproj" -c Release -o /app/build

FROM build AS publish
RUN dotnet publish "MyConsoleApp.csproj" -c Release -o /app/publish /p:UseAppHost=false

FROM base AS final
WORKDIR /app
COPY --from=publish /app/publish .
ENTRYPOINT ["dotnet", "MyConsoleApp.dll"]

We then can publish it to Docker Hub for consumption later.

If you prefer to use Azure Container Registry, you can refer to the documentation on how to do it on Microsoft Learn.

Create the CronJob

In Kubernetes, pods are the smallest deployable units of computing we can create and manage. A pod can have one or more relevant containers, with shared storage and network resources. Here, we will be scheduling a job so that it creates pods containing our container with the image we created above to operate the execution of the pods, which is in our case, to send emails.

The schedule of the cronjob is defined as follows, according to the Kubernetes documentation on the schedule syntax.

# ┌───────────── minute (0 - 59)
# │ ┌───────────── hour (0 - 23)
# │ │ ┌───────────── day of the month (1 - 31)
# │ │ │ ┌───────────── month (1 - 12)
# │ │ │ │ ┌───────────── day of the week (sun, mon, tue, wed, thu, fri, sat)
# │ │ │ │ │
# * * * * *

Hence, if we would like to have the email scheduler to be triggered at 8am of every Friday, we can create a CronJob in the namespace my-namespace with the following YAML file.

apiVersion: batch/v1
kind: CronJob
metadata:
  name: email-scheduler
  namespace: ns-mymedical
spec:
  jobTemplate:
    metadata:
      name: email-scheduler
    spec:
      template:
        spec:
          containers:
          - image: chunlindocker/emailsender:v2023-01-25-1600
            name: email-scheduler
          restartPolicy: OnFailure
  schedule: 0 8 * * fri

After the CronJob is created, we can proceed to annotate it with the command below.

kubectl annotate cj email-scheduler jobtype=scheduler frequency=weekly

This helps us to query the cron jobs with jsonpath easily in the future. For example, we can list all cronjobs which are scheduled weekly, we can do it with the following command.

kubectl get cj -A -o=jsonpath="{range .items[?(@.metadata.annotations.jobtype)]}{.metadata.namespace},{.metadata.name},{.metadata.annotations.jobtype},{.metadata.annotations.frequency}{'\n'}{end}"

Create ConfigMap

In our email sending programme, we have two environment variables. Hence, we can create ConfigMap to store the data as key-value pair.

apiVersion: v1
kind: ConfigMap
metadata:
  name: email-sending
  namespace: my-namespace
data:
  EMAIL_FROM: DoNotReply@xxxxxx.azurecomm.net

For connection string of Azure Communication Service, since it is a sensitive data, we will store it in Secret. Secrets are similar to ConfigMaps but are specifically intended to hold confidential data. We will create a Secret with the command below.

kubectl create secret generic azure-communication-service --from-literal=CONNECTION_STRING=xxxxxx --dry-run=client --namespace=my-namespace -o yaml

It should generate a YAML which is similar to the following.

apiVersion: v1
kind: Secret
metadata:
  name: azure-communication-service
  namespace: my-namespace
data:
  CONNECTION_STRING: yyyyyyyyyy

Then, the Pods created by the CronJob can thus consume the ConfigMap and Secret above as environment variables. So, we need to update the CronJob YAML file to be as follows.

apiVersion: batch/v1
kind: CronJob
metadata:
  name: email-scheduler
  namespace: my-namespace
spec:
  jobTemplate:
    metadata:
      name: email-scheduler
    spec:
      template:
        spec:
          containers:
          - image: chunlindocker/emailsender:v2023-01-25-1600
            name: email-scheduler
            env:
              - name: EMAIL_FROM
                valueFrom:
                  configMapKeyRef:
                    name: email-sending
                    key: EMAIL_FROM
              - name: COMMUNICATION_SERVICES_CONNECTION_STRING
                valueFrom:
                  secretKeyRef:
                    name: azure-communication-service
                    key: CONNECTION_STRING
          restartPolicy: OnFailure
  schedule: 0 8 * * fri

Using SealedSecret

Problem with using Secrets is that we can’t really commit them to our code repository because the data are only encoded but not encrypted. Hence, in order to store our Secrets safely, we need to use SealedSecret which helps us to encrypt our Secret. The SealedSecret can only be decrypted by the controller running in the targer cluster.

Currently, the SealedSecret Helm Chart is officially supported and hosted on GitHub.

Helm is the package manager for Kubernetes. Helm uses a packaging format called Chart, a collection of files describing a related set of Kubernetes resource. Each Chart comprises one or more Kubernetes manifests. With Chart, developers are able to configure, package, version, and share the apps with their dependencies and sensible defaults.

To install Helm on Windows 11 machine, we can execute the following commands in Ubuntu on Windows console.

  1. Download desired version of Helm release, for example, to download version 3.11.0:
    wget https://get.helm.sh/helm-v3.11.0-linux-amd64.tar.gz
  2. Unpack it:
    tar -zxvf helm-v3.2.0-linux-amd64.tar.gz
  3. Move the Helm binary to desired location:
    sudo mv linux-amd64/helm /usr/local/bin/helm

Once we have successfully downloaded Helm and have it ready, we can add a Chart repository. In our case, we need to add the repo of SealedSecret Helm Chart.

helm repo add sealed-secrets https://bitnami-labs.github.io/sealed-secrets

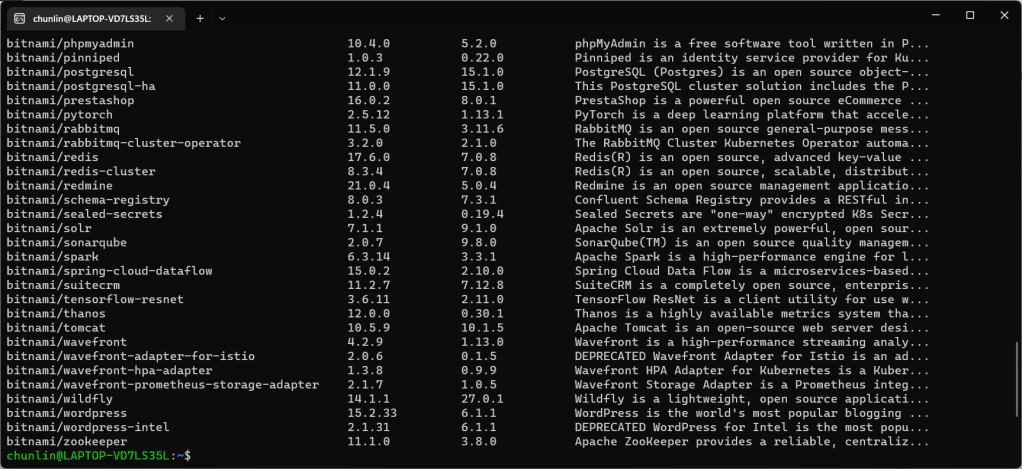
We should be able to locate the SealedSecret chart that we can install with the following command.

helm search repo bitnami
The Chart bitnami/sealed-secret is one of the Charts we can install.

To installed SealedSecret Helm Chart, we will use the following command.

helm install sealed-secrets -n kube-system --set-string fullnameOverride=sealed-secrets-controller sealed-secrets/sealed-secrets

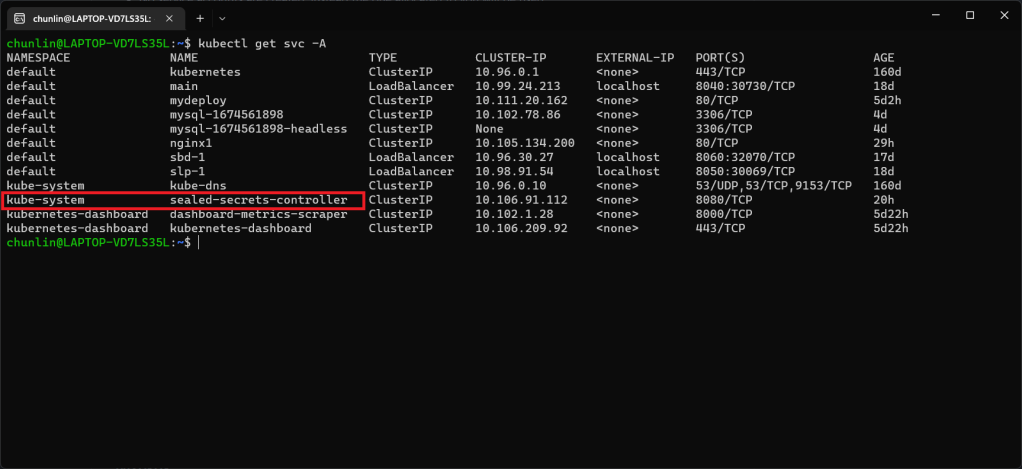
Once we have done this, we should be able to locate a new service called sealed-secret-controller under Kubernetes services.

The sealed-secret-controller service is under kube-system namespace.

Before we can proceed to use kubeseal to create an encrypted secret, for me at least, there is a need to edit the sealed-secret-controller service. Otherwise, there will be an error message saying “cannot fetch certificate: no endpoints available for service”. If you also encounter the same issue, simply follow the steps mentioned by ghostsquad to edit the service YAML accordingly.

My final edit of the sealed-secret-controller service YAML.

Next, we then can proceed to encrypt our secret, as instructed on the SealedSecret GitHub readme.

kubectl create secret generic azure-communication-service --from-literal=CONNECTION_STRING=xxxxxx --dry-run=client --namespace=my-namespace -o json > mysecret-acs.json

kubeseal < mysecret-acs.json > mysealedsecret-acs.json

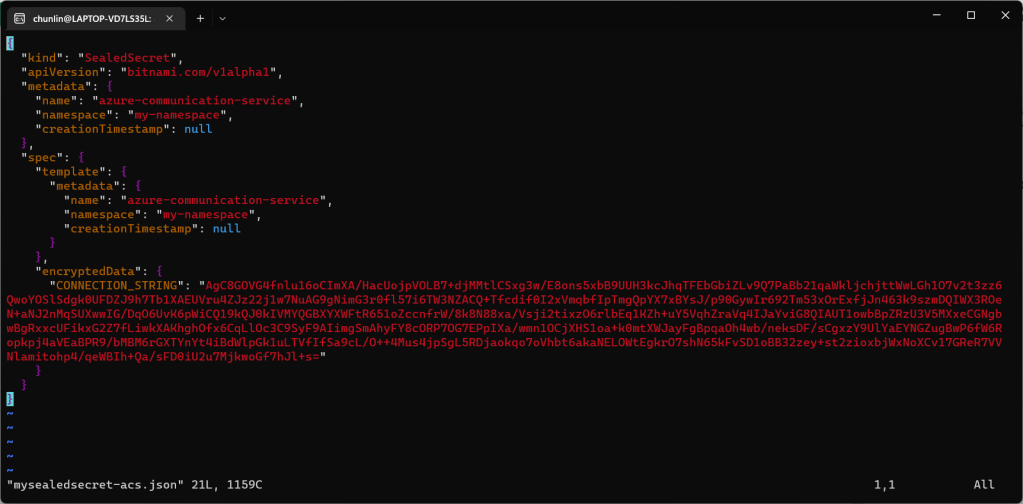
The generated file mysealedsecret-acs.json should look something as shown below.

The connection string is now encrypted.

To create the Secret resource, we will simply create it based on the file mysealedsecret-acs.json.

This generated file mysealedsecret-acs.json is thus safe to be committed to our code repository.

Going Zero-Trust: Using Kamus and InitContainer

Besides SealedSecret, there is also another open-source solution known as Kamus, a zero-trust secrets encryption and decryption solution for Kubernetes apps. We can also use Kamus to encrypt our secrets and make sure that the secrets can only be decrypted by the desired Kubernetes apps.

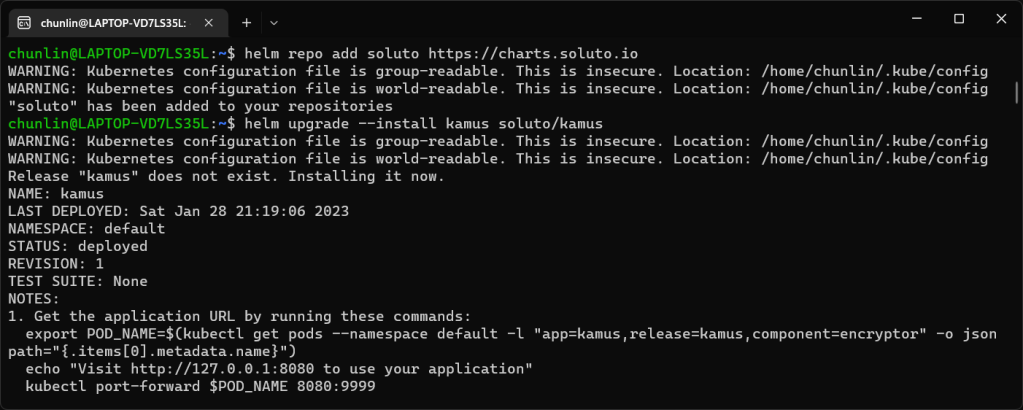
Similarly, we can also install Kamus using Helm Chart with the commands below.

helm repo add soluto https://charts.soluto.io
helm upgrade --install kamus soluto/kamus

Kamus will encrypt secrets for only a specific application represented by a ServiceAccount. A service account provides an identity for processes that run in a Pod, and maps to a ServiceAccount object. Hence, we need to create a Service Account with the YAML below.

apiVersion: v1
kind: ServiceAccount
metadata:
  name: my-kamus-sa

After creating the ServiceAccount, we can update our CronJob YAML to mount it on the pods.

Next, we can proceed to download and install Kamus CLI which we can use to encrypt our secret with the following command.

kamus-cli encrypt \
  --secret xxxxxxxx \
  --service-account my-kamus-sa \
  --namespace my-namespace \
  --kamus-url <Kamus URL>

The Kamus URL could be found after we installed Kamus as shown in the screenshot below.

Kamus URL in localhost

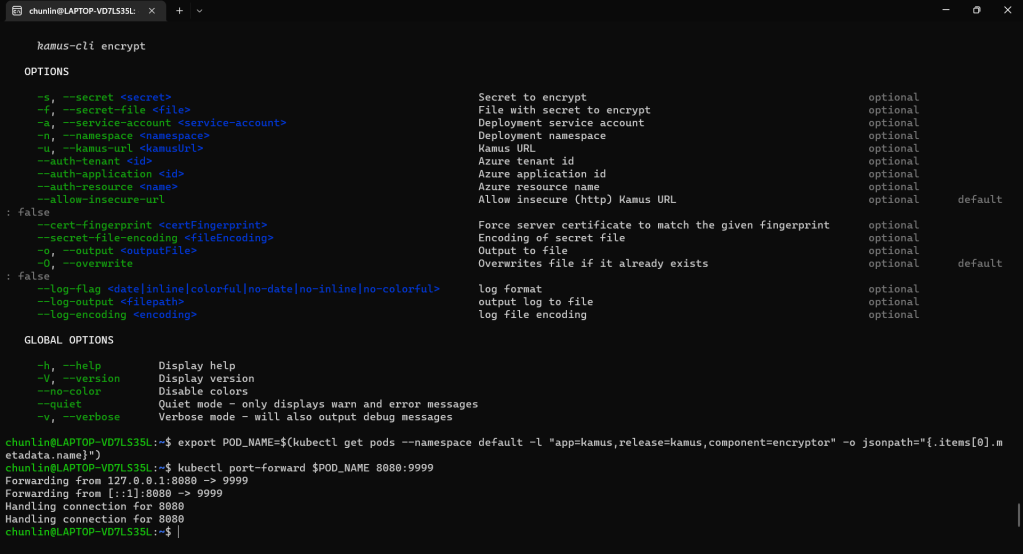
We need to follow the instruction printed on the screen to get the Kamus URL. To do so, we need to forward local port to the pod, as shown in the following screenshot.

Successfully forward the port and thus can use the URL as the Kamus URL.

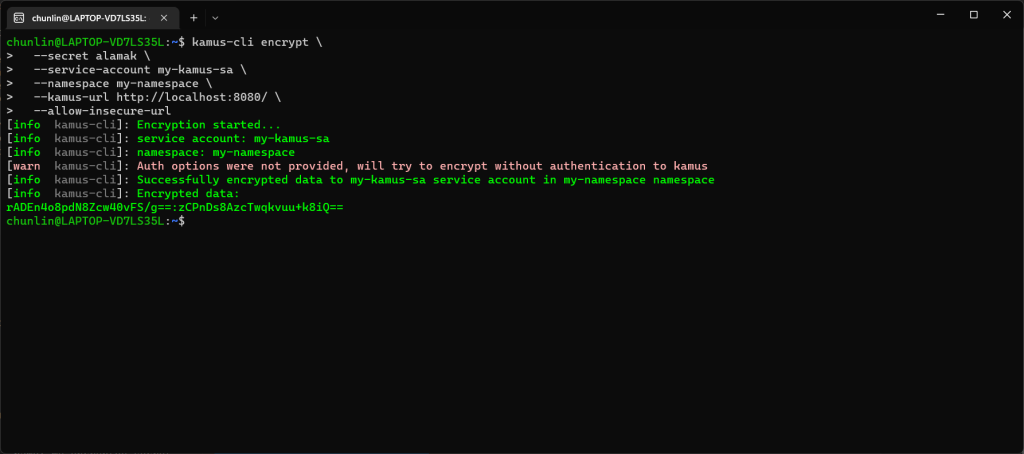
Hence, let’s say we want to encrypt a secret “alamak”, we can do so as follows.

Since our localhost Kamus URL is using HTTP, so we have to specify “–allow-insecure-url”.

After we have encrypted our secret successfully, we need to configure our pod accordingly so that it can decrypt the value with Kamus Decrypt API. The simplest way will be storing our secret in a ConfigMap because it is already encrypted, so it’s safe to store it in ConfigMap.

apiVersion: v1
kind: ConfigMap
metadata:
  name: my-encrypted-secret
  namespace: my-namespace
data:
  data: rADEn4o8pdN8Zcw40vFS/g==:zCPnDs8AzcTwqkvuu+k8iQ==

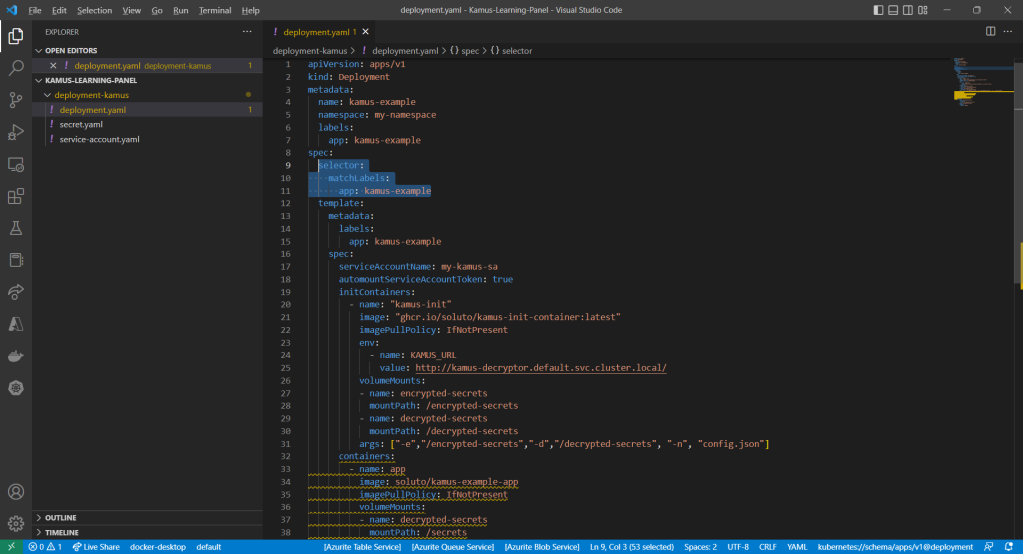
Then we can include an InitContainer in our pod. This is because the use of an initContainer allows one or more containers to run only if one or more previous containers run and exit successfully. So we can make use of Kamus Init Container to decrypt the secret using Kamus Decryptor API and output it to a file to be consumed by our app. There is an official demo from the Kamus Team on how to do that on the GitHub. Please take note that one of their YAML files is outdated and thus there is a need to update their deployment.yaml to use “apiVersion: apps/v1” with a proper selector.

Updated deployment.yaml.

After the deployment is successful, we can forward the port 8081 to the pod in the deployment as shown below.

kubectl port-forward deployment/kamus-example 8081:80

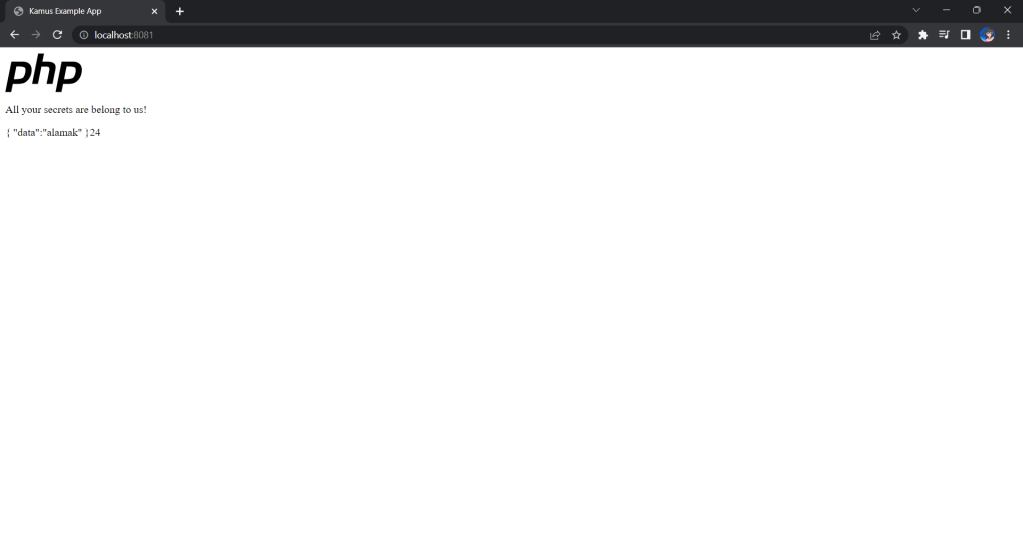
If the deployment is successful, we should be able to see the following when we visit localhost:8081 on our Internet browser, as shown in the following screenshot.

Yay, the original text “alamak” is successfully decrypted and displayed.

Deploy Our CronJob

Now, since we have everything setup, we can create our Kubernetes CronJob with the YAML file we have earlier. For local testing, I have edited the schedule to be “*/2 * * * *”. This means that an email will be sent to me every 2 minutes.

After waiting for a couple of minutes, I have received a few emails sent via the Azure Communication Services, as shown below.

Now the emails are received every 2 minutes. =)

Hoorey, this is how we build a simple Kubernetes CronJob and how we can send emails with the Azure Email Communication Services.