Few days ago, some of our teammates discovered that the SQL files they tried to pull from our GitHub repo had encoding issue. When they did git pull, there would be an error saying “fatal: failed to encode ‘…/xxxxx.sql’ from UTF-16-LE-BOM to UTF-8”.
In addition, on GitHub, the SQL files we committed to the GitHub are all marked as binary files. Thus we couldn’t view the changes we made to those files in the commit.
Cause of the Issue
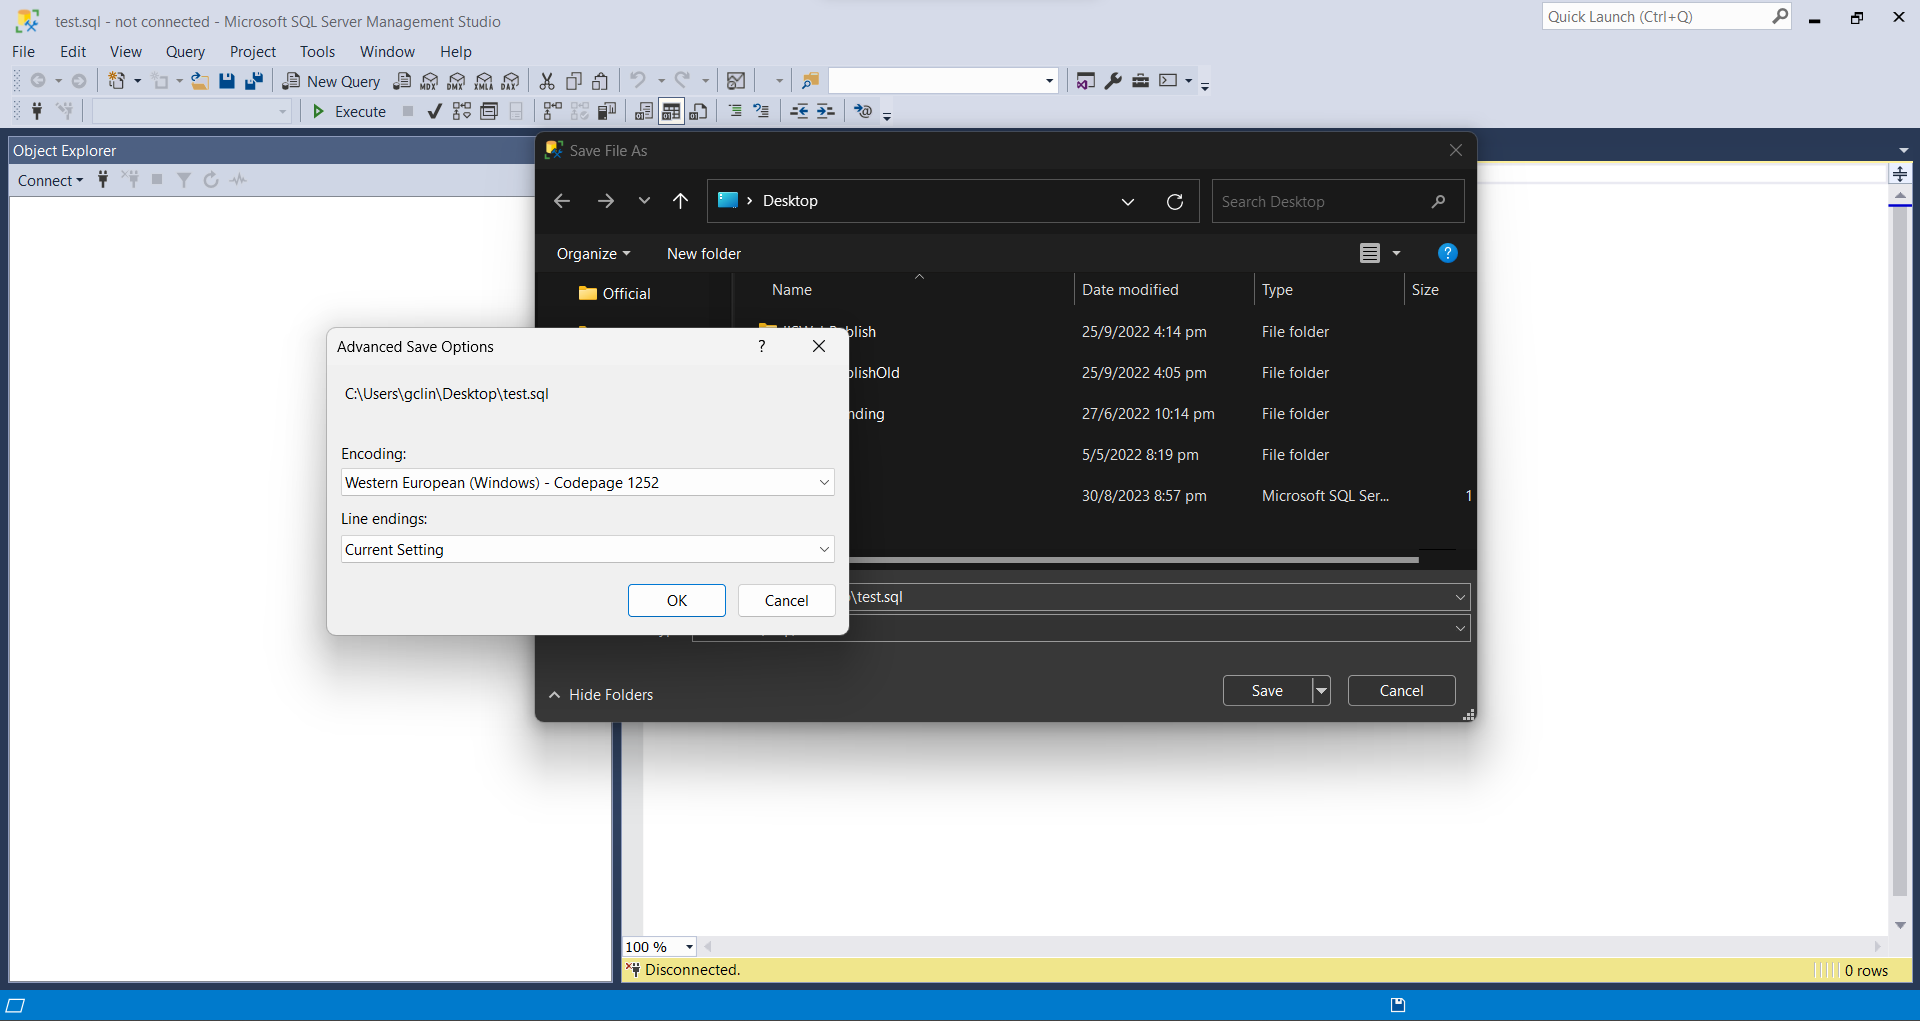
It turns out that those SQL files are generated from SQL Server Management Studio (SSMS).
Default file encoding of SSMS is Western European (Windows) – Codepage 1252.
The way to resolve this issue is to force the file to use UTF-8 encoding. We can run the following PowerShell script to change the encoding of all SQL files in a given directory and its subdirectories.
KOSD, or Kopi-O Siew Dai, is a type of Singapore coffee that I enjoy. It is basically a cup of coffee with a little bit of sugar. This series is meant to blog about technical knowledge that I gained while having a small cup of Kopi-O Siew Dai.
Last week, a developer in our team encountered an interesting question in his SQL script on SQL Server 2019. For the convenience of discussion, I’ve simplified his script as follow.
DECLARE @NUM AS TINYINT = 0
DECLARE @VAL AS VARCHAR(MAX) = '20.50'

SELECT CASE @NUM WHEN 0 THEN CAST(@VAL AS DECIMAL(10, 2))
                 WHEN 1 THEN CAST(@VAL AS DECIMAL(10, 4))
                 ELSE -1
       END AS Result
The result he expected was 20.50 because @NUM equals to 0, so by right the first result expression should be executed. However, the truth is that it returned 20.5000 as if the second result expression which is casting @VAL into a decimal value with a scale of 4 was run.
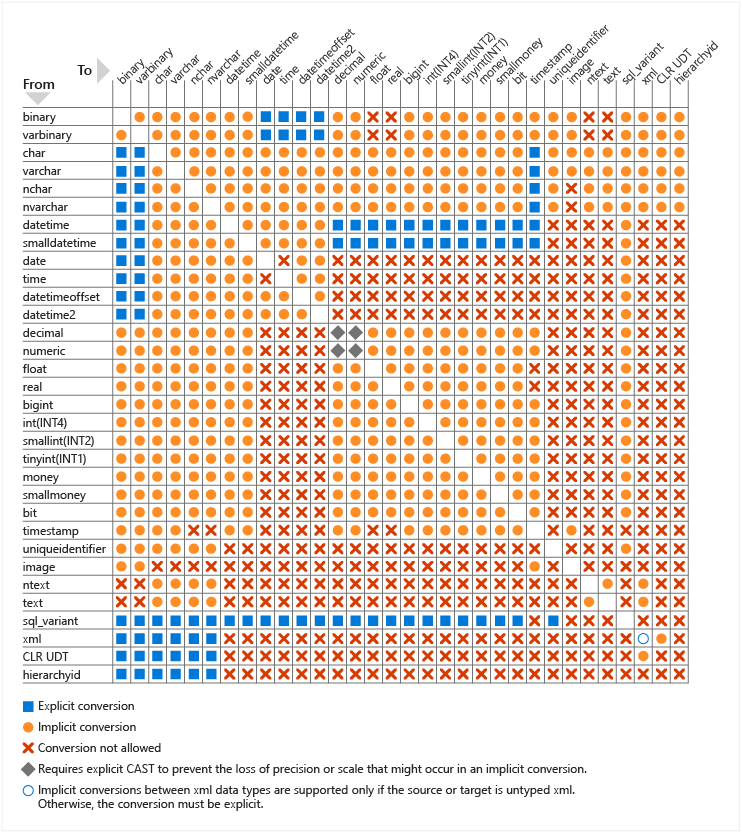
All data type conversions allowed for SQL Server system-supplied data types (Image Source: Microsoft Learn)
Data Precendence
While the above chart illustrates all the possible explicit and implicit conversions, we still do not know the resulting data type of the conversion. For our case above, the resulting data type depends on the rules of data type precedence.
Since DECIMAL has a higher precedence than INT, hence we are sure that the script above will result in a DECIMAL output with the highest scale, i.e. DECIMAL(10, 4). This explains why the result of his script is 20.5000.
Conclusion
Now, if we change the script above to be something as follows, we should receive an error saying “Error converting data type varchar to numeric”.
DECLARE @NUM AS TINYINT = 0
DECLARE @VAL AS VARCHAR(MAX) = '20.50'

SELECT CASE @NUM WHEN 0 THEN 'A'
                 WHEN 1 THEN CAST(@VAL AS DECIMAL(10, 4))
                 ELSE -1
       END AS Result
Yup, that’s all about our discussion about the little bug he found in his script. Hope you find it useful. =)
KOSD, or Kopi-O Siew Dai, is a type of Singapore coffee that I enjoy. It is basically a cup of coffee with a little bit of sugar. This series is meant to blog about technical knowledge that I gained while having a small cup of Kopi-O Siew Dai.
This month marks my third year in port and logistics industry.
In April, I attended a talk organised by NUS Business School on the future-ready supply chain. The talk is delivered by Dr Robert Yap, the YCH Group Executive Chairman. During the talk, Dr Yap mentioned that they innovated to survive because innovation was always at the heart of their development and growth. To him and his team, technology is not only an enabler for the growth of their business, but also a competitive advantage of the YCH Group.
In YCH Group, they have a vision of integrating the data flows in the supply chain with their unique analytics capabilities so that they can provide a total end-to-end supply chain enablement and transformation. Hence, today I’d like to share about how, with Microsoft Azure, we can build a data pipeline and modern data warehouse which helps to enable logistics companies to gear towards a future-ready supply chain.
Dr Yap shared about the The 7PL™ Strategy in YCH Group.
Two months ago, I also had the opportunity to join an online workshop to learn from Michelle Xie, Microsoft Azure Technical Trainer, about Azure Data Fundamentals. The workshop consists of four modules. In the workshop, we learnt core data concepts, relational and non-relational data offerings in Azure, modern data warehouses, and Power BI. Hence, I will share with you what I have learned in the workshop in this article as well.
About Data
Data is a collection of facts, figures, descriptions, and objects. Hence, data can be texts written on papers, or it can be in digital form and stored inside the electronic devices, or it could be facts that are in our mind. Data can be classified as follows.
Structured Data: Data stored in predefined schemas. Often structured data is managed using Structured Query Language (SQL). Data needs to be normalised so that no data duplication exists.
Unstructured Data: Data that does not naturally contains field and is stored in its natural format until it’s extracted for analysis, for example image, blob, audio, and video.
Unstructured data like image is frequently used in combination with Machine Learning or Azure Cognitive Services capabilities to extract data.
ETL Data Pipeline
To build an data analytical system, we normally will have the following steps in a data pipeline to perform ETL procedure. ETL stands for Extract, Transform and Load. ETL loads data first into the staging storage server and then into the target storage system, as shown below.
ETL procedure in a data processing pipeline.
Data Ingestion: Data is moved from one or many data sources to a destination where it can be stored and further analysed;
Data Processing: Sometimes the raw data may not in the format suitable for querying. Hence, we need to transform and clean up the data;
Data Storage: Once the raw data has been processed, all the cleaned and transformed data will be stored to different storage systems which serve different purposes;
Data Exploration: A way of analysing performance through graphs and charts with business intelligence tools. This is helpful in making informed business decisions.
A map in the Power BI report showing the location of a prime mover within a time period.
There are two ways of capturing the data in the Data Ingestion stage.
The first method is called the Batch Processing where a set of data is first collected over time and then fed into an analytics system to process them in group. For example, the daily sales data collected is scheduled to be processed every midnight. This is not just because midnight is the end of the day but also because the business normally ends at night and thus midnight is also the time when the servers are most likely to have more computing capacity.
Another method will be Streaming model where data is fed into analytics tools as it arrives and the data is processed in real time. This is suitable for use cases like collecting GPS data sent from the trucks because every piece of new data is generated in continuous manner and needs to be sent in real time.
Modern Data Warehouse
A modern data warehouse allows us to gather all our data at any scale easily, and to get insights through analytics, dashboard, and reports. The following image shows the data warehouse components on Azure.
Azure modern data warehouse architecture. (Image Source: Azure Docs)
For a big data pipeline, the data is ingested into Azure through Azure Data Factory in batches, or streamed near real-time using Apache Kafka, Event Hub, or IoT Hub. This data will then land in Azure Data Lake Storage long term persisted storage.
The Azure Data Lake Storage is an enterprise-wide hyper-scale repository for large volume of raw data. It is a suitable staging storage for our ingested data before the data is converted into a format suitable for data analysis. Thus, it can store any data in its native format, without requiring any prior transformations. Data Lake Storage can be accessed from Hadoop with the WebHDFS-compatible REST APIs.
In the logistics industry, the need to store spatial data is greater than ever.
Let’s say a container trucking company collects data about each container delivery through an IoT device installed on the vehicle. Information such as the location and the speed of the prime mover is constantly sent from the IoT device to Azure Event Hub. We then can use Azure Databricks to correlate of the trip data, and also to enrich the correlated data with neighborhood data stored in the Databricks file system.
Pricing tiers available for Azure Analysis Services.
Relational Database Deployment Options on Azure and HOSTING COST
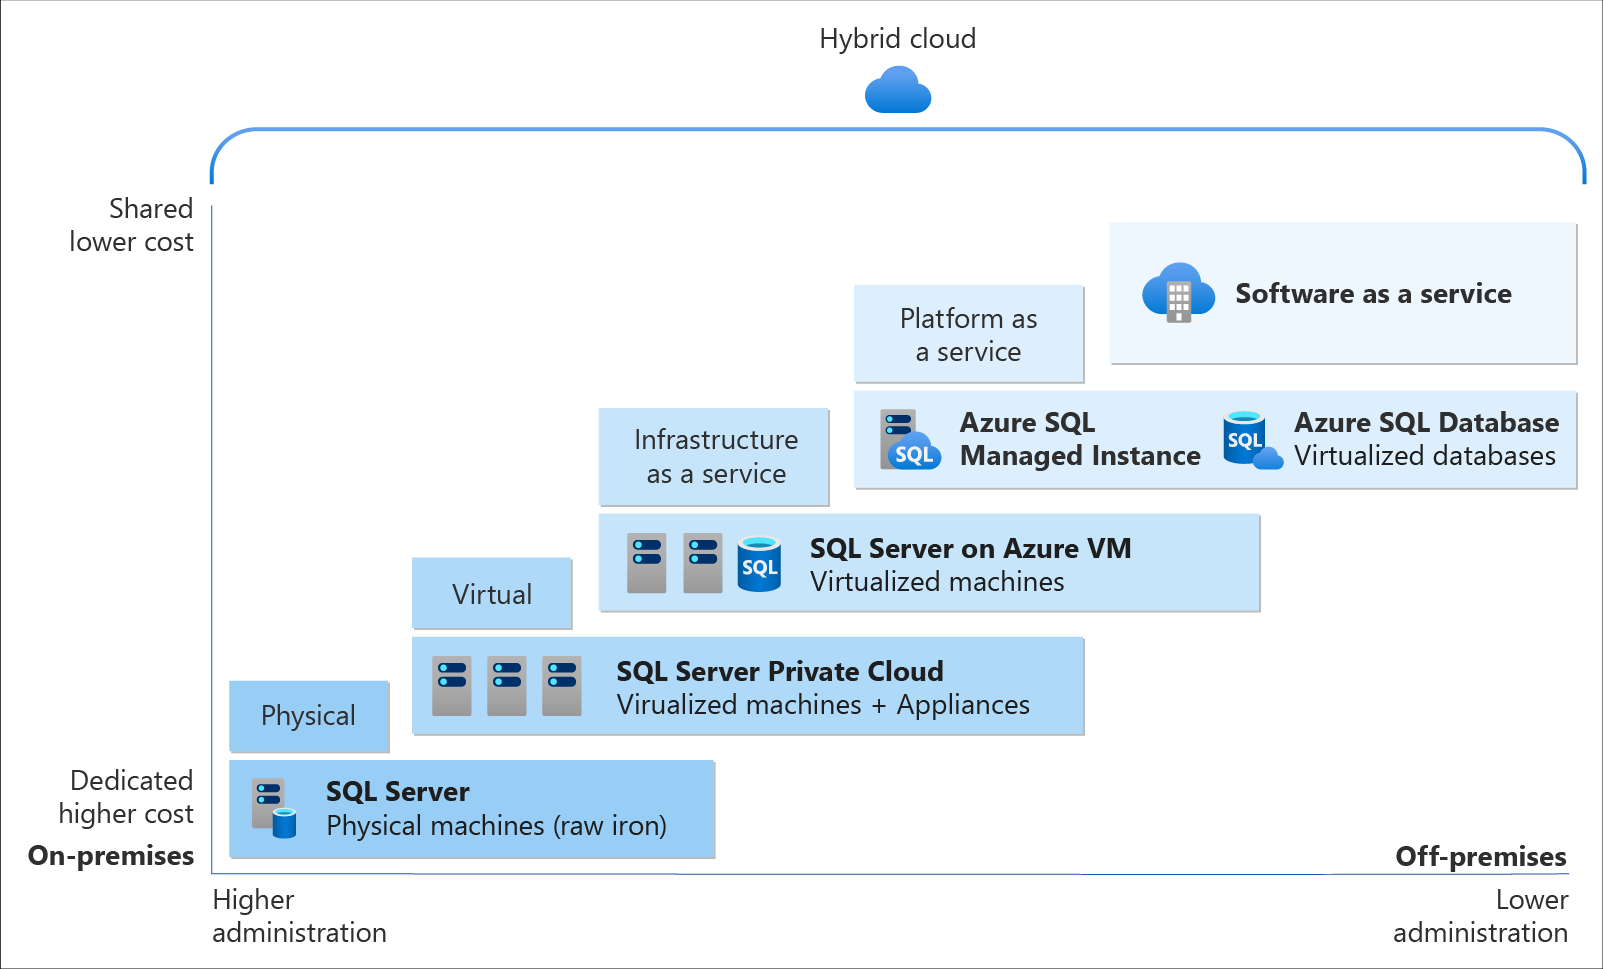
On Azure, there are two database deployment options available, i.e. IaaS and PaaS. IaaS option means that we have to host our SQL server on their virtual machines. For PaaS approach, we are able to either use Azure SQL Database, which is considered as DBaaS, or Azure SQL Managed Instance. Unless there is a need for the team to have OS-level access and control to the SQL servers, PaaS approach is normally the best choice.
Both PaaS and IaaS options include base price that covers underlying infrastructure and licensing. In IaaS, we can reduce the cost by shutting down the resources. However, in PaaS, the resources are always running unless we drop and re-create our resources when they are needed.
The level of administration we have over the infrastructure and by the degree of cost efficiency. (Image Source: Azure Docs)
SQL Managed Instance is the latest deployment option which enables easy migration of most of the on-premises databases to Azure. It’s a fully-fledged SQL instance with nearly complete compatible with on-premise version of SQL server. Also, since SQL Managed Instance is built on the same PaaS service infrastructure, it comes with all PaaS features. Hence, if you would like to migrate from on-premise to Azure without management overhead but at the same time you require instance-scoped features, such as SQL Server Agent, you can try the SQL Managed Instance.
Andreas Wolter, one of the only 7 Microsoft Certified Solutions Masters (MCSM) for the Data Platform worldwide, once came to Singapore .NET Developers Community to talk about the SQL Database Managed Instance. If you’re new to SQL Managed Instance, check out the video below.
Spatial Data Types
Visibility plays a crucial role in the logistics industry because it relates to the ability of supply chain partners to be able to access and share operation information with other parties. Tracking the asset locations with GPS is one of the examples. However, how should we handle the geography data in our database?
In Microsoft SQL Server, native spatial data types are used to represent spatial objects. In addition, it is able to index spatial data, provide cost-based optimizations, and support operations such as the intersection of two spatial objects. This functionality is also available in Azure SQL Database and Azure Managed Instances.
The geometry hierarchy upon which the geometry and geography data types are based. (Image Source: SQL Docs)
Let’s say now we want to find the closest containers to a prime mover as shown in the following map.
The locations of 5 containers (marked as red) and location of the prime mover (marked as blue).
In addition, we have a table of container positions defined with the schema below.
CREATE TABLE ContainerPositions
(
    Id int IDENTITY (1,1),
    ContainerNumber varchar(13) UNIQUE,
    Position GEOGRAPHY
);
Azure Table Storage is one of the Azure services storing non-relational structured data. It provides a key/attribute store with a schema-less design. Since it’s a NoSQL datastore, it is suitable for datasets which do not require complex joins and can be denormalised for fast access.
Globally, supply chain with Industry 4.0 is transformed into a smart and effective procedure to produce new outlines of income. Hence, the key impression motivating Industry 4.0 is to guide companies by transforming current manual processes with digital technologies.
Hard-copy of container proof of delivery (POD), for example, is still necessary in today’s container trucking industry. Hence, storing images and files for document generation and printing later is still a key feature in the digitalised supply chain workflow.
Proof of Delivery is now still mostly recorded on paper and sent via email or instant messaging services like Whatsapp. There is also no acceptable standard for what a proof of delivery form should specify. Each company more or less makes up their own rules.
On Azure, we can make use of Blob Storage to store large, discrete, binary objects that change infrequently, such as the documents like Proof of Delivery mentioned earlier.
Hence, as shown in the screenshot below, we can upload files from a computer to the Azure File Share directly. Then the files will be accessible in another computer which is also connected to the Azure File Share, as shown below.
We can mount Azure File Share on macOS, Windows, and even Linux.
The Data Team
Setting up a new data team, especially in a startup, is a challenging problem. We need to explore roles and responsibilities in the world of data.
There are basically three roles that we need to have in a data team.
Database Administrator: In charge of operations such as managing the databases, creating database backups, restoring backups, monitoring database server performance, and implementing data security and access rights policy.
Tools: SQL Server Management Studio, Azure Portal, Azure Data Studio, etc.
Data Engineer: Works with the data to build up data pipeline and processes as well as apply data cleaning routine and transformations. This role is important to turn the raw data into useful information for the data analysis.
Tools: SQL Server Management Studio, Azure Portal, Azure Synapse Studio.
Data Analysis: Explores and analyses data by creating data visualisation and reporting which transforms data into insights to help in business decision making.
Tools: Excel, Power BI, Power BI Report Builder
In 2016, Gartner, a global research and advisory firm, shared a Venn Diagram on how data science is multi-disciplinary as shown below. Hence, there are some crucial technical skills needed, such as statistics, querying, modelling, R, Python, SQL, and data visualisation. Besides the technical skill, the team also needs to be equipped with business domain knowledge and soft skills.
The data science Venn Diagram. (Image source: Gartner)
Throughout my career, I have been given data-related tasks such as getting the number of products sold in each category, retrieving a list of drivers of a certain trucking company, calculating the gross profit of the week, etc. The data is always spread across varied locations. They can be stored in JSON files, CSV files, relational databases, or even event streams. Of course, I can write a C# program or Python script to solve those tasks. However, could it be that there is no better solution to such problems?
To setup OctoSQL, we can simply download the executable file in the Release page of the OctoSQL GitHub project. After that, we can specify the path to the OctoSQL executable in the PATH system environment variable. Once we have done that, then when we run the following command, we shall be able to see the help page of the OctoSQL.
We can proceed to use OctoSQL now!
After that, we need to specify a data source configuration path in a system environment variable OCTOSQL_CONFIG so that in our future commands, we don’t need to keep specifying the same path to the configuration file.
Genshin Impact as Sample Data
I will use the data from my favourite game Genshin Impact here so that it’s more fun for me to explain.
In Genshin Impact, there are seven gods, and each takes charge of a different elemental domain. The seven elements are: Pyro (fire), Geo (earth), Dendro (grass), Cryo (ice), Electro (lightning), Anemo (wind), and Hydro (water). Every character makes use of one of these elements in battle.
Each character has different Max HP and other attributes.
Each of the characters can bring a weapon to the battle. Currently, there are 5 weapon types in Genshin Impact such as Swords, Bows, Polearms, Claymores, and Catalysts. Normally the weapon will have a Base ATK and some other attributes, as shown in the screenshot below.
A character can only master in using one single type of weapon.
Now, I will proceed to show a few ideas on how we can use this tool to make our data processing and analysing life easier.
Use Case #1: Single JSON File
Let’s say we have a JSON file called characters.json with game characters and their info, we would like to find out the highest Base HP of each Element. Hence, we will have our config file as follows.
Both Anemo and Geo characters have the highest Base HP.
Next, we can find out who are the characters having the highest Base HP in his/her own element group, as shown below, using nested query and inner join.
The characters who are having highest Base HP in each element.
Use Case #2: When JSON Meets CSV
Data is not always given to us in the same format. Hence, sometimes we will have situations where we need to do data analysis based on data in, for example, JSON and CSV. So, now let’s assume that we have the character’s weapon data stored in a CSV file. We will then have to update the config file as follows.
By default, OctoSQL assumes that the CSV file is using comma as delimiter and has a header row.
Now we can find out the maximum Base ATK for each of the elements.
Cyro and Pyro elements have the highest maximum Base ATK.
Use Case #3: JSON with PostgreSQL on Azure
Now, let’s assume that we are not given the CSV file. Instead, the data sits in a PostgreSQL database on the Microsoft cloud.
We can use Azure Data Studio to access the PostgreSQL database on Azure.
Could we easily do a table join between these two data sources, i.e. JSON and PostgreSQL? The answer is yes. We simply need to change the config file as follows, where we input the URL of the PostgreSQL server on Azure together with user info, database name, and the table name.
Interestingly, when I try to run a more complicated nested SQL, OctoSQL currently doesn’t return any result.
No results returned!
Query Plan in DOT Language and Graphviz
A directed graph of three nodes A, B, and C.
In OctoSQL, we can describe its query plan in DOT Language, a graph description language. For example, the DOT Language below describes a directed graph G of three nodes A, B, and C.
digraph G {
    A -> B -> C;
    A -> C;
}
Using the Graphviz, a package of open-source tools initiated by AT&T Labs Research, we can visualise the graph described in the DOT Language.
In OctoSQL, DOT Language is also used to describe the query plan. As shown in the following screenshot, it is a query plan for a simple query SELECT * FROM weapons w. We are using WebGraphviz here to display the corresponding graph.