I had ended up in a hospital bed a few times because of pneumonia, which is an infection of the lungs. It’s not a great experience lying on the hospital bed for weeks to receive treatments. Meanwhile, the COVID-19 infection can also progress to our lungs and thus it’s possible to develop pneumonia because of COVID-19 infection. So before it’s too late, I shall have the vaccination done.
Nominated
As a staff working in National University of Singapore, I was nominated to received the COVID-19 vaccination in early June 2021. Hence, I don’t need to go through the registration process and can directly book the vaccination day.
We are allowed to choose a vaccination centre. Once it’s chosen, we cannot change the vaccination centre to another one after the 1st dose. The one I picked is located at Raffles City Convention Centre which offered Pfizer vaccines.
On the day of vaccination, I also brought my NRIC and a bag with a bottle of plain water inside. We will be receiving vaccination information sheet and other documents after the vaccination, so it’s better to bring a bag to keep them safe.
Receiving the Covid-19 vaccine at the Raffles City Convention Centre. (Photo Source: The Straits Times)
Vaccination
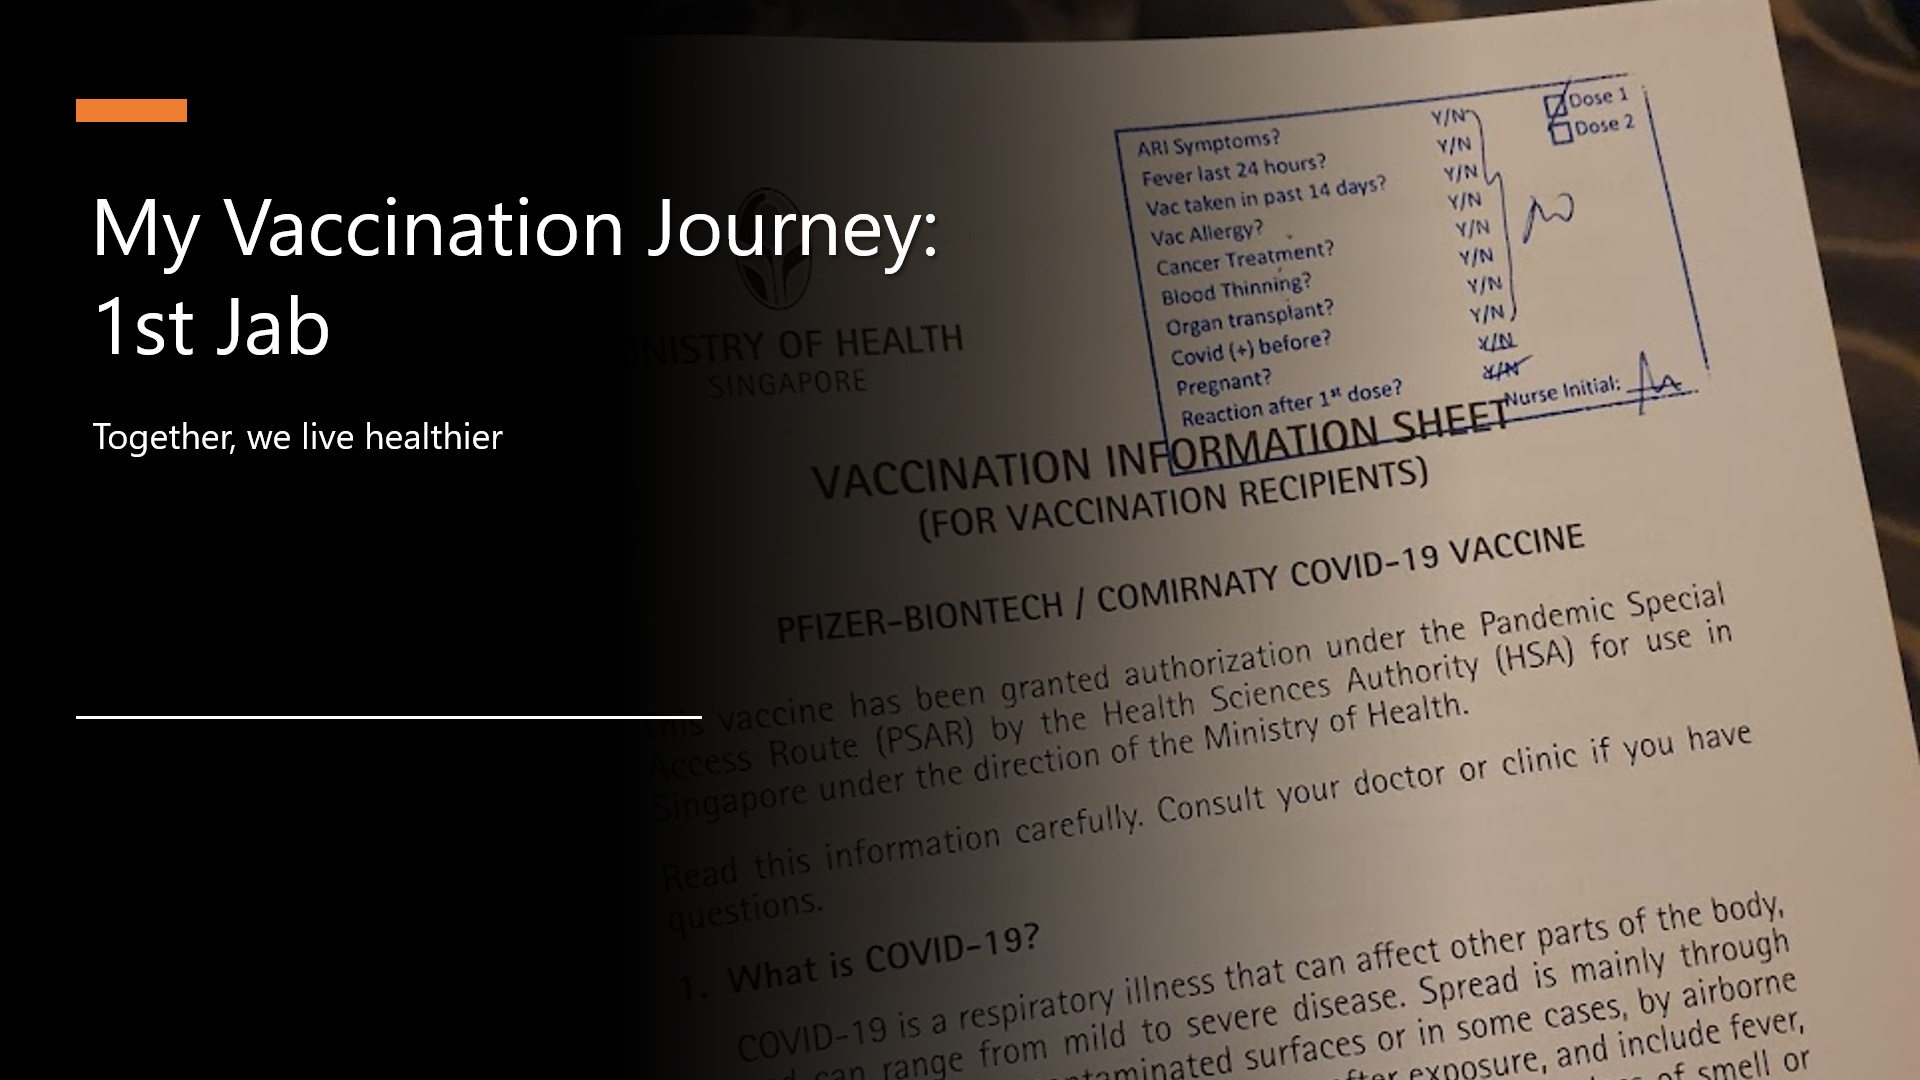
The timeslot I booked for the vaccination is at 3pm. The queue was rather short. I had only queued for 15 minutes. During this period of time, the staff in the vaccination centre checked with each of us, the vaccination recipients, about the health conditions to see whether we have following issues such as
ARI Symptoms;
Fever in the past 24 hours;
Other vaccines taken in past 14 days;
Cancer treatment;
Blood thinning;
Organ transplant;
Infected by COVID before;
Pregnant;
Reaction after 1st dose (for those who are taking 2nd dose).
If there are no serious issues, we will then be allowed to proceed to get vaccinated.
The vaccination information sheet.
The actual vaccination took less than one minute. After that, we are brought to the observation area.
Observation
The observation area is for us to sit on a chair and wait for 30 minutes to see whether any negative reaction occurs. There was also audio announcement in the observation area in four languages, i.e. English, Chinese, Bahasa Melayu, and Tamil. The announcement is important because it gives us advises on what to do after the vaccination and having severe allergic reaction.
The observation area in Raffles City Conference Centre. (Image Source: The Straits Times)
In order to kill time and destress, many of the vaccination recipients chose to read articles or watch videos on their smartphone. Hence, sometimes when the staff called their name to let them know the waiting time was over, they were still sitting there.
After 30 minutes of observation, the staff called my name and passed me a vaccination card. The vaccination card is the most important document throughout the vaccination journey because we need to bring the card for the 2nd dose.
After Vaccination
First of all, no fever.
I could feel a bit pain in the area of injection on my left arm when I lifted it upward in the first four days after the vaccination. I also avoided sleeping on left side because that would give pressure to my left arm and that would be a bit painful. Other than these minor issues, basically I had not encountered any side effect.
Yup, that’s all of my vaccination journey. Let’s discuss again when I have the 2nd dose.
Together, we live healthier.
During the observation period, I was playing Honkai Impact 3rd to not only kill time but also stop myself from thinking too much about the vaccination.
It has been almost half a year since the first case relating to the COVID-19 pandemic in Singapore, the country I am now working at, was confirmed. Two days after the first case was confirmed in Singapore, eight travellers entering Malaysia, my home country, from Singapore were confirmed to be infected as well.
Since then, we were asked to work from home as travel restriction is applied in both countries. While the situation is not getting better, it’s quite disappointing to know that there are still people believing that COVID-19 is a hoax.
Fortunately, there are still a lot more people working hard in this tough period. Earlier on, my friend who is doing research in Colorado told me that she’s working hard with a group of scientists to educate the public about the virus.
🎨 People endured hours-long queues to enter Singapore from Malaysia before the travel restrictions to curb the spread of COVID-19 came into force. 🎨
In my previous article, I talked about how Google BigQuery could work together with Google Data Studio to render beautiful reports without any coding. Thus, in this article, I will show how we can write a simple web client in Golang to fetch data from the BigQuery via its API.
🎨 There are a lot of public datasets available in the GCP Marketplace. 🎨
In order to access the public datasets, we first need to enable them through the Google BigQuery documentation (I find this to be quite funny because Google makes the enabling link to be so hidden). In the “Using the Web UI” page, as shown in the screenshot below, we can then find an URL which will let us open the public datasets project manually through browser (Remember to update the &page=project to your project in GCP).
🎨 The link to enable the public datasets in the web UI. 🎨
The COVID-19 Dataset
Once we have done the steps above, we shall see the public datasets, including the COVID-19 datasets, available in our Google BigQuery. The dataset that I will be using in this article is the covid19_jhu_csse, a daily updated data repository for COVID-19 from JHU CSSE.
🎨 The covid19_jhu_csse dataset. 🎨
There are four tables under the dataset where the first three recording the number of confirmed cases, the number of reported deaths, and the number of recovered cases, respectively, in each of the country or region.
The interesting about the first three tables is that they recorded the numbers of each day in a separated column. Hence, every day, there will be one new column added to three of the tables. I’m not sure why they do so but this actually requires us to write our own client in order to get the data. Google Data Studio cannot work well with dynamic column names.
🎨 A column for each of the day. 🎨
Luckily, there is a fourth table called summary which actually has just one date column and every record for each day is one row instead of one column. This is a more SQL-friendly table and can be integrated with Google Data Studio easily.
🎨 The summary table is more SQL-friendly because the date is stored in just one column. 🎨
In this article, I will demonstrate using 1st, 2nd, and 4th table in order to show how we can programmatically get the data through the BigQuery API.
For example, if we are fetching the date as well as numbers of confirmed cases and deaths, we will be using the the following SQL.
`SELECT
    CAST(date as STRING) as date,
    IFNULL(confirmed, 0) as confirmed_cases,
    IFNULL(deaths, 0) as deaths
FROM ` + "`bigquery-public-data.covid19_jhu_csse.summary`" + ` ORDER BY date;
There are a few things to take note here is the use of CAST.
In addition, we also use IFNULL to make sure that the value in the confirmed_cases and deaths are always non-negative integers. In the original tables, the numbers can be null.
Now, we just need to have a struct where we can apply RowIterator.Next() to load each row into it. The struct that corresponding to the SQL above is as follows.
type QueryResultDataRow struct {
    Date           string `bigquery:"date"`
    ConfirmedCases int64  `bigquery:"confirmed_cases"`
    Deaths         int64  `bigquery:"deaths"`
}
To iterate, we can use the code below.
func processQueryResult1(iter *bigquery.RowIterator) []QueryResultDataRow {
    var result []QueryResultDataRow

    for {
        var row QueryResultDataRow

        err := iter.Next(&row)

        if err == iterator.Done {
            break
        }

        if err != nil {
            log.Print(err)
            continue
        }

        result = append(result, row)
    }

    return result
}
If you would like to challenge yourself to retrieve the data from the tables having dates as their columns, it is possible too, just with a few challenges.
First challenge is that we are not sure when the dataset will be updated. So, we can never be sure for the value of the last column. Since the dataset will be updated daily, to be safe, we can let the date of two days ago to be the last column in our query.
Once we get the column name, we can then use it in the following query.
`SELECT
    IFNULL(province_state, "") AS place,
    country_region,
    latitude,
    longitude,
    (` + latestDateInQuery + `) AS count
FROM ` + "`bigquery-public-data.covid19_jhu_csse.confirmed_cases`;"
Visualising the Data
With the queries above, we can then easily generate results with Google Charts. Here, I use the Line Chart and the GeoChart.
🎨 The COVID-19 dashboard powered by Golang and Google BigQuery. 🎨
There is an interesting feature in GeoChart is that, by default, when we are using latitude and longitude instead of the address to identify the places, the text shown on the map tooltip will be the latitude and longitude, which is not user friendly. However, we can actually change the text by putting a description column right after the longitude column, as discussed over here on Google Groups. It’s interesting because this is said to be an undocumented support for such a column. So we’re not sure where this will stop working.
Next, I am using web page done with Material Design to display the charts. Please enjoy the following screenshots.
🎨 Charts showing the situation in both of my beloved countries. 🎨
🎨 Top 10 countries having the most confirmed cases. 🎨
🎨 The global situation where we locate the places with latitudes and longitudes. 🎨
That’s all for the COVID-19 dashboard done using Golang and Google BigQuery. Also, thanks to JHU CSSE and Google, we are able to access to such an important data for free.
Finally, I’d like to wish all of you and your loved ones to stay safe and healthy.
🎨 A nurse checks the temperature of a visitor as part of the COVID-19 screening procedure. (Photo Credit: The Straits Times) 🎨