Let’s start with a problem that many of us in the systems engineering world have faced. You have a computationally intensive application such as a financial model, a scientific process, or in my case, a Discrete Event Simulation (DES). The code is correct, but it is slow.
In some DES problems, to get a statistically reliable answer, you cannot just run it once. You need to run it 5,000 times with different inputs, which is a massive parameter sweep combined with a Monte Carlo experiment to average out the randomness.
If you run this on your developer machine, it will finish in 2026. If you rent a single massive VM on cloud, you are burning money while one CPU core works and the others idle.
This is a brute-force computation problem. How do you solve it without rewriting your entire app? You build a simulation lab on Kubernetes. Here is the blueprint.
About Time
My specific app is a DES built with a C# library called SNA. In DES, the integrity of the entire system depends on a single, unified virtual clock and a centralised Future Event List (FEL). The core promise of the simulation engine is to process events one by one, in strict chronological order.
The FEL is a core component of a DES, which manages and schedules all future events that will occur in the simulation.
This creates an architectural barrier. You cannot simply chop a single simulation into pieces and run them on different pods on Kubernetes. Each pod has its own system clock, and network latency would destroy the causal chain of events. A single simulation run is, by its nature, an inherently single-threaded process.
We cannot parallelise the simulation, but we can parallelise the experiment.
This is what is known as an Embarrassingly Parallel problem. Since the multiple simulation runs do not need to talk to each other, we do not need a complex distributed system. We need an army of independent workers.
The Blueprint: The Simulation Lab
To solve this, I moved away from the idea of a “server” and toward the idea of a “lab”.
Our architecture has three components:
The Engine: A containerised .NET app that can run one full simulation and write its results as structured logs;
The Orchestrator: A system to manage the parameter sweep, scheduling thousands of simulation pods and ensuring they all run with unique inputs;
The Observatory: A centralised place to collect and analyse the structured results from the entire army of pods.
The Engine: Headless .NET
The foundation is a .NET console programme.
We use System.CommandLine to create a strict contract between the container and the orchestrator. We expose key variables of the simulation as CLI arguments, for example, arrival rates, resource counts, service times.
using System.CommandLine;
var rootCommand = new RootCommand { Description = "Discrete Event Simulation Demo CLI\n\n" + "Use 'demo <subcommand> --help' to view options for a specific demo.\n\n" + "Examples:\n" + " dotnet DemoApp.dll demo simple-generator\n" + " dotnet DemoApp.dll demo mmck --servers 3 --capacity 10 --arrival-secs 2.5" };
// Show help when run with no arguments if (args.Length == 0) { Console.WriteLine("No command provided. Showing help:\n"); rootCommand.Invoke("-h"); // Show help return 1; }
// ---- Demo: simple-server ---- var meanArrivalSecondsOption = new Option<double>( name: "--arrival-secs", description: "Mean arrival time in seconds.", getDefaultValue: () => 5.0 );
var simpleServerCommand = new Command("simple-server", "Run the SimpleServerAndGenerator demo"); simpleServerCommand.AddOption(meanArrivalSecondsOption);
var demoCommand = new Command("demo", "Run a simulation demo"); demoCommand.AddCommand(simpleServerCommand);
rootCommand.AddCommand(demoCommand);
return await rootCommand.InvokeAsync(args);
This console programme is then packaged into a Docker container. That’s it. The engine is complete.
The Orchestrator: Unleashing an Army with Argo Workflows
How do you manage a great number of pods without losing your mind?
My first attempt was using standard Kubernetes Jobs. Kubernetes Jobs are primitive, so they are hard to visualise, and managing retries or dependencies requires writing a lot of fragile bash scripts.
Argo allows us to define the entire parameter sweep as a single workflow object. The killer feature here is the withItems. Alternative, using withParam loop, we can feed Argo a JSON list of parameter combinations, and it handles the rest: Fan-out, throttling, concurrency control, and retries.
This YAML file is our lab manager. It can also be extended to support scheduling, retries, and parallelism, transforming a complex manual task into a single declarative manifest.
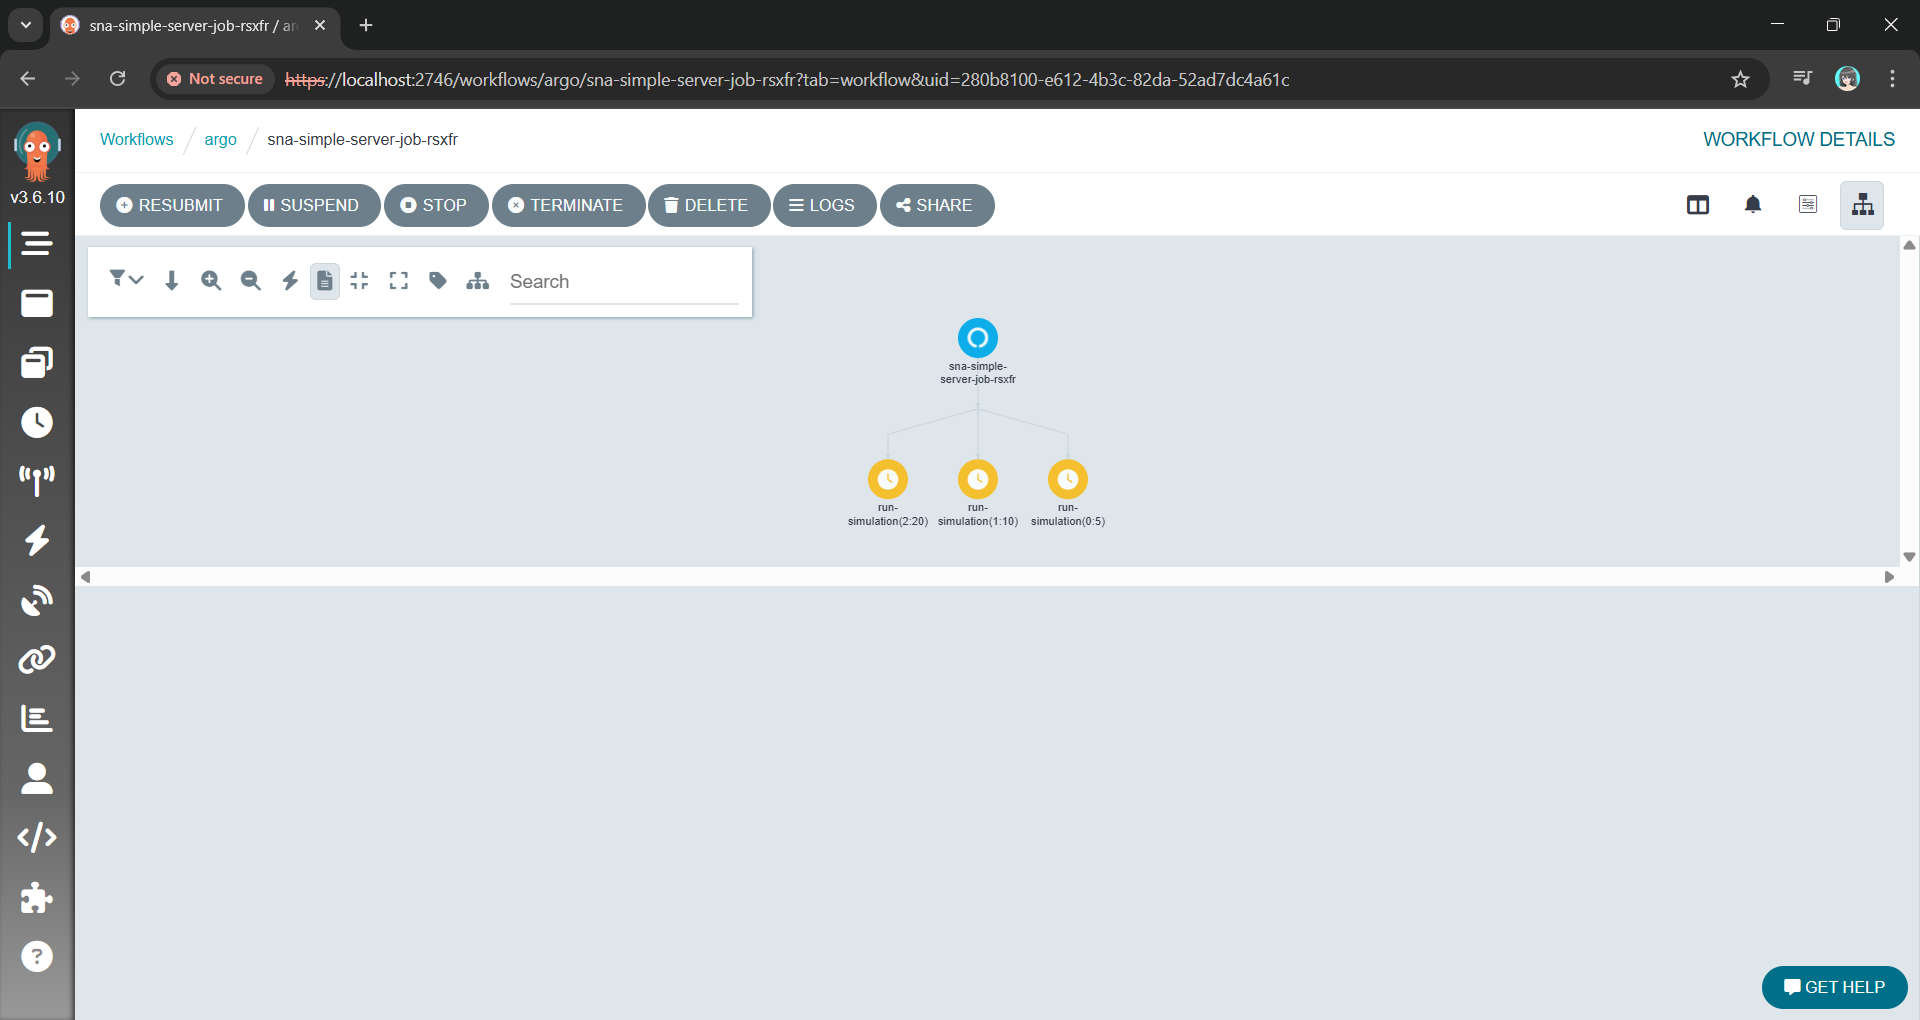
The Argo Workflow UI with the fan-out/parallel nodes using the YAML above.
Instead of managing pods, we are now managing a definition of an experiment.
The Observatory: Finding the Needle in a Thousand Haystacks
With a thousand pods running simultaneously, kubectl logs is useless. You are generating gigabytes of text per minute. If one simulation produces an anomaly, finding it in a text stream is impossible.
We solve this with Structured Logging.
By using Serilog, our .NET Engine does not just write text. Instead, it emits machine-readable events with key-value pairs for our parameters and results. Every log entry contains the input parameters (for example, { "WorkerCount": 5, "ServiceTime": 10 }) attached to the result.
These structured logs are sent directly to a centralised platform like Seq. Now, instead of a thousand messy log streams, we have a single, queryable database of our entire experiment results.
Viewing the structured log on Seq generated with Serilog.
Wrap-Up: A Reusable Pattern
This architecture allows us to treat the Kubernetes not just as a place to host websites, but as a massive, on-demand supercomputer.
By separating the Engine from the Orchestrator and the Observatory, we have taken a problem that was too slow for a single machine and solved it using the native strengths of the Kubernetes. We did not need to rewrite the core C# logic. Instead, we just needed to wrap it in a clean interface and unleash a container army to do the work.
The full source code for the SNA library and the Argo workflow examples can be found on GitHub: https://github.com/gcl-team/SNA
The turnout for my DES session in Taipei confirmed a growing hunger in our industry for proactive, simulation-driven approaches to engineering.
In today’s interconnected world, APIs are the backbone of modern apps. Protecting these APIs and ensuring only authorised users access sensitive data is now more crucial than ever. While many authentication and authorisation methods exist, OAuth2 Introspection stands out as a robust and flexible approach. In this post, we will explore what OAuth2 Introspection is, why we should use it, and how to implement it in our .NET apps.
Before we dive into the technical details, let’s remind ourselves why API security is so important. Think about it: APIs often handle the most sensitive stuff. If those APIs are not well protected, we are basically opening the door to some nasty consequences. Data breaches? Yep. Regulatory fines (GDPR, HIPAA, you name it)? Potentially. Not to mention, losing the trust of our users. A secure API shows that we value their data and are committed to keeping it safe. And, of course, it helps prevent the bad guys from exploiting vulnerabilities to steal data or cause all sorts of trouble.
The most common method of securing APIs is using access tokens as proof of authorization. These tokens, typically in the form of JWTs (JSON Web Tokens), are passed by the client to the API with each request. The API then needs a way to validate these tokens to verify that they are legitimate and haven’t been tampered with. This is where OAuth2 Introspection comes in.
OAuth2 Introspection
OAuth2 Introspection is a mechanism for validating bearer tokens in an OAuth2 environment. We can think of it as a secure lookup service for our access tokens. It allows an API to query an auth server, which is also the “issuer” of the token, to determine the validity and attributes of a given token.
The workflow of an OAuth2 Introspection request.
To illustrate the process, the diagram above visualises the flow of an OAuth2 Introspection request. The Client sends the bearer token to the Web API, which then forwards it to the auth server via the introspection endpoint. The auth server validates the token and returns a JSON response, which is then processed by the Web API. Finally, the Web API grants (or denies) access to the requested resource based on the token validity.
Introspection vs. Direct JWT Validation
You might be thinking, “Isn’t this just how we normally validate a JWT token?” Well, yes… and no. What is the difference, and why is there a special term “Introspection” for this?
With direct JWT validation, we essentially check the token ourselves, verifying its signature, expiry, and sometimes audience. Introspection takes a different approach because it involves asking the auth server about the token status. This leads to differences in the pros and cons, which we will explore next.
With OAuth2 Introspection, we gain several key advantages. First, it works with various token formats (JWTs, opaque tokens, etc.) and auth server implementations. Furthermore, because the validation logic resides on the auth server, we get consistency and easier management of token revocation and other security policies. Most importantly, OAuth2 Introspection makes token revocation straightforward (e.g., if a user changes their password or a client is compromised). In contrast, revoking a JWT after it has been issued is significantly more complex.
.NET Implementation
Now, let’s see how to implement OAuth2 Introspection in a .NET Web API using the AddOAuth2Introspection authentication scheme.
The core configuration lives in our Program.cs file, where we set up the authentication and authorisation services.
// ... (previous code for building the app)

builder.Services.AddAuthentication("Bearer")
   .AddOAuth2Introspection("Bearer", options =>
   {
       options.IntrospectionEndpoint = "<Auth server base URL>/connect/introspect";
       options.ClientId = "<Client ID>";
       options.ClientSecret = "<Client Secret>";

       options.DiscoveryPolicy = new IdentityModel.Client.DiscoveryPolicy
       {
           RequireHttps = false,
       };
   });

builder.Services.AddAuthorization();

// ... (rest of the Program.cs)
This code above configures the authentication service to use the “Bearer” scheme, which is the standard for bearer tokens. AddOAuth2Introspection(…) is where the magic happens because it adds the OAuth2 Introspection authentication handler by pointing to IntrospectionEndpoint, the URL our API will use to send the token for validation.
Usually, RequireHttps needs to be true in production. However, in situations like when the API and the auth server are both deployed to the same Elastic Container Service (ECS) cluster and they communicate internally within the AWS network, we can set it to false. This is because the Application Load Balancer (ALB) handles the TLS/SSL termination and the internal communication between services happens over HTTP, we can safely disable RequireHttps in the DiscoveryPolicy for the introspection endpoint within the ECS cluster. This simplifies the setup without compromising security, as the communication from the outside world to our ALB is already secured by HTTPS.
Finally, to secure our API endpoints and require authentication, we can simply use the [Authorize] attribute, as demonstrated below.
[ApiController]
[Route("[controller]")]
[Authorize]
public class MyController : ControllerBase
{
   [HttpGet("GetData")]
   public IActionResult GetData()
   {
       ...
   }
}
Wrap-Up
OAuth2 Introspection is a powerful and flexible approach for securing our APIs, providing a centralised way to validate bearer tokens and manage access. By understanding the process, implementing it correctly, and following best practices, we can significantly improve the security posture of our apps and protect our valuable data.
In the previous article, we have discussed about how we can build a custom monitoring pipeline that has Grafana running on Amazon ECS to receive metrics and logs, which are two of the observability pillars, sent from the Orchard Core on Amazon ECS. Today, we will proceed to talk about the third pillar of observability, traces.
Source Code
The CloudFormation templates and relevant C# source codes discussed in this article is available on GitHub as part of the Orchard Core Basics Companion (OCBC) Project:https://github.com/gcl-team/Experiment.OrchardCore.Main.
Lisa Jung, senior developer advocate at Grafana, talks about the three pillars in observability (Image Credit: Grafana Labs)
We choose Tempo because it is fully compatible with OpenTelemetry, the open standard for collecting distributed traces, which ensures flexibility and vendor neutrality. In addition, Tempo seamlessly integrates with Grafana, allowing us to visualise traces alongside metrics and logs in a single dashboard.
Finally, being a Grafana Labs project means Tempo has strong community backing and continuous development.
About OpenTelemetry
With a solid understanding of why Tempo is our tracing backend of choice, let’s now dive deeper into OpenTelemetry, the open-source framework we use to instrument our Orchard Core app and generate the trace data Tempo collects.
OpenTelemetry is a Cloud Native Computing Foundation (CNCF) project and a vendor-neutral, open standard for collecting traces, metrics, and logs from our apps. This makes it an ideal choice for building a flexible observability pipeline.
OpenTelemetry provides SDKs for instrumenting apps across many programming languages, including C# via the .NET SDK, which we use for Orchard Core.
OpenTelemetry uses the standard OTLP (OpenTelemetry Protocol) to send telemetry data to any compatible backend, such as Tempo, allowing seamless integration and interoperability.
The http_listen_port allows us to set the HTTP port (3200) for Tempo internal web server. This port is used for health checks and Prometheus metrics.
After that, we configure where Tempo listens for incoming trace data. In the configuration above, we enabled OTLP receivers via both gRPC and HTTP, the two protocols that OpenTelemetry SDKs and agents use to send data to Tempo. Here, the ports 4317 (gRPC) and 4318 (HTTP) are standard for OTLP.
Last but not least, in the configuration, as demonstration purpose, we use the simplest one, local storage, to write trace data to the EC2 instance disk under /tmp/tempo/traces. This is fine for testing or small setups, but for production we will likely want to use services like Amazon S3.
In addition, since we are using local storage on EC2, we can easily SSH into the EC2 instance and directly inspect whether traces are being written. This is incredibly helpful during debugging. What we need to do is to run the following command to see whether files are being generated when our Orchard Core app emits traces.
ls -R /tmp/tempo/traces
The configuration above is intentionally minimal. As our setup grows, we can explore advanced options like remote storage, multi-tenancy, or even scaling with Tempo components.
Each flushed trace block (folder with UUID) contains a data.parquet file, which holds the actual trace data.
Finally, in order to enable Tempo to start on boot, we create a systemd unit file that allows Tempo to start on boot and automatically restart if it crashes.
cat <<EOF > /etc/systemd/system/tempo.service [Unit] Description=Grafana Tempo service After=network.target
systemctl daemon-reexec systemctl daemon-reload systemctl enable --now tempo
This systemd service ensures that Tempo runs in the background and automatically starts up after a reboot or a crash. This setup is crucial for a resilient observability pipeline.
Did You Know: When we SSH into an EC2 instance running Amazon Linux 2023, we will be greeted by a cockatiel in ASCII art! (Image Credit: OMG! Linux)
Understanding OTLP Transport Protocols
In the previous section, we configured Tempo to receive OTLP data over both gRPC and HTTP. These two transport protocols are supported by the OTLP, and each comes with its own strengths and trade-offs. Let’s break them down.
Ivy Zhuang from Google gave a presentation on gRPC and Protobuf at gRPConf 2024. (Image Credit: gRPC YouTube)
Tempo has native support for gRPC, and many OpenTelemetry SDKs default to using it. gRPC is a modern, high-performance transport protocol built on top of HTTP/2. It is the preferred option when performanceis critical. gRPC also supports streaming, which makes it ideal for high-throughput scenarios where telemetry data is sent continuously.
However, gRPC is not natively supported in browsers, so it is not ideal for frontend or web-based telemetry collection unless a proxy or gateway is used. In such scenarios, we will normally choose HTTP which is browser-friendly. HTTP is a more traditional request/response protocol that works well in restricted environments.
Since we are collecting telemetry from server-side like Orchard Core running on ECS, gRPC is typically the better choice due to its performance benefits and native support in Tempo.
Please take note that since gRPC requires HTTP/2, which some environments, for example, IoT devices and embedding systems, might not have mature gRPC client support, OTLP over HTTP is often preferred in simpler or constrained systems.
gRPC allows multiplexing over a single connection using HTTP/2. Hence, in gRPC, all telemetry signals, i.e. logs, metrics, and traces, can be sent concurrently over one connection. However, with HTTP, each telemetry signal needs a separate POST request to its own endpoint as listed below to enforce clean schema boundaries, simplify implementation, and stay aligned with HTTP semantics.
Logs:/v1/logs;
Metrics:/v1/metrics;
Traces:/v1/traces.
In HTTP, since each signal has its own POST endpoint with its own protobuf schema in the body, there is no need for the receiver to guess what is in the body.
AWS Distro for Open Telemetry (ADOT)
Now that we have Tempo running on EC2 and understand the OTLP protocols it supports, the next step is to instrument our Orchard Core to generate and send trace data.
The following code snippet shows what a typical direct integration with Tempo might look like in an Orchard Core.
This approach works well for simple use cases during development stage, but it comes with trade-offs that are worth considering. Firstly, we couple our app directly to the observability backend, reducing flexibility. Secondly, central management becomes harder when we scale to many services or environments.
ADOT is a secure, AWS-supported distribution of the OpenTelemetry project that simplifies collecting and exporting telemetry data from apps running on AWS services, for example our Orchard Core on ECS now. ADOT decouples our apps from the observability backend, provides centralised configuration, and handles telemetry collection more efficiently.
Sidecar Pattern
We can deploy the ADOT in several ways, such as running it on a dedicated node or ECS service to receive telemetry from multiple apps. We can also take the sidecar approach which cleanly separates concerns. Our Orchard Core app will focus on business logic, while a nearby ADOT sidecar handles telemetry collection and forwarding. This mirrors modern cloud-native patterns and gives us more flexibility down the road.
The following CloudFormation template shows how we deploy ADOT as a sidecar in ECS using CloudFormation. The collector config is stored in AWS Systems Manager Parameter Store under /myapp/otel-collector-config, and injected via the AOT_CONFIG_CONTENT environment variable. This keeps our infrastructure clean, decoupled, and secure.
Deploy an ADOT sidecar on ECS to collect observability data from Orchard Core.
There are several interesting and important details in the CloudFormation snippet above that are worth calling out. Let’s break them down one by one.
Firstly, we choose awsvpc as the NetworkMode of the ECS task. In awsvpc, each container in the ECS task, i.e. our Orchard Core container and the ADOT sidecar, receives its own ENI (Elastic Network Interface). This is great for network-level isolation. With this setup, we can reference the sidecar from our Orchard Core using its container name through ECS internal DNS, i.e. http://adot-collector:4317.
Secondly, we include a health check for the ADOT container. ECS will use this health check to restart the container if it becomes unhealthy, improving reliability without manual intervention. In November 2022, Paurush Garg from AWS added the healthcheck component with the new ADOT collector release, so we can simply specify that we will be using this healthcheck component in the configuration that we will discuss next.
Yes, the configuration! Instead of hardcoding the ADOT configuration into the task definition, we inject it securely at runtime using the AOT_CONFIG_CONTENT secret. This environment variable AOT_CONFIG_CONTENT is designed to enable us to configure the ADOT collector. It will override the config file used in the ADOT collector entrypoint command.
The SSM Parameter for the environment variable AOT_CONFIG_CONTENT.
Wrap-Up
By now, we have completed the journey of setting up Grafana Tempo on EC2, exploring how traces flow through OTLP protocols like gRPC and HTTP, and understanding why ADOT is often the better choice in production-grade observability pipelines.
With everything connected, our Orchard Core app is now able to send traces into Tempo reliably. This will give us end-to-end visibility with OpenTelemetry and AWS-native tooling.
During the session, Mohammad L. U. Tanjim, the Product Manager of ApiDog, gave a detailed walkthrough of the API-First design and how Apidog can be used for this approach.
Apidog helps us to define, test, and document APIs in one place. Instead of manually writing Swagger docs and using API tool separately, ApiDog combines everything. This means frontend developers can get mock APIs instantly, and backend developers as well as QAs can get clear API specs with automatic testing support.
Hence, for the customised headless APIs, we will adopt an API-First design approach. This approach ensures clarity, consistency, and efficient collaboration between backend and frontend teams while reducing future rework.
By designing APIs upfront, we reduce the likelihood of frequent changes that disrupt development. It also ensures consistent API behaviour and better long-term maintainability.
For our frontend team, with a well-defined API specification, they can begin working with mock APIs, enabling parallel development. This eliminates dependencies where frontend work is blocked by backend completion.
For QA team, API spec will be important to them because it serve as a reference for automated testing. The QA engineers can validate API responses before implementation.
API Design Journey
In this article, we will embark on an API Design Journey by transforming a traditional travel agency in Singapore into an API-first system. To achieve this, we will use Apidog for API design and testing, and Orchard Core as a CMS to manage travel package information. Along the way, we will explore different considerations in API design, documentation, and integration to create a system that is both practical and scalable.
Many traditional travel agencies in Singapore still rely on manual processes. They store travel package details in spreadsheets, printed brochures, or even handwritten notes. This makes it challenging to update, search, and distribute information efficiently.
The reliance on physical posters and brochures of a travel agency is interesting in today’s digital age.
By introducing a headless CMS like Orchard Core, we can centralise travel package management while allowing different clients like mobile apps to access the data through APIs. This approach not only modernises the operations in the travel agency but also enables seamless integration with other systems.
API Design Journey 01: The Design Phase
Now that we understand the challenges of managing travel packages manually, we will build the API with Orchard Core to enable seamless access to travel package data.
Instead of jumping straight into coding, we will first focus on the design phase, ensuring that our API meets the business requirements. At this stage, we focus on designing endpoints, such as GET /api/v1/packages, to manage the travel packages. We also plan how we will structure the response.
Given the scope and complexity of a full travel package CMS, this article will focus on designing a subset of API endpoints, as shown in the screenshot below. This allows us to highlight essential design principles and approaches that can be applied across the entire API journey with Apidog.
Let’s start with eight simple endpoints.
For the first endpoint “Get all travel packages”, we design it with the following query parameters to support flexible and efficient result filtering, pagination, sorting, and text search. This approach ensures that users can easily retrieve and navigate through travel packages based on their specific needs and preferences.
GET /api/v1/packages?page=1&pageSize=20&sortBy=price&sortOrder=asc&destinationId=4&priceRange[min]=500&priceRange[max]=2000&rating=4&searchTerm=spa
Pasting the API path with query parameters to the Endpoint field will auto populate the Request Params section in Apidog.
Same with the request section, the Response also can be generated based on a sample JSON that we expect the endpoint to return, as shown in the following screenshot.
As shown in the Preview, the response structure can be derived from a sample JSON.
In the screenshot above, the field “description” is marked as optional because it is the only property that does not exist in all the other entry in “data”.
Besides the success status, we also need another important HTTP 400 status code which tells the client that something is wrong with their request.
By default, for generic error responses like HTTP 400, there are response components that we can directly use in Apidog.
The reason why we need HTTP 400 is that, instead of processing an invalid request and returning incorrect or unexpected results, our API should explicitly reject it, ensuring that the client knows what needs to be fixed. This improves both developer experience and API reliability.
After completing the endpoint for getting all travel packages, we also have another POST endpoint to search travel packages.
While GET is the standard method for retrieving data from an API, complex search queries involving multiple parameters, filters, or file uploads might require the use of a POST request. This is particularly true when dealing with advanced search forms or large amounts of data, which cannot be easily represented as URL query parameters. In these cases, POST allows us to send the parameters in the body of the request, ensuring the URL remains manageable and avoiding URL length limits.
For example, let’s assume this POST endpoint allows us to search for travel packages with the following body.
We can also easily generate the data schema for the body by pasting this JSON as example into Apidog, as shown in the screenshot below.
Setting up the data schema for the body of an HTTP POST request.
When making an HTTP POST request, the client sends data to the server. While JSON in the request body is common, there is also another format used in APIs, i.e. multipart/form-data (also known as form-data).
The form-data is used when the request body contains files, images, or binary data along with text fields. So, if our endpoint /api/v1/packages/{id}/reviews allows users to submit both text (review content and rating) and an image, using form-data is the best choice, as demonstrated in the following screenshot.
Setting up a request body which is multipart/form-data in Apidog.
API Design Journey 02: Prototyping with Mockups
When designing the API, it is common to debate, for example, whether reviews should be nested inside packages or treated as a separate resource. By using Apidog, we can quickly create mock APIs for both versions and tested how they would work in different use cases. This helps us make a data-driven decision instead of endless discussions.
A list of mock API URLs for our “Get all travel packages” endpoint.
Clicking on the “Request” button next to each of the mock API URL will bring us to the corresponding mock response, as shown in the following screenshot.
Default mock response for HTTP 200 of our first endpoint “Get all travel packages”.
As shown in the screenshot above, some values in the mock response are not making any sense, for example negative id and destinationId, rating which is supposed to be between 1 and 5, “East” as sorting direction, and so on. How could we fix them?
Firstly, we will set the id (and destinationId) to be any positive integer number starting from 1.
Setting id to be a positive integer number starting from 1.
Secondly, we update both the price and rating to be float. In the following screenshot, we specify that the rating can be any float from 1.0 to 5.0 with single fraction digit.
Apidog is able to generate an example based on our condition under “Preview”.
Finally, we will indicate that the sorting direction can only be either ASC or DESC, as shown in the following screenshot.
Configuring the possible value for the direction field.
With all the necessary mock values configuration, if we fetch the mock response again, we should be able to get a response with more reasonable values, as demonstrated in the screenshot below.
Now the mock response looks more reasonable.
With the mock APIs, our frontend developers will be able to start building UI components without waiting for the backend to be completed. Also, as shown above, a mock API responds instantly, unlike real APIs that depend on database queries, authentication, or network latency. This makes UI development and unit testing faster.
Speaking of testing, some test cases are difficult to create with a real API. For example, what if an API returns an error (500 Internal Server Error)? What if there are thousands of travel packages? With a mock API, we can control the responses and simulate rare cases easily.
For example, our travel package API allows admins to see all packages, including unpublished ones, while regular users only see public packages. We thus can setup in such a way that different bearer token will return different set of mock data.
We are setting up the endpoint to return drafts when a correct admin token is provided in the request header with Mock Expectation.
With Mock Expectation feature, Apidog can return custom responses based on request parameters as well. For instance, it can return normal packages when the destinationId is 1 and trigger an error when the destinationId is 2.
API Design Journey 03: Documenting Phase
With endpoints designed properly in earlier two phases, we can now proceed to create documentation which is offers a detailed explanation of the endpoints in our API. This documentation will include the information such as HTTP methods, request parameters, and response formats.
Fortunately, Apidog makes the documentation process smooth by integrating well within the API ecosystem. It also makes sharing easy, letting us export the documentation in formats like OpenAPI, HTML, and Markdown.
Apidog can export API spec in formats like OpenAPI, HTML, and Markdown.
We can also export our documentation on folder basis to OpenAPI Specification in Overview, as shown below.
Custom export configuration for OpenAPI Specification.
We can also export the data as an offline document. Just click on the “Open URL” or “Permalink” button to view the raw JSON/YAML content directly in the Internet browser. We then can place the raw content into the Swagger Editor to view the Swagger UI of our API, as demonstrated in the following screenshot.
The exported content from Apidog can be imported to Swagger Editor directly.
Let’s say now we need to share the documentation with our team, stakeholders, or even the public. Our documentation thus needs to be accessible and easy to navigate. That is where exporting to HTML or Markdown comes in handy.
Documentation is Markdown format, generated by Apidog.
Finally, Apidog also allows us to conveniently publish our API documentation as a webpage. There are two options: Quick Share, for sharing parts of the docs with collaborators, and Publish Docs, for making the full documentation publicly available.
Quick Share is great for API collaborators because we can set a password for access and define an expiration time for the shared documentation. If no expiration is set, the link stays active indefinitely.
API spec presented as a website and accessible by the collaborators. It also enables collaborators to generate client code for different languages.
API Design Journey 04: The Development Phase
With our API fully designed, mocked, and documented, it is time to bring it to life with actual code. Since we have already defined information such as the endpoints, request format, and response formats, implementation becomes much more straightforward. Now, let’s start building the backend to match our API specifications.
Orchard Core generally supports two main approaches for designing APIs, i.e. Headless and Decoupled.
In the headless approach, Orchard Core acts purely as a backend CMS, exposing content via APIs without a frontend. The frontend is built separately.
In the decoupled approach, Orchard Core still provides APIs like in the headless approach, but it also serves some frontend rendering. It is a hybrid approach because we use Razor Pages some parts of the UI are rendered by Orchard, while others rely on APIs.
So in fact, we can combine the good of both approaches so that we can build a customised headless APIs on Orchard Core using services like IOrchardHelper to fetch content dynamically and IContentManager to allow us full CRUD operations on content items. This is in fact the approach mentioned in the Orchard Core Basics Companion (OCBC) documentation.
For the endpoint of getting a list of travel packages, i.e. /api/v1/packages, we can define it as follows.
[ApiController]
[Route("api/v1/packages")]
public class PackageController(
    IOrchardHelper orchard,
    ...) : Controller
{
    [HttpGet]
    public async Task<IActionResult> GetTravelPackages()
    {
        var travelPackages = await orchard.QueryContentItemsAsync(q =>
            q.Where(c => c.ContentType == "TravelPackage"));

        ...

        return Ok(travelPackages);
    }

    ...
}
In the code above, we are using Orchard Core Headless CMS API and leveraging IOrchardHelper to query content items of type “TravelPackage”. We are then exposing a REST API (GET /api/v1/packages) that returns all travel packages stored as content items in the Orchard Core CMS.
API Design Journey 05: Testing of Actual Implementation
Let’s assume our Dev Server Base URL is localhost. This URL is set as a variable in the Develop Env, as shown in the screenshot below.
Setting Base URL for Develop Env on Apidog.
With the environment setup, we can now proceed to run our endpoint under that environment. As shown in the following screenshot, we are able to immediately validate the implementation of our endpoint.
Validated the GET endpoint under Develop Env.
The screenshot above shows that through API Validation Testing, the implementation of that endpoint has met all expected requirements.
API validation tests are not just for simple checks. The feature is great for handling complex, multi-step API workflows too. With them, we can chain multiple requests together, simulate real-world scenarios, and even run the same requests with different test data. This makes it easier to catch issues early and keep our API running smoothly.
Populate testing steps based on our API spec in Apidog.
In addition, we can also set up Scheduled Tasks, which is still in Beta now, to automatically run our test scenarios at specific times. This helps us monitor API performance, catch issues early, and ensure everything works as expected automatically. Plus, we can review the execution results to stay on top of any failures.
Result of running one of the endpoints on Develop Env.
Wrap-Up
Throughout this article, we have walked through the process of designing, mocking, documenting, implementing, and testing a headless API in Orchard Core using Apidog. By following an API-first approach, we ensure that our API is well-structured, easy to maintain, and developer-friendly.
With this approach, teams can collaborate more effectively, reduce friction in development. Now that the foundation is set, the next step could be integrating this API into a frontend app, optimising our API performance, or automating even more tests.
Finally, with .NET 9 moving away from built-in Swagger UI, developers now have to find alternatives to set up API documentation. As we can see, Apidog offers a powerful alternative, because it combines API design, testing, and documentation in one tool. It simplifies collaboration while ensuring a smooth API-first design approach.