Visual Studio Online (VSO) is a Team Foundation Server (TFS) hosted on the Microsoft Azure and offered as software development team collaboration tool that works with popular IDEs like Visual Studio and Eclipse.
In my team, we are sharing our codes on Visual Studio Online (VSO) using a Git repository.
I actually would like to share the stories about how my team works with VSO and Git. However, due to the fact that our codes are not supposed to be shown to the public, so I decide to not write anything about it. Thus, I am just going to share a few VSO-related tutorials that I found useful.
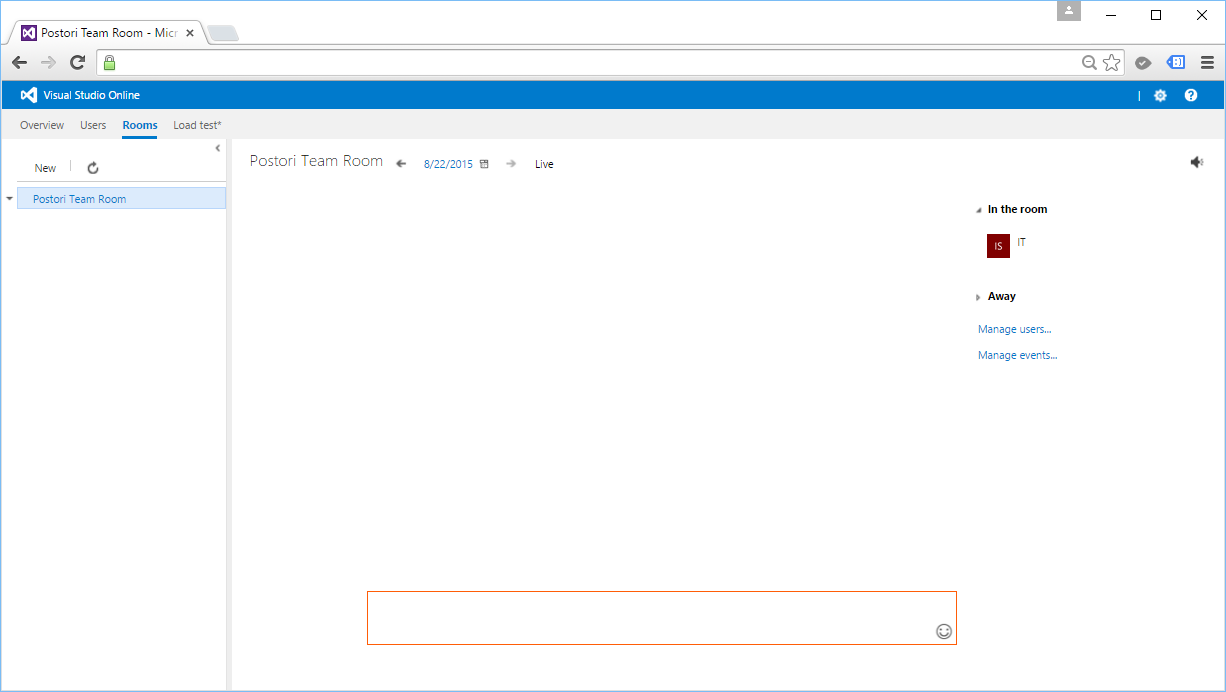
Another feature that we have tried is Team Room. Currently, we are already using Skype and Whatsapp. So, we don’t use Team Room in the end because we don’t want to trouble ourselves just to have another way of communicating with each other. We are just a team of 4-5 programmers anyway. =)
After deploying our web application, it’s not the end of the story. There are still many tasks to do. One of them is to analyze and optimize our new website. Normally, I start with testing my website in Google PageSpeed Insights to understand about the website performance issues.
Oops, my new website only gets 57/100.
Unfortunately, as shown in the screenshot above, my new website seems having a poor performance. Before finding out the ways to improve the performance, I would like to share what the 3 passed rules are.
Yup, the first thing that affects our web page loading is of course the server response speed. Google recommended to keep the server response time under 200ms.
My homepage loads about 600ms but PageSpeed Insights still let me pass. =)
Redirects will increase the loading time of the web page because there will be more HTTP request-response cycle.
In the old days when responsive design was still not popular, redirect is the way we used to bring users from desktop view to the mobile view of our website. So, when users first came in from “www.example.com”, they would be brought to “www.example.com/mobile/index.aspx”.
However, sometimes we still need to do redirects in our website, especially when we have a new web page to replace the old one. We may do redirects also when we are changing the domain name of our website.
301 (Permanent Redirect): The requested resource has been assigned a new permanent URI and any future references to the resource should be done using the new URI;
302 (Temporary Redirect): The requested resource resides temporarily under different URI.
One of the key principles of prioritizing visible content is to make sure the above-the-fold content is able to be loaded first.
What does “Above-the-fold Content” (ATF) mean? I found some very interesting explanation about it. ATF Content typically means the content above where the newspaper is folded horizontally. In web design context, ATF Content refers to any content we immediately see without scrolling when the page is first loaded.
Hence, in order to make sure ATF Content to be loaded first, we must have an inline part of the CSS which is responsible for styling the ATF Content.
By default, Bundling will select “.min” file for release when both “style1.css” and “style1.min.css” exist. In debug mode, then it will select non-“.min” version. This is important because Bundling seems to have problem with bootstrap.css.
/* Minification failed. Returning unminified contents.
    (3272,1): run-time error CSS1019: Unexpected token, found '@import'
    (3272,9): run-time error CSS1019: Unexpected token, found 'url("https://fonts.googleapis.com/css?family=Roboto:300,400,500,700")'
    (3278,83211): run-time error CSS1019: Unexpected token, found '@-webkit-keyframes'
    (3278,83255): run-time error CSS1035: Expected colon, found '{'
    (3278,83406): run-time error CSS1019: Unexpected token, found '@keyframes'
    ...
    (3672,3): run-time error CSS1062: Expected semicolon or closing curly-brace, found '0%'
    (4246,11): run-time error CSS1036: Expected expression, found ';'
*/
So one of the solutions suggested on Stack Overflow is to include both bootstrap.css and bootstrap.min.css in the same “Content” folder so that Bundling+Minification will not try (and then fail) to minify bootstrap.css itself. Instead, it will just pickup the existing bootstrap.min.css. However, we don’t need to change anything to the C# code above, so it still looks the same.
One disadvantage of doing so is that if there is any changes done to the bootstrap.css, we have to manually minify it and update the bootstrap.min.css because Minification will not do minification for us but it will just pickup the bootstrap.min.css.
For JavaScript, we will do the same to add multiple JS files into the bundle.
The {version} wildcard above will automatically pick the appropriate version of jQuery available in the “Scripts” folder. Hence, we can happily use NuGet to update jQuery to a newer version without changing our C# code.
In the ASP .NET MVC template, there are actually two JavaScript bundles, “~/bundles/jquery” and “~/bundles/jqueryval”. The reason of doing Bundle Partitioning is to make sure the page doesn’t get the resources that it doesn’t need.
Minify HTML
To minify HTML and Razor views, there are a few options.
Another one is using ASP .NET HTML Minifier which can be included as part of the build process so that the files are minified before being deployed in Visual Studio. The simple command tool is open source and the project can be found on Github.
It’s great that nowadays all the modern browsers support and automatically negotiate Gzip compression for all HTTP requests. Hence, enabling Gzip compression is able to reduce the size of transferred response.
Fetching resources over the network is slow. Hence, it is always a good idea to cache our static resources by setting an expiry date in the HTTP headers for static resources.
When a role instance is brought online by Windows Azure, the OnStart method will be called and the role instance will be marked as Busy. Azure Load Balancer thus will not direct traffic to the role instance. Hence, having more than one role instance actually help on keeping the website accessible while deploying new code to the site.
If we are going to use load balancing in our ASP .NET web applications, Session State can no longer be kept in memory of an instance. Instead, the Sessions need to be stored in SQL Server or State Server. Those are the three popular Session-State Modes available, i.e. InProc, SQLServer, and StateServer.
Now, with Azure Redis Cache, we can use the 4th option, the Custom mode, to store Session State values.
First of all, we need to download RedisSessionStateProvider from Nuget so that all necessary assembly references will be added automatically to our web application project. In addition, there will be new lines added to web.config, as shown below, to help us get started with Redis Cache Session State Provider.
As shown in the commented section, we need to provide values to a few attributes before we can use the Redis Cache. Those values can be easily found on the new Azure Preview Portal. So, a complete configuration should be as follows.
Yup, that’s all. We can now happily use Redis Cache Session State Provider to make Session variables works well with the load balancing in our web applications. =)
For more information about Redis Cache Session State Provider, please read its documentation.
As a developer working on web applications deployed on the cloud, I am always asked to make sure the applications are always up and running. Hence, it is very important to understand some of the diagnostics resources available for Azure.
Logs
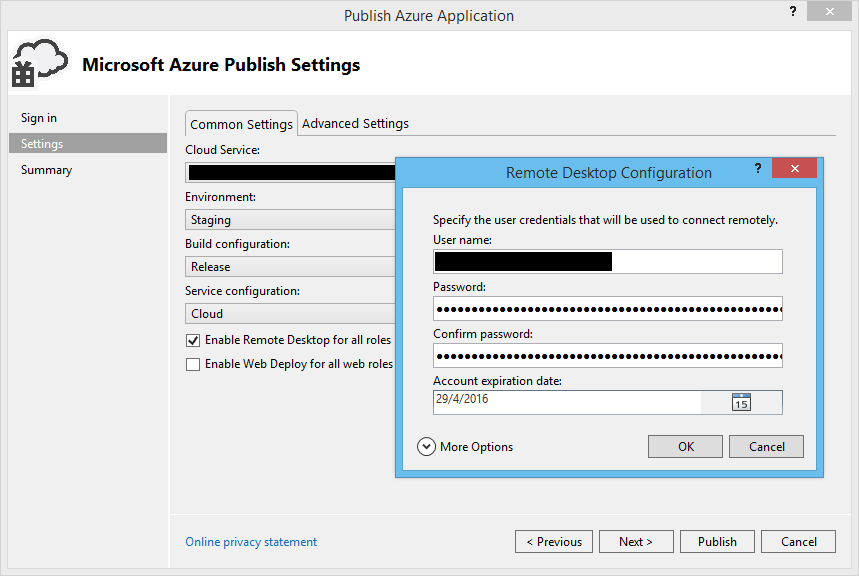
The first thing that comes to my mind is reading the Event Logs and IIS Logs in the VMs. To allow this, we first need to enable Remote Desktop for all roles.
You can enable Remote Desktop for all roles before publish.
This approach should be familiar for those who are using on-premise. So, where to find the log files?
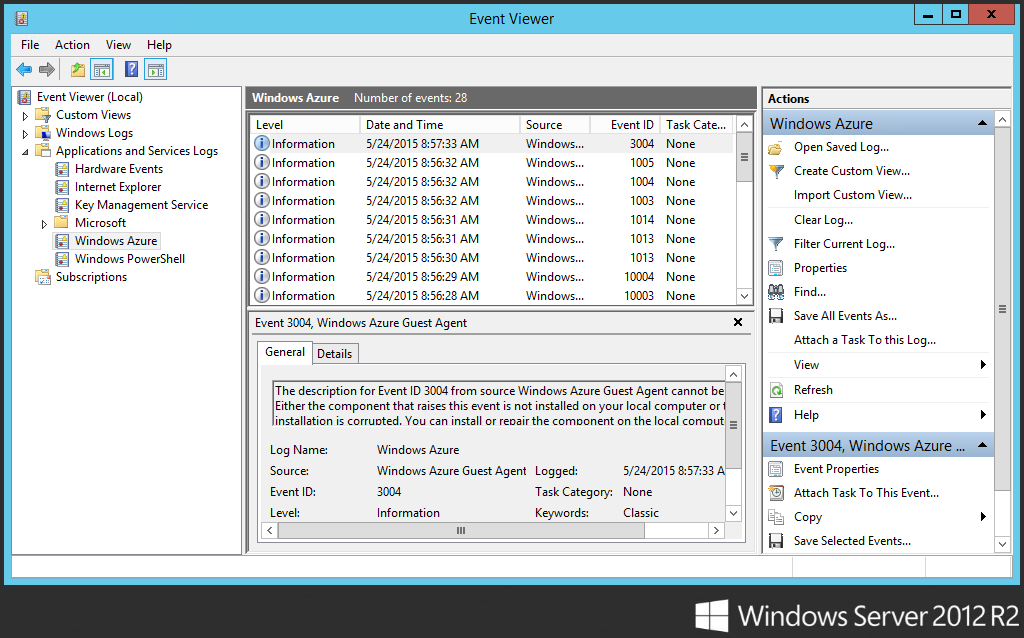
Azure Event Logs: Diagnostic output from the Windows Azure Runtime, including information such as role start/stop, startup tasks, crashes, recycles, etc.
Location of Azure Event Logs
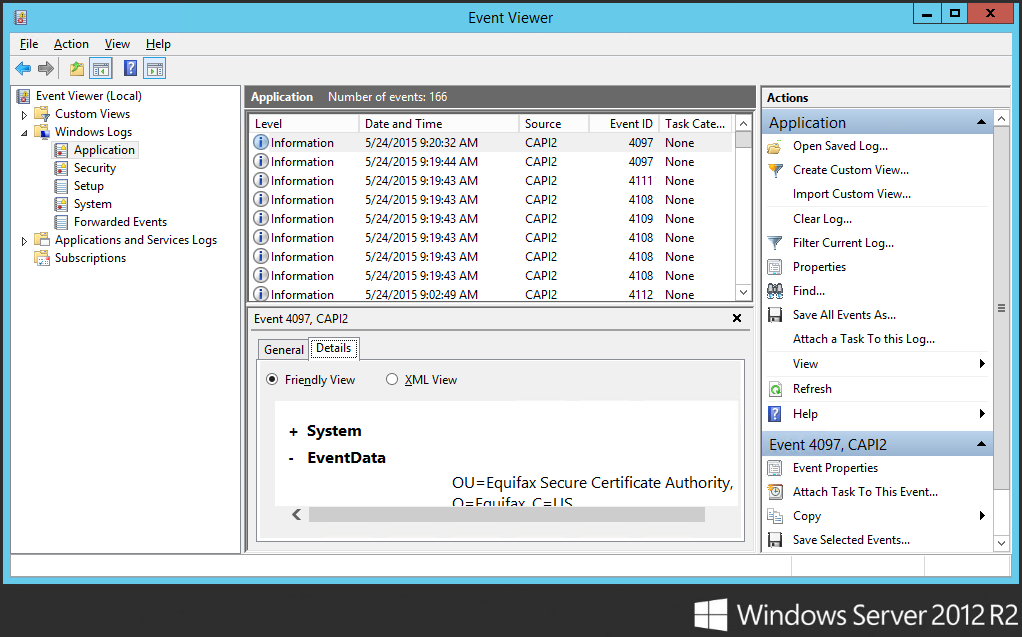
Application Event Logs: Often can find w3wp.exe (a process associated with the application pool in IIS) related errors here.
Location of Application event logs.
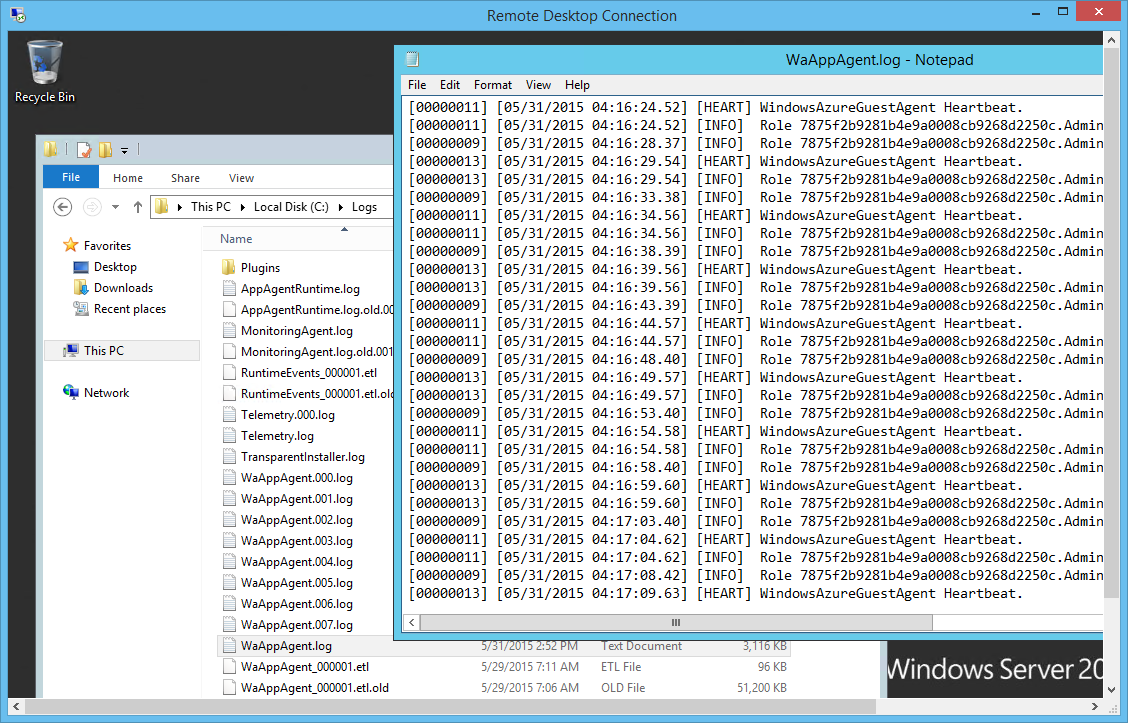
App Agent HeartBeat Logs: Useful for determining the current state of the role within the VM. It can be used to find out the health status of the role in the past as well. These logs are generated by WindowsAzureGuestAgent.exe.
Location of App Agent Heartbeat logs.
When I viewed the App Agent Heartbeat logs two hours after my website went down, I saw the following records in the file.
[00000011] [06/19/2015 05:59:43.37] [HEART] WindowsAzureGuestAgent Heartbeat.
[00000011] [06/19/2015 05:59:43.37] [INFO] Generating substatus from system events.
[00000011] [06/19/2015 05:59:43.37] [INFO] Substatus is Sites are being deployed. [2015-06-19T05:59:42Z]
[00000011] [06/19/2015 05:59:43.37] [INFO] Role 1234f2b2986b4e9a1234cc9268d2250c.MyWebRole_IN_0 isreporting state NotReady with sub-status Starting and details Starting role... Sites are being deployed. [2015-06-19T05:59:42Z].
[00000008] [06/19/2015 05:59:46.64] [INFO] Role 1234f2b2986b4e9a1234cc9268d2250c.MyWebRole_IN_0 has current state Unhealthy, desired state Started, and goal state execution status StartInProgress.
After my website went back online, then I found the following records which marked the role to be healthy then.
[00000011] [06/19/2015 06:00:03.70] [HEART] WindowsAzureGuestAgent Heartbeat.
[00000011] [06/19/2015 06:00:03.70] [INFO] Role 1234f2b2986b4e9a1234cc9268d2250c.MyWebRole_IN_0 is reporting state Ready.
[00000008] [06/19/2015 06:00:06.89] [INFO] Role 1234f2b2986b4e9a1234cc9268d2250c.MyWebRole_IN_0 has current state Started, desired state Started, and goal state execution status StartSucceeded.
App Agent Runtime Logs: If you would like to get an overview of the events happening over time to a role, you can refer to AppAgentRuntime.log in C:\Logs which logs major changes to the role without logging heartbeats.
IIS Logs: To determine whether a problem is caused by the website itself or comes from Azure, it is always good to check the IIS logs first.
Location of IIS logs: C:\Resources\Directory\{DeploymentID}.{Rolename}.DiagnosticStore\LogFiles\Web
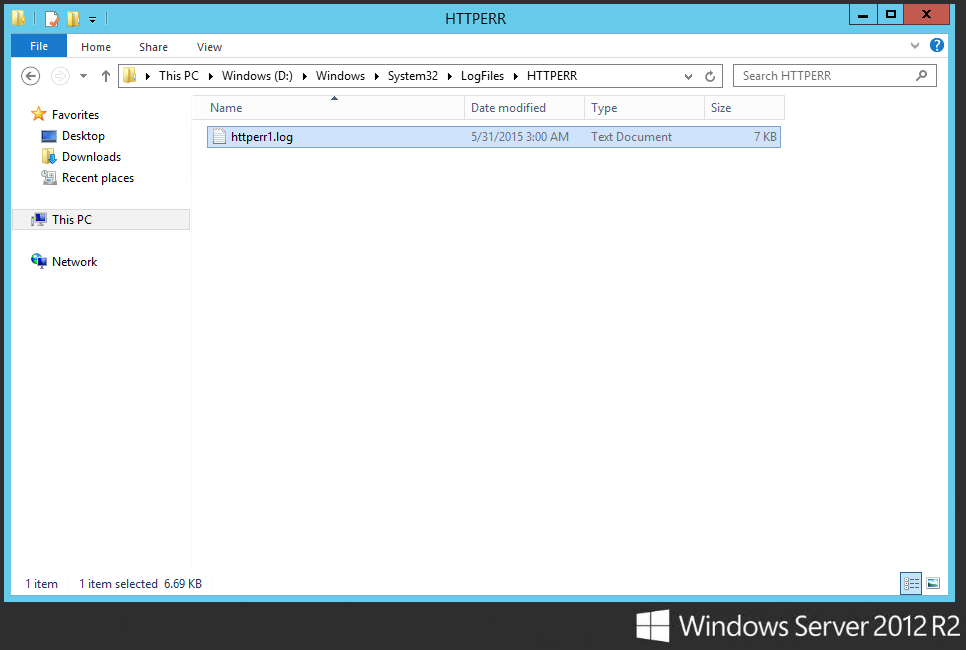
HTTP.SYS Logs: Very important to troubleshoot an issue with a hosted service website not responding. The evidence of, for example, IIS not being able to process the high-volume requests can be found in HTTP.SYS logs.
HTTP.SYS logs can be found here!
Monitoring ASP .NET Web Application with Application Insights
If you would like to have a graphical dashboard with diagrams showing availability, performance, usage, failures, and other events happening on your web apps, please try out Application Insights too.
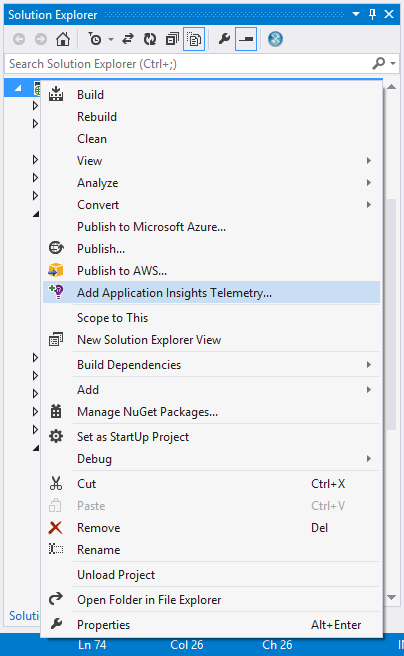
The reason I like it very much because with Visual Studio 2013, Application Insights can be added to the application with just a few clicks.
Just right click your project in Solution Explorer and choose “Add Application Insights Telemetry”.
After Application Insights is successfully added, the ApplicationInsights.config file with an instrumentation key will be added to your project.
However, by doing this, Visual Studio will not add the JavaScript SDK to the web pages of the project. If you are interested to know more about load time and user events, you can proceed to add it. After the JavaScript SDK is successfully added, you should be able to see the following lines of codes in your web pages.
    var appInsights=window.appInsights||function(config){
    function s(config){...}({instrumentationKey:"02gh149f-3ce6-47cf-b49a-6efg14d83928"});

     window.appInsights=appInsights;
     appInsights.trackPageView();
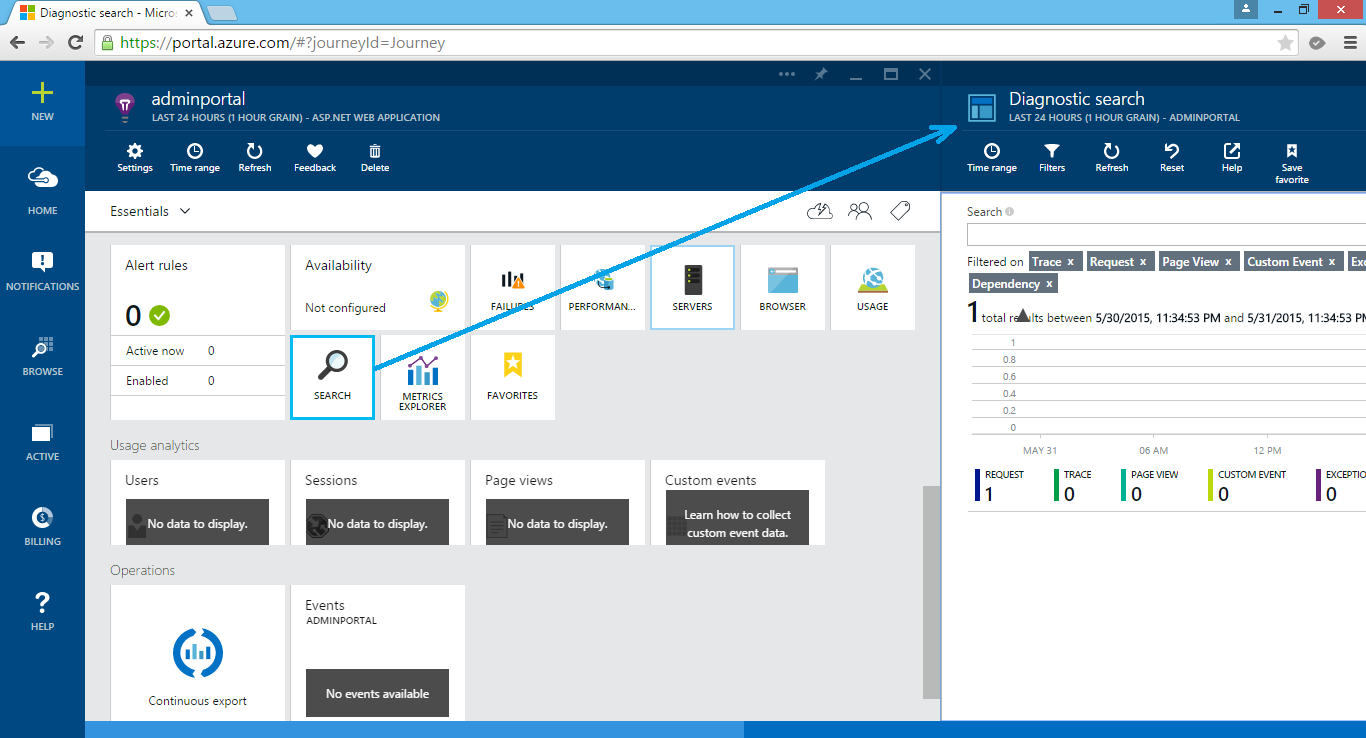
Now, if you right-click on the same project again, you will be able to launch the Application Insights of the project in the new Azure portal.
Application Insights on Azure.
Yup, let’s start improving our web applications based on these useful insights and reports. =)