Building a Healthcare Dashboard with FAST Framework and Azure API for FHIR

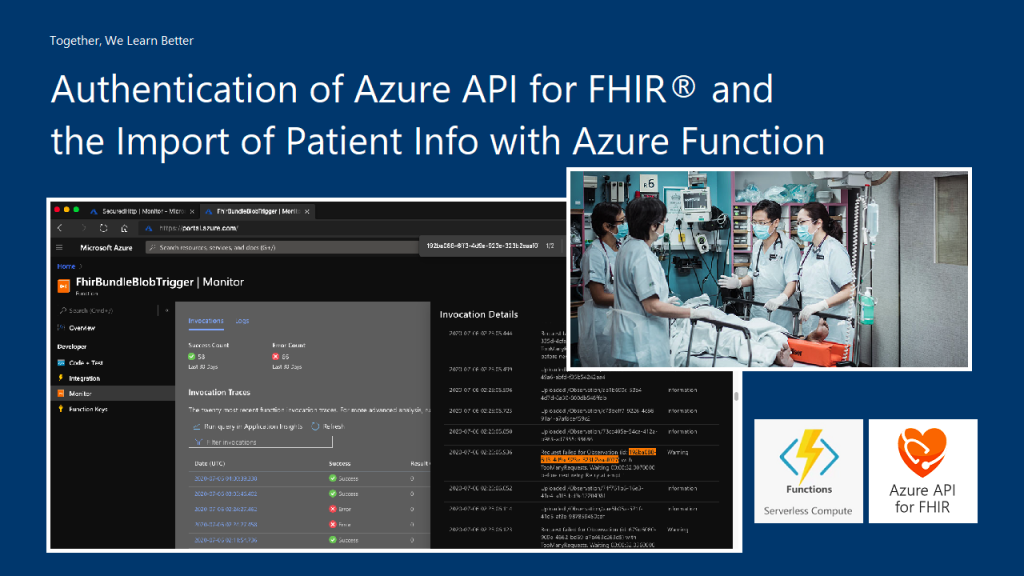
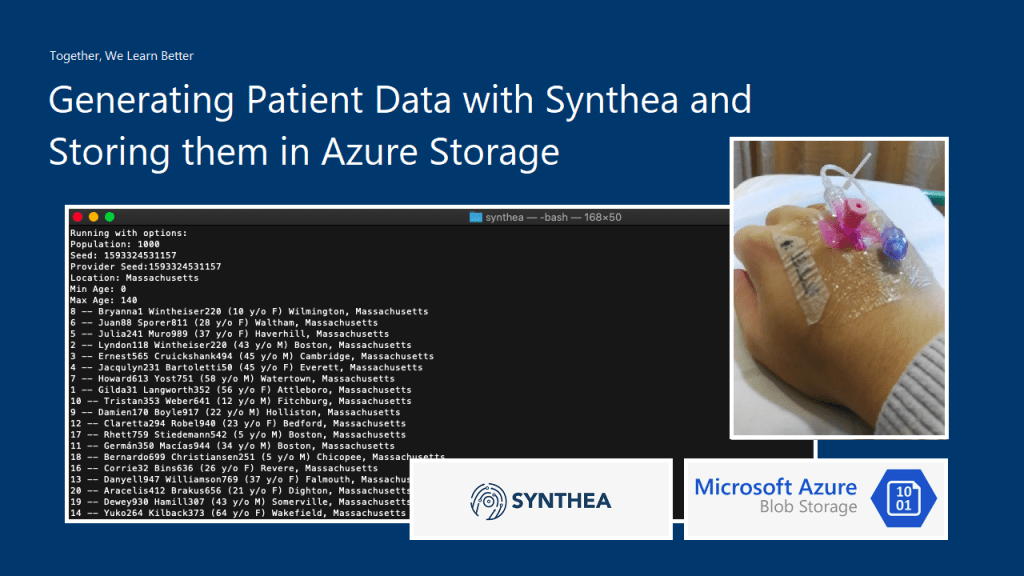
In our previous article, we have successfully imported realistic but not real patient data into the database in our Azure API for FHIR. Hence, the next step we would like to go through in this article is how to write a user-friendly dashboard to show those healthcare data.

For frontend, there are currently many open-source web frontend frameworks for us to choose from. For example, in our earlier project of doing COVID-19 dashboard, we used the Material Design from Google.

In this project, in order to make our healthcare dashboard to be consistent with other Microsoft web apps, we will be following Microsoft design system.

For the backend of the dashboard, we will be using ASP .NET Core 3.1 because even though Michael Hansen provided a sample on GitHub about how to write client app to consume Azure API for FHIR, it is a JavaScript app. So I think another sample on how to do it with ASP .NET Core will be helpful to other developers as well.

🎨 The architecture of the system we are going to setup in this article. 🎨

FAST Framework and Web Components

Last week on 7th July, Rob Eisenberg from Microsoft introduced the FAST Framework during the .NET Community Standup. The FAST Framework, where FAST stands for Functional, Adaptive, Secure, and Timeless, is an adaptive interface system for modern web experiences.

In web app development projects, we always come to situations where we need to add a button, a dropdown, a checkbox to our web apps. If we are working in a large team, then issues like UI consistency across different web apps which might be built using different frontend frameworks are problems that we need to solve. So what FAST Framework excites me is solving the problem with Web Components that can be used with any different frontend frameworks.

🎨 Rob Eisenberg’s (left most) first appearance on Jon Galloway’s (right most) .NET Community Standup with Daniel Roth (top most) and Steve Sanderson from the Blazor team. (Source: YouTube) 🎨

All modern browsers now support Web Components. The term Web Components basically refers to a suite of different technologies allowing us to create reusable custom elements — with their functionality encapsulated away from the rest of our code — and utilise them in our web apps. Hence, using Web Components in our web app increases reusability, testability, and reliability in our codes.

Web Components can be integrated well with major frontend frameworks, such as Angular, Blazor, Vue, etc. We can drop Web Components easily to ASP .NET web projects too and we are going to do that in our healthcare dashboard project.

FAST Design System Provider

Another cool thing in FAST Framework is that it comes with a component known as the Design System Provider which provides us a convenient mechanisms to surface the design system values to UI components and change values where desired.

In the FAST Framework, the Web Component that corresponds to the design system provider is called the FASTDesignSystemProvider. Its design system properties can be easily overridden by just setting the value of the corresponding property in the provider. For example, by simply changing the background of the FASTDesignSystemProvider from light to dark, it will automatically switch from the light mode to the dark mode where corresponding colour scheme will be applied.

🎨 FAST Framework allows our web apps to easily switch between light and dark modes. 🎨

UI Fabric and Fluent UI Core

In August 2015, Microsoft released the GA of Office UI Fabric on GitHub. The goal of having Office UI Fabric is to provide the frontend developers a mobile-first responsive frontend framework, similar like Bootstrap, to create the web experiences.

The Office UI Fabric speaks the Office Design Language. As long as you use any Office-powered web app, such as Outlook or OneDrive, the Office web layout should be very familiar to you. So by using the Office UI Fabric, we can easily make our web apps to have Office-like user interface and user experience.

🎨 OneDrive web with the Office design. 🎨

In order to deliver a more coherent and productive experience, Microsoft later released Fluent Framework, another cross-platform design system. Also, to move towards the goal of simplified developer ecosystem, Office UI Fabric later evolved into Fluent UI as well in March 2020.

Fluent UI can be used in both web and mobile apps. For web platform, it comes with two options, i.e. Fabric UI React and Fabric Core.

Fabric UI React is meant for React application while Fabric Core is provided primarily for non-React web apps or static web pages. Since our healthcare dashboard will be built on top of ASP .NET Core 3.1, Fabric Core is sufficient in our project.

However, due to some components, such as ms-Navbar and ms-Table, are still only available in Office UI Fabric but not the Fabric Core, our healthcare dashboard will use both the CSS libraries.

Azure CDN

A CDN (Content Delivery Network) is a distributed network of servers that work together to provide fast delivery of the Internet content. Normally, they are distributed across the globe so that the content can be accessed by the users based on their geographic locations so that users around the world can view the same high-quality content without slow loading time. Hence, it is normally recommended to use CDN to serve all our static files.

Another reason of us not to host static files in our web servers is that we would like to avoid extra HTTP requests to our web servers just to load only the static files such as images and CSS.

Fortunately, Azure has a service called Azure CDN which will be able to offer us a global CDN to store cached content on edge servers in the point-of-presence locations that are close to end users, to minimise latency.

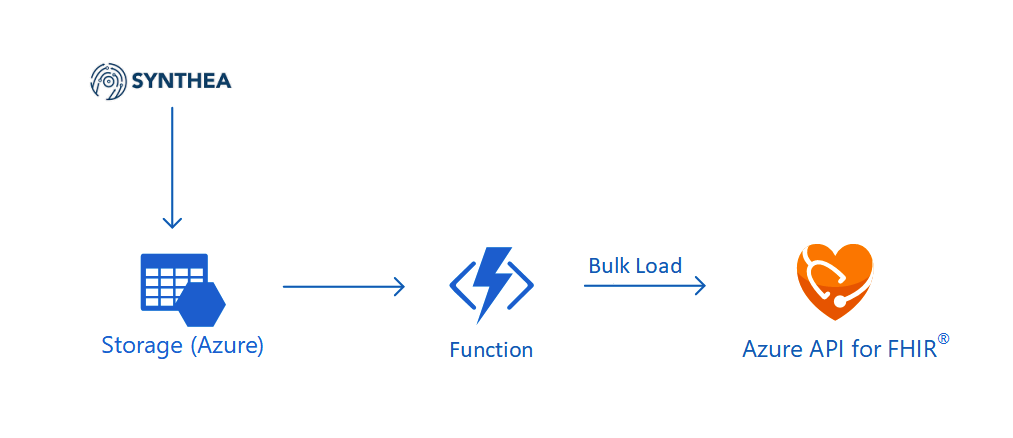
To use Azure CDN, firstly, we need to store all the necessary static files in the container of our Storage account. We will be using back the same Storage account that we are using to store the realistic but not real patient data generated by Synthea(TM).

Secondly, we proceed to create Azure CDN.

Thirdly, we add an endpoint to the Azure CDN, as shown in the following screenshot, to point to the container that stores all our static files.

🎨 The origin path of the CDN endpoint is pointing to the container storing the static files. 🎨

Finally, we can access the static files with the Azure CDN endpoint. For example, to get the Office Fabric UI css, we will use the following URL.

https://lunar-website-statics.azureedge.net/fabric.min.css

There is already a very clear quick-start tutorial on Microsoft Docs that you can refer to if you are interested to find out more about the integration of Azure CDN with Azure Storage.

Options Pattern in ASP .NET Core

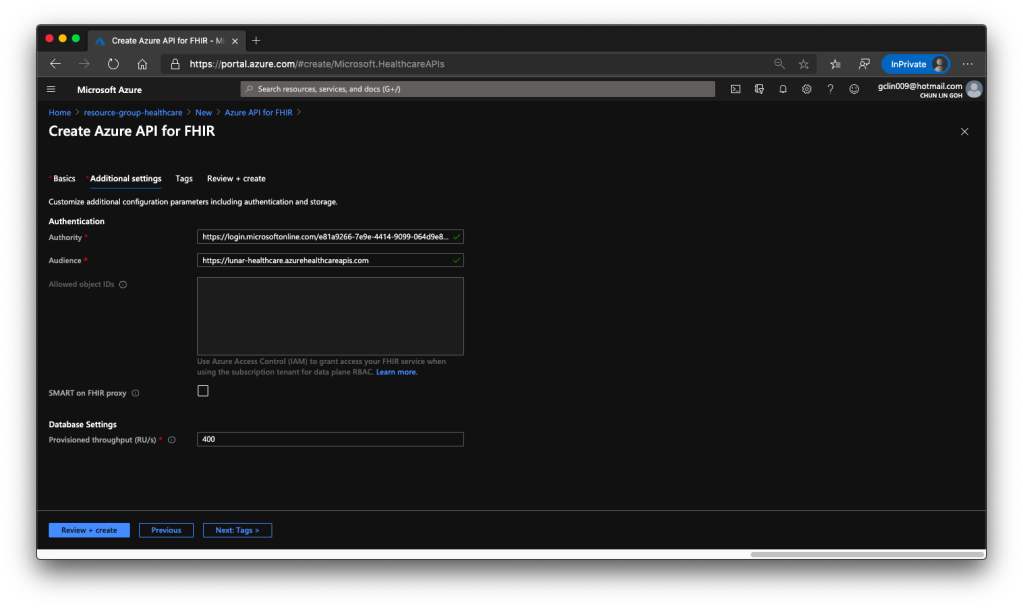
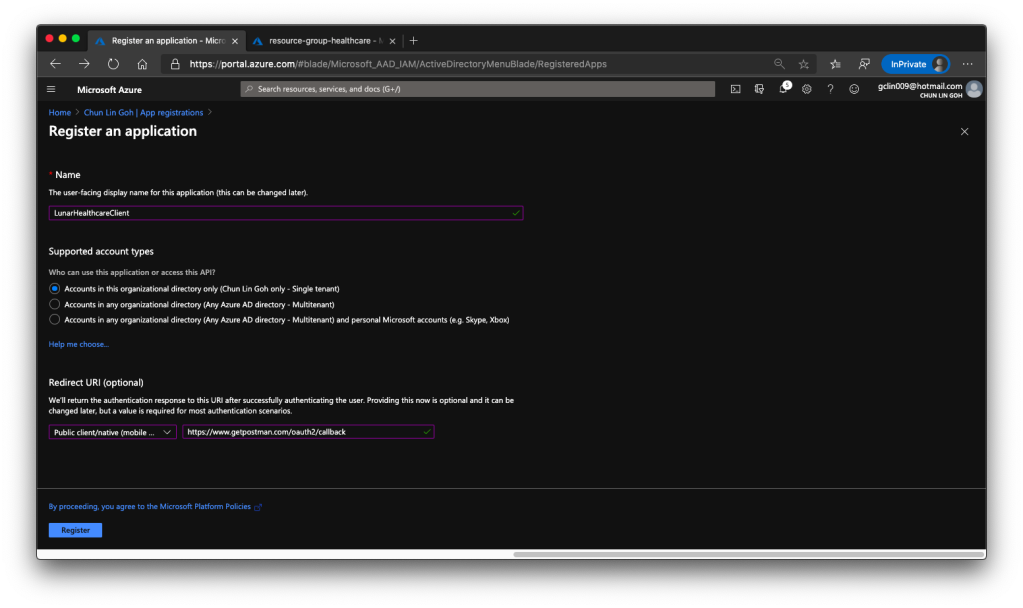
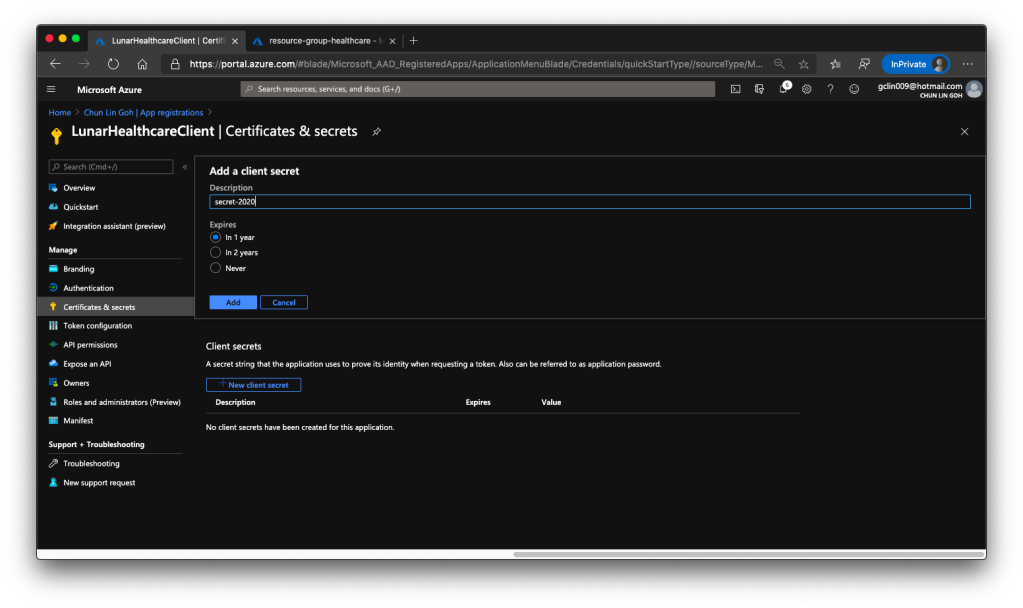
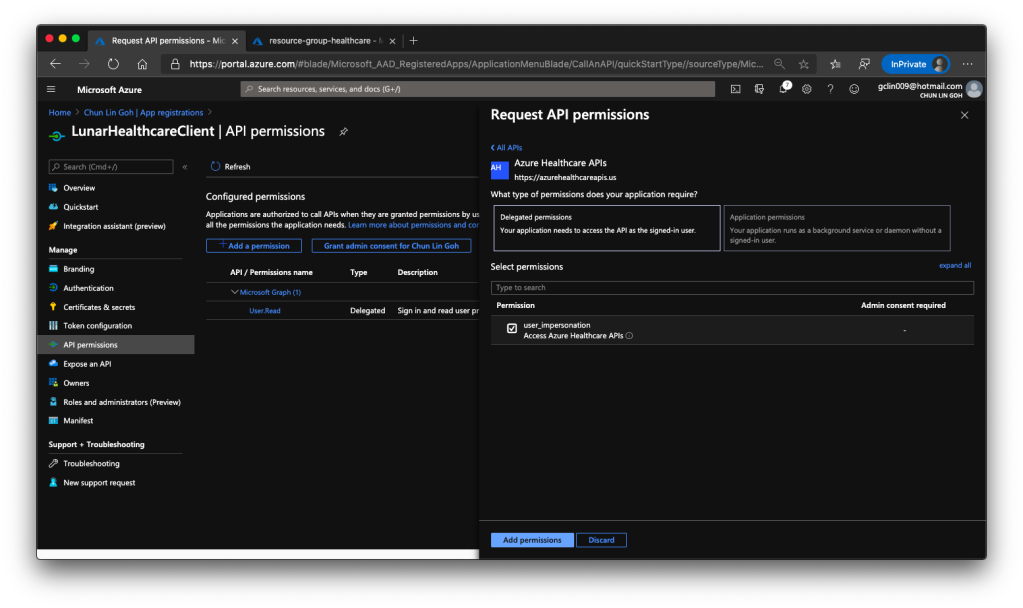
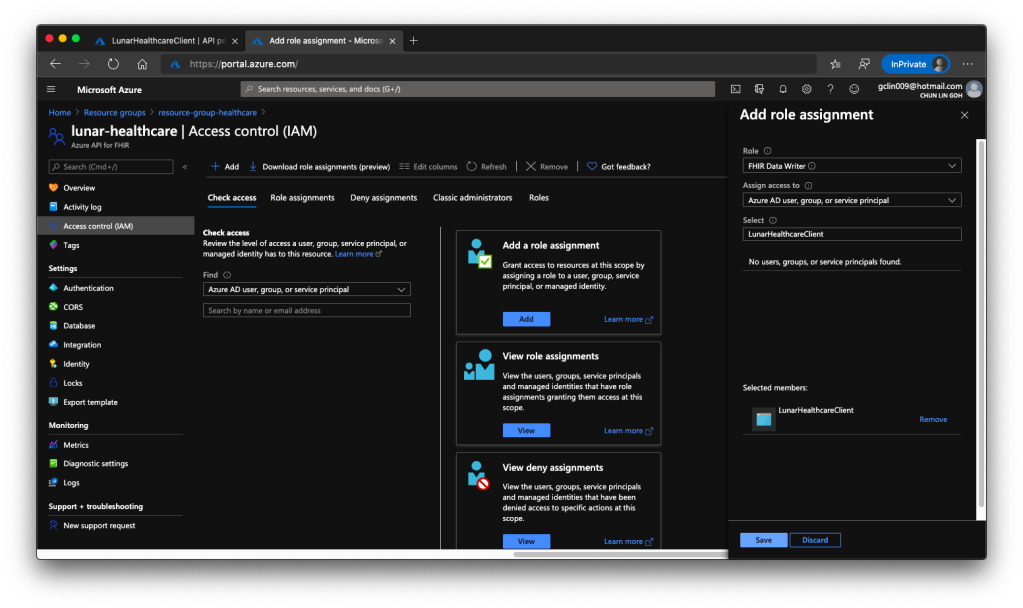
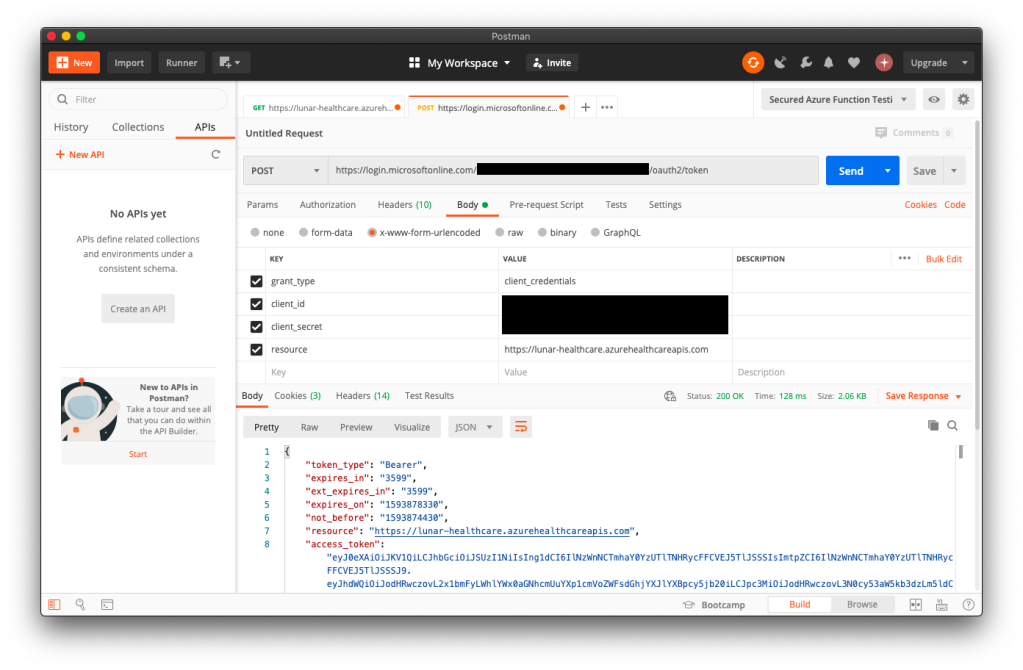
Similar as the Azure Function we deployed in the previous article, we will send GET request to different endpoints in the Azure API for FHIR to request for different resources. However, before we are able to do that, we need to get Access Token from the Azure Active Directory first. The steps to do so have been summarised in the same previous article as well.

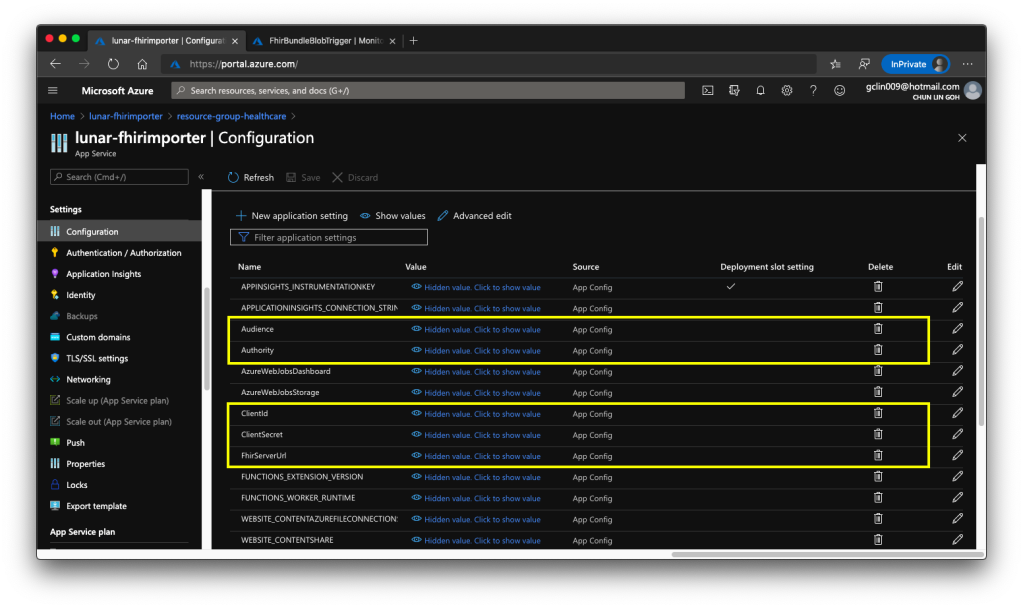
Since we need application settings such as Authority, Audience, Client ID, and Client Secret to retrieve the access token, we will store them in appsettings.Development.json for local debugging purpose. When we later deploy the dashboard web app to Azure Web App, we will store the settings in the Application Settings.

Then instead of reading from the setting file directly using the IConfiguration, here we would choose to use Options pattern which enable us to provide strongly typed access to groups of related settings and thus provide also a mechanism to validate the configuration data. For example, the settings we have in our appsettings.Development.json is as follows.

{ 
    "Logging": { 
        ...
    }, 
    "AzureApiForFhirSetting": { 
        "Authority": "...", 
        "Audience": "...", 
        "ClientId": "...", 
        "ClientSecret": "..." 
    }, 
    ...
}

We will then create a class which will be used to bind to the AzureApiForFhirSettings.

public class AzureApiForFhirSetting { 
    public string Authority { get; set; }
    public string Audience { get; set; }
    public string ClientId { get; set; }
    public string ClientSecret { get; set; } 
}

Finally, to setup the binding, we will need to add the following line in Startup.cs.

// This method gets called by the runtime. Use this method to add services to the container. 
public void ConfigureServices(IServiceCollection services) 
{ 
    services.AddOptions();
    services.Configure<AzureApiForFhirSetting>(Configuration.GetSection("AzureApiForFhirSetting")); 
    ...
    services.AddControllersWithViews(); 
}

After that, we will apply dependency injection of IOption to the classes that we need to use the configuration, as shown in the following example.

public class AzureApiForFhirService : IAzureApiForFhirService 
{ 
    private readonly AzureApiForFhirSetting _azureApiForFhirSetting; 

    public AzureApiForFhirService(IOptions<AzureApiForFhirSetting> azureApiForFhirSettingAccessor) 
    { 
        _azureApiForFhirSetting = azureApiForFhirSettingAccessor.Value; 
    }

    ...
}

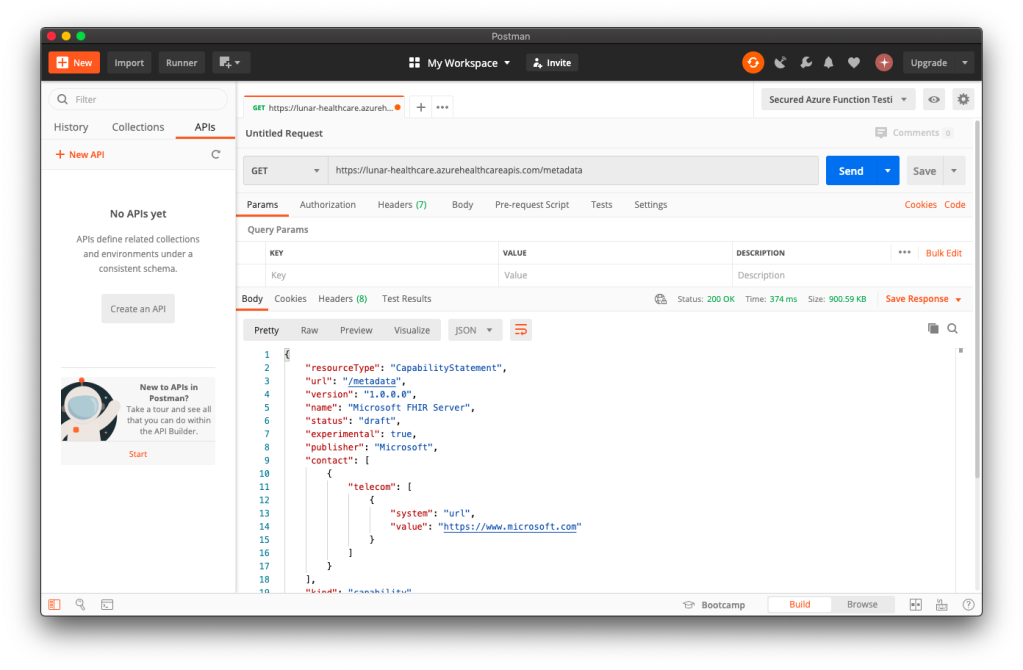
Once we can get the access token, we will be able to access the Azure API for FHIR. Let’s see some of the endpoints the API has.

Azure API for FHIR: The Patient Endpoint

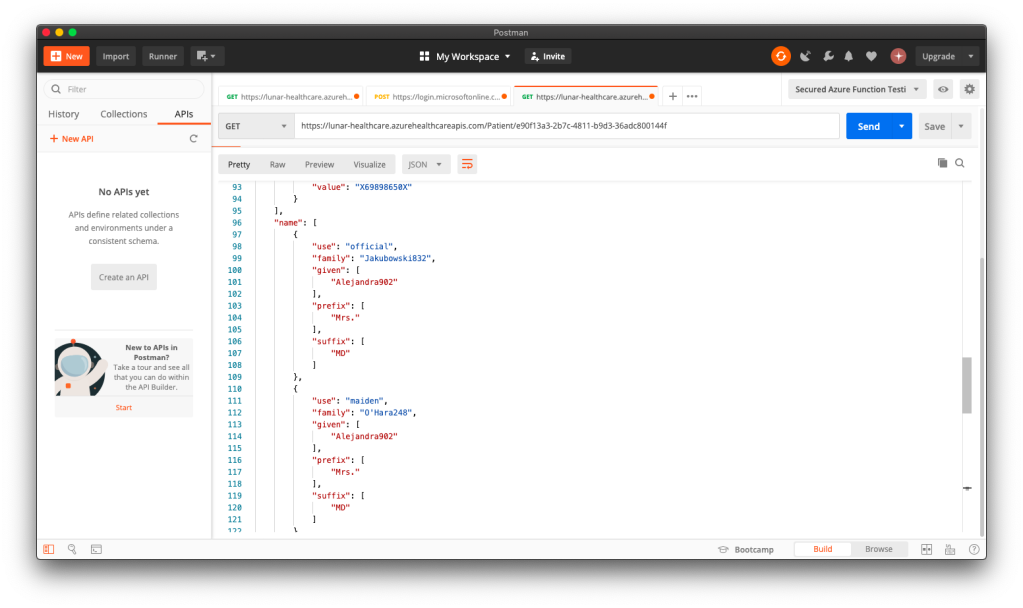
To retrieve all the patients in the database, it’s very easy. We simply need to send a GET request to the /patient endpoint. By default, the number of records returned by the API is 10 at most. To retrieve the next 10 records, we need to send another GET request to another URL link returned by the API, as highlighted in the red box in the following example screenshot.

🎨 The “self” URL is the API link for the current 10 records. 🎨

Once we have all the patients, we then can list them out in a nice table designed with Office UI Fabric, as shown in the following screenshot.

🎨 Listing all the patients in the Azure API for FHIR database. 🎨

When we click on the link “View Profile” of a record, we then can get more details about the selected patient. To retrieve the info of a particular patient, we need to pass the ID to the /patient endpoint, as shown in the following screenshot, which is highlighted in a red box.

🎨 Getting the info of a patient with his/her ID. 🎨

Where can we get the patient’s ID? The ID is returned, for example, when we get the list of all patients.

So after we click on the “View Profile”, we will then be able to reach a Patient page which shows more details about the selected patient, as shown in the following screenshot.

🎨 We can also get the address together with its geolocation data of a patient. 🎨

Azure API for FHIR: The Other Endpoints

There are many resources available in the Azure API for FHIR. Patient is one of them. Besides, we also have Condition, Encounter, Observation, and so on.

To get entries from the endpoints corresponding to the three resources listed above is quite straightforward. However, if we directly send a GET request to, let’s say, /condition, what we will get is all the Condition records of all the patients in the database.

In order to filter based on the patient, we need to add a query string called patient to the endpoint URL, for example /condition?patient=, and then we append the patient ID to the URL.

Then we will be able to retrieve the resources of that particular patient, as shown in the following screenshot.

🎨 It’s interesting to see COVID-19 test record can already be generated in Synthea. 🎨

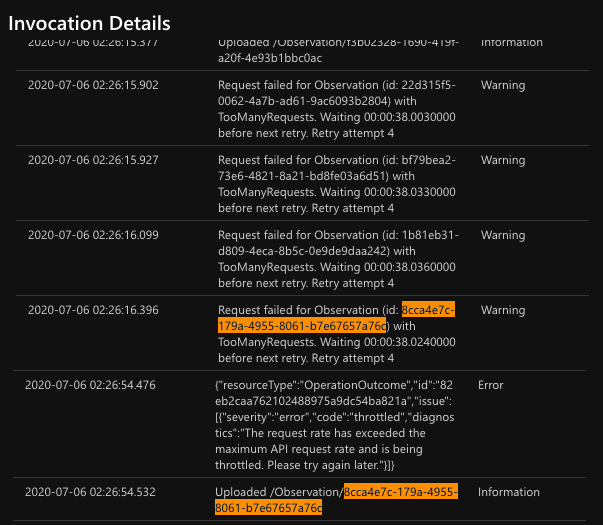
So far I have only tried the four endpoints. The /observation endpoint is very tricky because the values that it return can be most of the time a single number for a measurement. However, it will also returns two numbers or text for some other measurement. Hence, I have to do some if-else checks on the returned values from the /observation endpoint.

🎨 The SARS-Cov-2 testing result is returned as a text instead of number. 🎨

Source Code of the Dashboard

That’s all for the healthcare dashboard that I have built so far. There are still many exciting features we can expect to see after we have integrated with the Azure API for FHIR.

So, if you would like to check out my codes, the dashboard project is now available on GitHub at https://github.com/goh-chunlin/Lunar.HealthcareDashboard. Feel free to raise issue or PR to the project.

Together, we learn better.

Building COVID-19 Dashboard in Golang with Google BigQuery

It has been almost half a year since the first case relating to the COVID-19 pandemic in Singapore, the country I am now working at, was confirmed. Two days after the first case was confirmed in Singapore, eight travellers entering Malaysia, my home country, from Singapore were confirmed to be infected as well.

Since then, we were asked to work from home as travel restriction is applied in both countries. While the situation is not getting better, it’s quite disappointing to know that there are still people believing that COVID-19 is a hoax.

Fortunately, there are still a lot more people working hard in this tough period. Earlier on, my friend who is doing research in Colorado told me that she’s working hard with a group of scientists to educate the public about the virus.

🎨  People endured hours-long queues to enter Singapore from Malaysia before the travel restrictions to curb the spread of COVID-19 came into force. 🎨 

In addition, to aid the researchers and data scientists in an effort to combat the pandemic disease, Google BigQuery also decided to host a repository of public datasets from JHU CSSE (Johns Hopkins Center for Systems Science and Engineering). With the public datasets, we can now query up to 1TB for free each month on COVID-19 datasets and the queries over COVID-19 data are free (until 15th of September 2020).

In my previous article, I talked about how Google BigQuery could work together with Google Data Studio to render beautiful reports without any coding. Thus, in this article, I will show how we can write a simple web client in Golang to fetch data from the BigQuery via its API.

BigQuery Public Datasets Programme

There are a huge number of datasets hosted by Google where we can access and integrate them into our applications but Google pays for the storage. Using the public datasets, we only need to pay for the queries we perform on the data.

🎨  There are a lot of public datasets available in the GCP Marketplace. 🎨 

In order to access the public datasets, we first need to enable them through the Google BigQuery documentation (I find this to be quite funny because Google makes the enabling link to be so hidden). In the “Using the Web UI” page, as shown in the screenshot below, we can then find an URL which will let us open the public datasets project manually through browser (Remember to update the &page=project to your project in GCP).

There are also detailed steps written in the documentation of Data Analytics Products (Yes, the same info is spread all over different places).

🎨  The link to enable the public datasets in the web UI. 🎨 

The COVID-19 Dataset

Once we have done the steps above, we shall see the public datasets, including the COVID-19 datasets, available in our Google BigQuery. The dataset that I will be using in this article is the covid19_jhu_csse, a daily updated data repository for COVID-19 from JHU CSSE.

🎨  The covid19_jhu_csse dataset. 🎨 

There are four tables under the dataset where the first three recording the number of confirmed cases, the number of reported deaths, and the number of recovered cases, respectively, in each of the country or region.

The interesting about the first three tables is that they recorded the numbers of each day in a separated column. Hence, every day, there will be one new column added to three of the tables. I’m not sure why they do so but this actually requires us to write our own client in order to get the data. Google Data Studio cannot work well with dynamic column names.

🎨  A column for each of the day. 🎨 

Luckily, there is a fourth table called summary which actually has just one date column and every record for each day is one row instead of one column. This is a more SQL-friendly table and can be integrated with Google Data Studio easily.

🎨  The summary table is more SQL-friendly because the date is stored in just one column. 🎨 

In this article, I will demonstrate using 1st, 2nd, and 4th table in order to show how we can programmatically get the data through the BigQuery API.

BigQuery Client Library for Golang

There are many client libraries of Google BigQuery for different types of programming languages, including C#. In this article, we choose to use Golang.

Before we proceed, we need to make sure that we have already enabled the BigQuery API for our project in the GCP. From the GCP Cloud Console, we will get the credential which will allow us to connect to the Google BigQuery and thus we must keep this credential file in a safe and secret place.

Now we can proceed to build our Golang client.

Firstly, we need to install the client library using go get command.

go get -u cloud.google.com/go/bigquery

Secondly, we need to initialise a Google BigQuery client.

ctx := context.Background()
client, err := bigquery.NewClient(ctx, projectID)

if err != nil {
    log.Fatalf("bigquery.NewClient: %v", err)
}

defer client.Close()

Querying the Tables

Next, we can start to query the data in the BigQuery.

rows, err := queryData1(ctx, client)
if err != nil {
    log.Fatal(err) 
}

queryResult := processQueryResult1(rows)

If we have other different queries for different tables or even datasets, we can continue to query in the same way as above.

So what does queryData1 look like? It is basically as simple as follows.

func queryData1(ctx context.Context, client *bigquery.Client) (*bigquery.RowIterator, error) { 
    query := client.Query("<SQL here>")
    
    return query.Read(ctx)
}

For example, if we are fetching the date as well as numbers of confirmed cases and deaths, we will be using the the following SQL.

`SELECT 
    CAST(date as STRING) as date, 
    IFNULL(confirmed, 0) as confirmed_cases, 
    IFNULL(deaths, 0) as deaths 
FROM ` + "`bigquery-public-data.covid19_jhu_csse.summary`" + ` ORDER BY date;

There are a few things to take note here is the use of CAST.

It casts the date field to string otherwise we may encounter problems such as having error of “schema field date of type DATE is not assignable to struct field date of type time.Time” when we unmarshal the returned JSON from the BigQuery in Golang later. The reason why I choose CAST is because casting from a date type to a string is independent of time zone and is of the form YYYY-MM-DD.

In addition, we also use IFNULL to make sure that the value in the confirmed_cases and deaths are always non-negative integers. In the original tables, the numbers can be null.

Now, we just need to have a struct where we can apply RowIterator.Next() to load each row into it. The struct that corresponding to the SQL above is as follows.

type QueryResultDataRow struct { 
    Date           string `bigquery:"date"` 
    ConfirmedCases int64  `bigquery:"confirmed_cases"` 
    Deaths         int64  `bigquery:"deaths"`
}

To iterate, we can use the code below.

func processQueryResult1(iter *bigquery.RowIterator) []QueryResultDataRow { 
    var result []QueryResultDataRow

    for { 
        var row QueryResultDataRow

        err := iter.Next(&row)

        if err == iterator.Done { 
            break 
        }

        if err != nil { 
            log.Print(err) 
            continue 
        }

        result = append(result, row) 
    }
    
    return result
}

Here, I’d like to share that there was a mistake I made when I wrote the code above. I forgot that I should end the for loop when the iterator is done, i.e. when err == iterator.Done. So the return statement will never reach. Please take note of this when you are writing this type of iteration.

Challenge: The Tables Having Dates as Columns

If you would like to challenge yourself to retrieve the data from the tables having dates as their columns, it is possible too, just with a few challenges.

First challenge is that we are not sure when the dataset will be updated. So, we can never be sure for the value of the last column. Since the dataset will be updated daily, to be safe, we can let the date of two days ago to be the last column in our query.

Second challenge is the format of the date. We cannot use the Golang magical reference date (Mon, Jan 2 15:04:05 MST 2006) to format the date because of the underscores found in the column name. There is a very interesting discussion about the origin of the magical reference date on Stack Overflow, in case you are interested, but it’s not important here. Hence, we will use the following code to format the date instead.

latestDateInQuery := fmt.Sprintf("_%v_%v_%v", int(d.Month()), d.Day(), d.Year() - 2000)

So the following code will help us to get the count from the second latest, if not the latest, column.

latestDate := time.Now().AddDate(0, 0, -2)
latestDateInQuery := fmt.Sprintf("_%v_%v_%v", int(latestDate.Month()), latestDate.Day(), latestDate.Year()-2000)

Once we get the column name, we can then use it in the following query.

`SELECT 
    IFNULL(province_state, "") AS place, 
    country_region, 
    latitude, 
    longitude, 
    (` + latestDateInQuery + `) AS count 
FROM ` + "`bigquery-public-data.covid19_jhu_csse.confirmed_cases`;"

Visualising the Data

With the queries above, we can then easily generate results with Google Charts. Here, I use the Line Chart and the GeoChart.

🎨  The COVID-19 dashboard powered by Golang and Google BigQuery. 🎨 

There is an interesting feature in GeoChart is that, by default, when we are using latitude and longitude instead of the address to identify the places, the text shown on the map tooltip will be the latitude and longitude, which is not user friendly. However, we can actually change the text by putting a description column right after the longitude column, as discussed over here on Google Groups. It’s interesting because this is said to be an undocumented support for such a column. So we’re not sure where this will stop working.

Next, I am using web page done with Material Design to display the charts. Please enjoy the following screenshots.

🎨  Charts showing the situation in both of my beloved countries. 🎨 
🎨  Top 10 countries having the most confirmed cases. 🎨 
🎨  The global situation where we locate the places with latitudes and longitudes. 🎨 

That’s all for the COVID-19 dashboard done using Golang and Google BigQuery. Also, thanks to JHU CSSE and Google, we are able to access to such an important data for free.

Finally, I’d like to wish all of you and your loved ones to stay safe and healthy.

🎨  A nurse checks the temperature of a visitor as part of the COVID-19 screening procedure. (Photo Credit: The Straits Times) 🎨Â