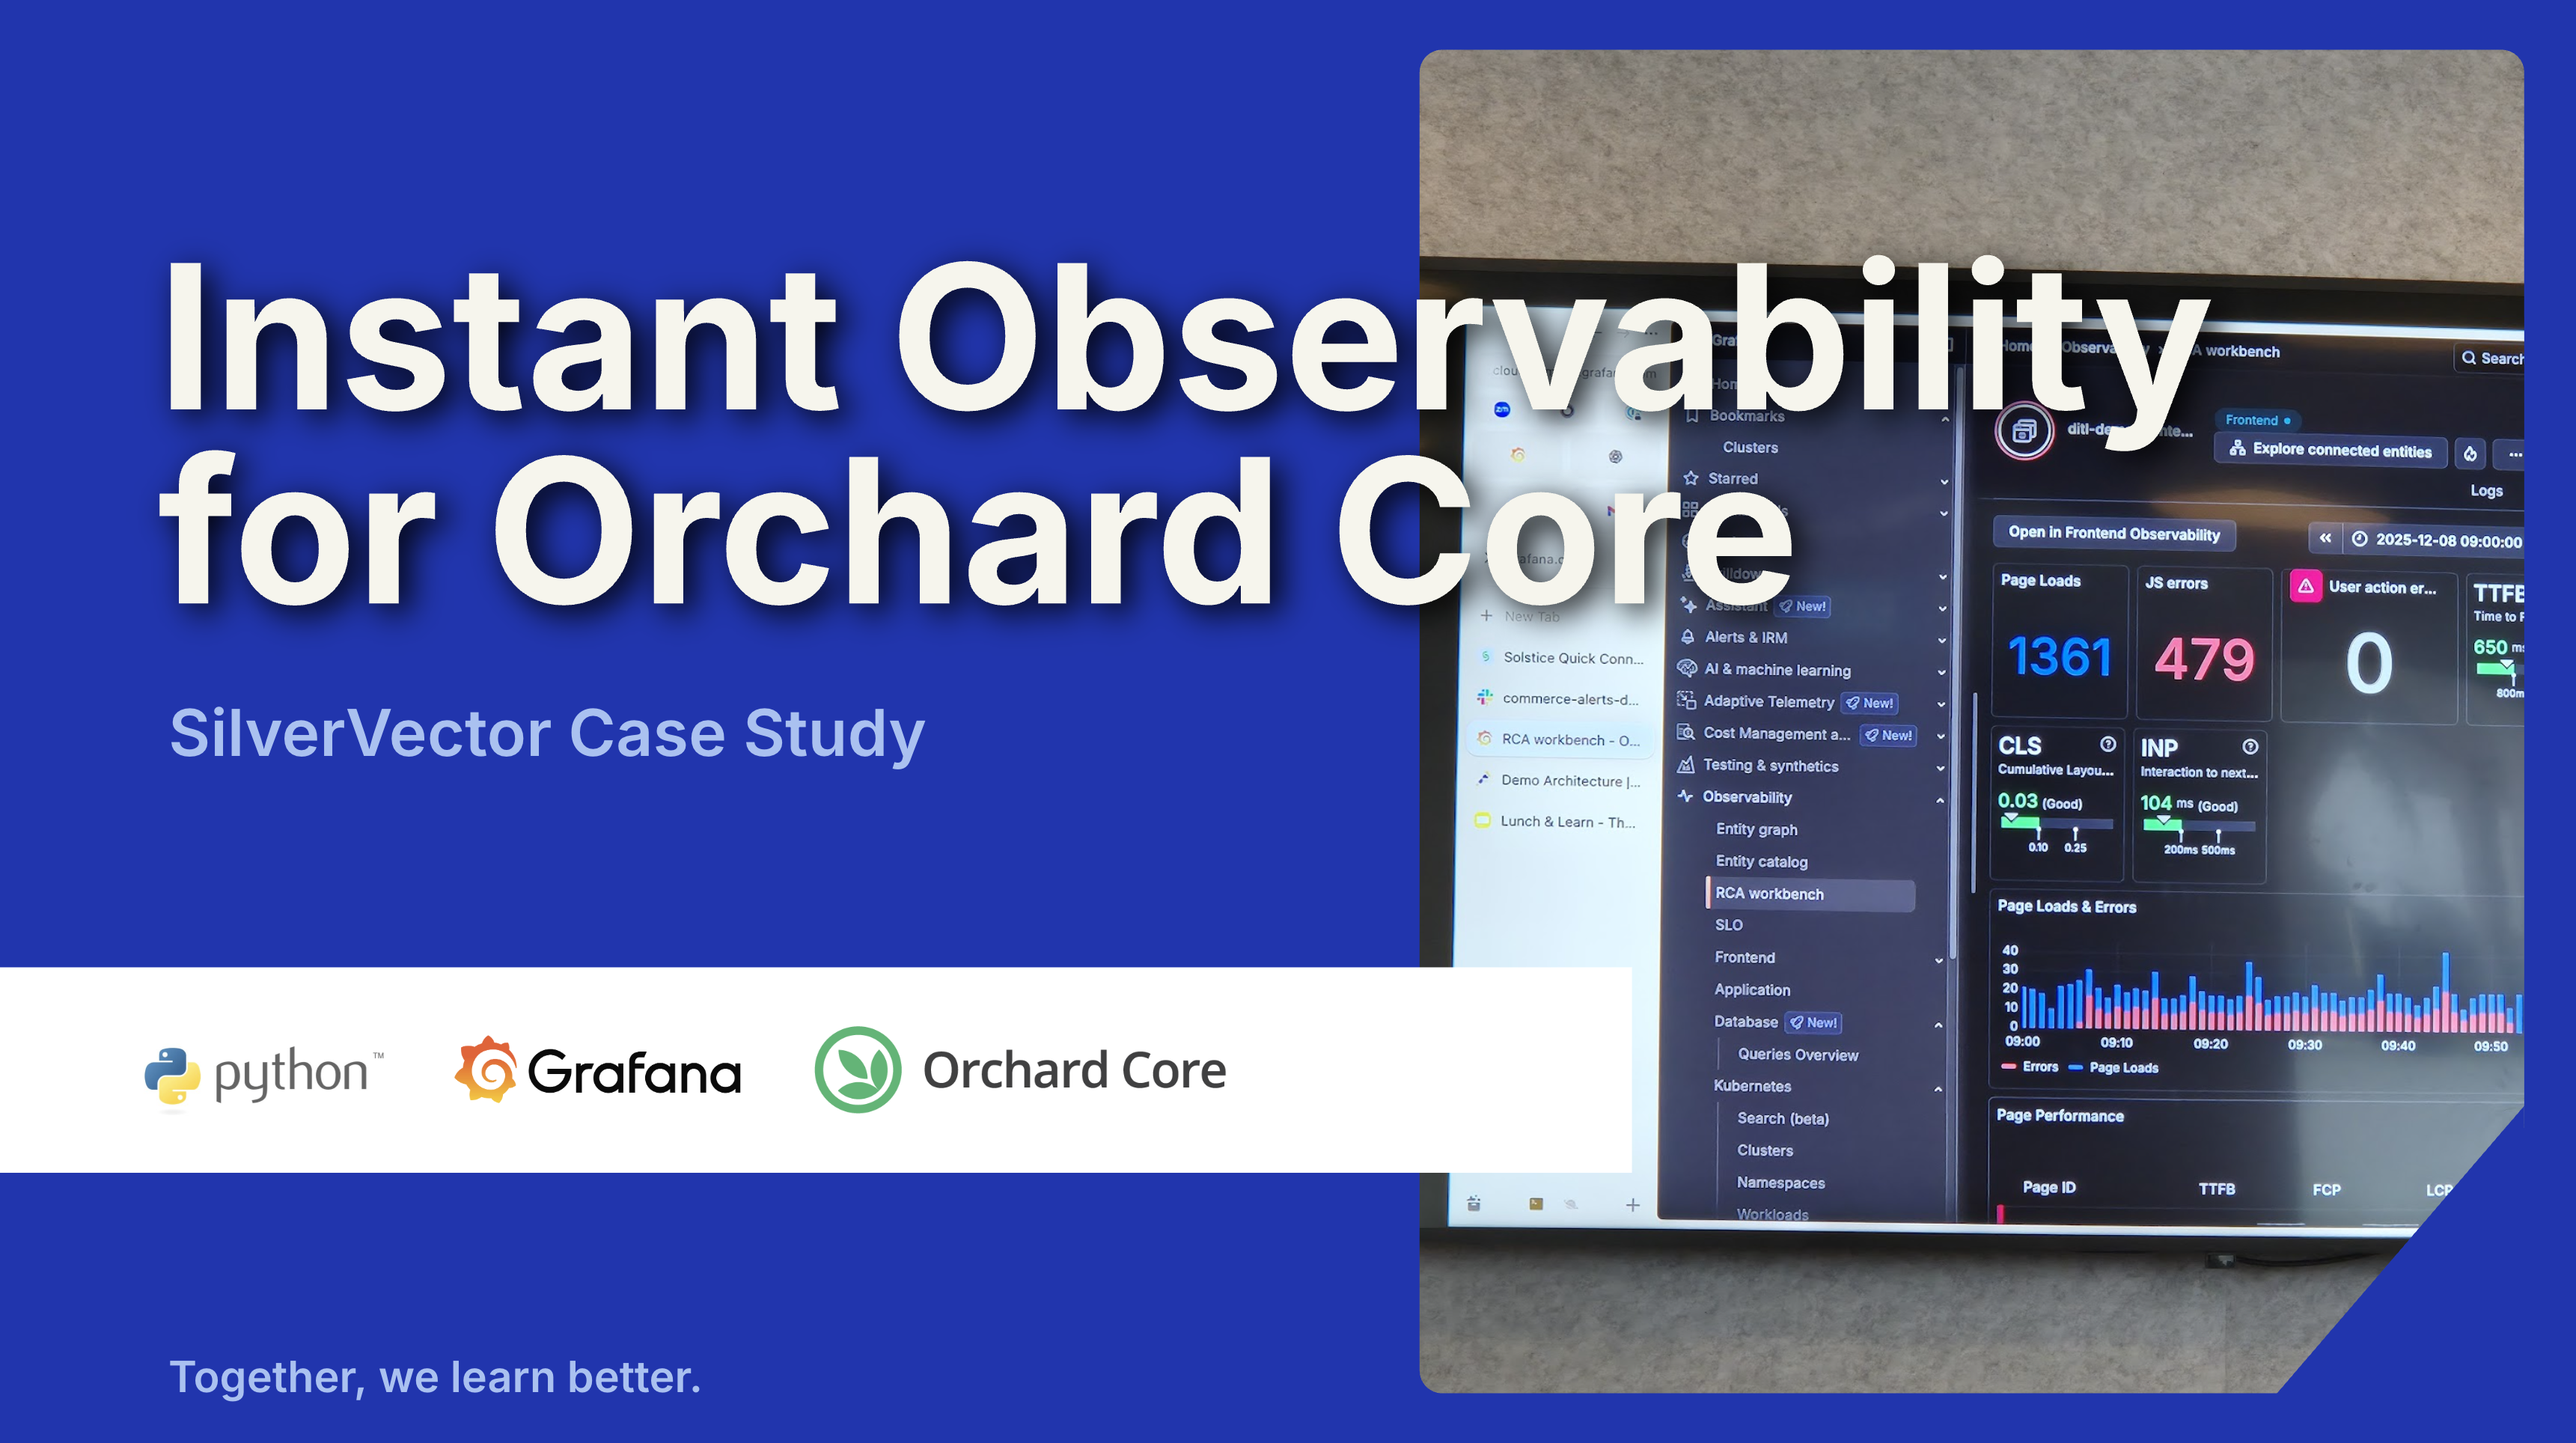
In our previous post, we introduced SilverVector as a “Day 0” dashboard prototyping tool. Today, we are going to show you exactly how powerful that can be by applying it to a real-world, complex open-source CMS: Orchard Core.
Orchard Core is a fantastic, modular CMS built on ASP.NET Core. It is powerful, flexible, and used by enterprises worldwide. However, because it is so flexible, monitoring it on dashboard like Grafana can be a challenge. Orchard Core stores content as JSON documents, which means “simple” questions like “How many articles did we publish today?” often require complex queries or custom admin modules.
With SilverVector, we solved this in seconds.
Grafana: Your open and composable observability stack. (Event Page)
The “Few Clicks” Promise
Usually, building a dashboard for a CMS like Orchard Core involves:
Installing a monitoring plugin (if one exists).
Configuring Prometheus exporters.
Building panels manually in Grafana.
With SilverVector, we took a different approach. We simply asked: “What does the database look like?”
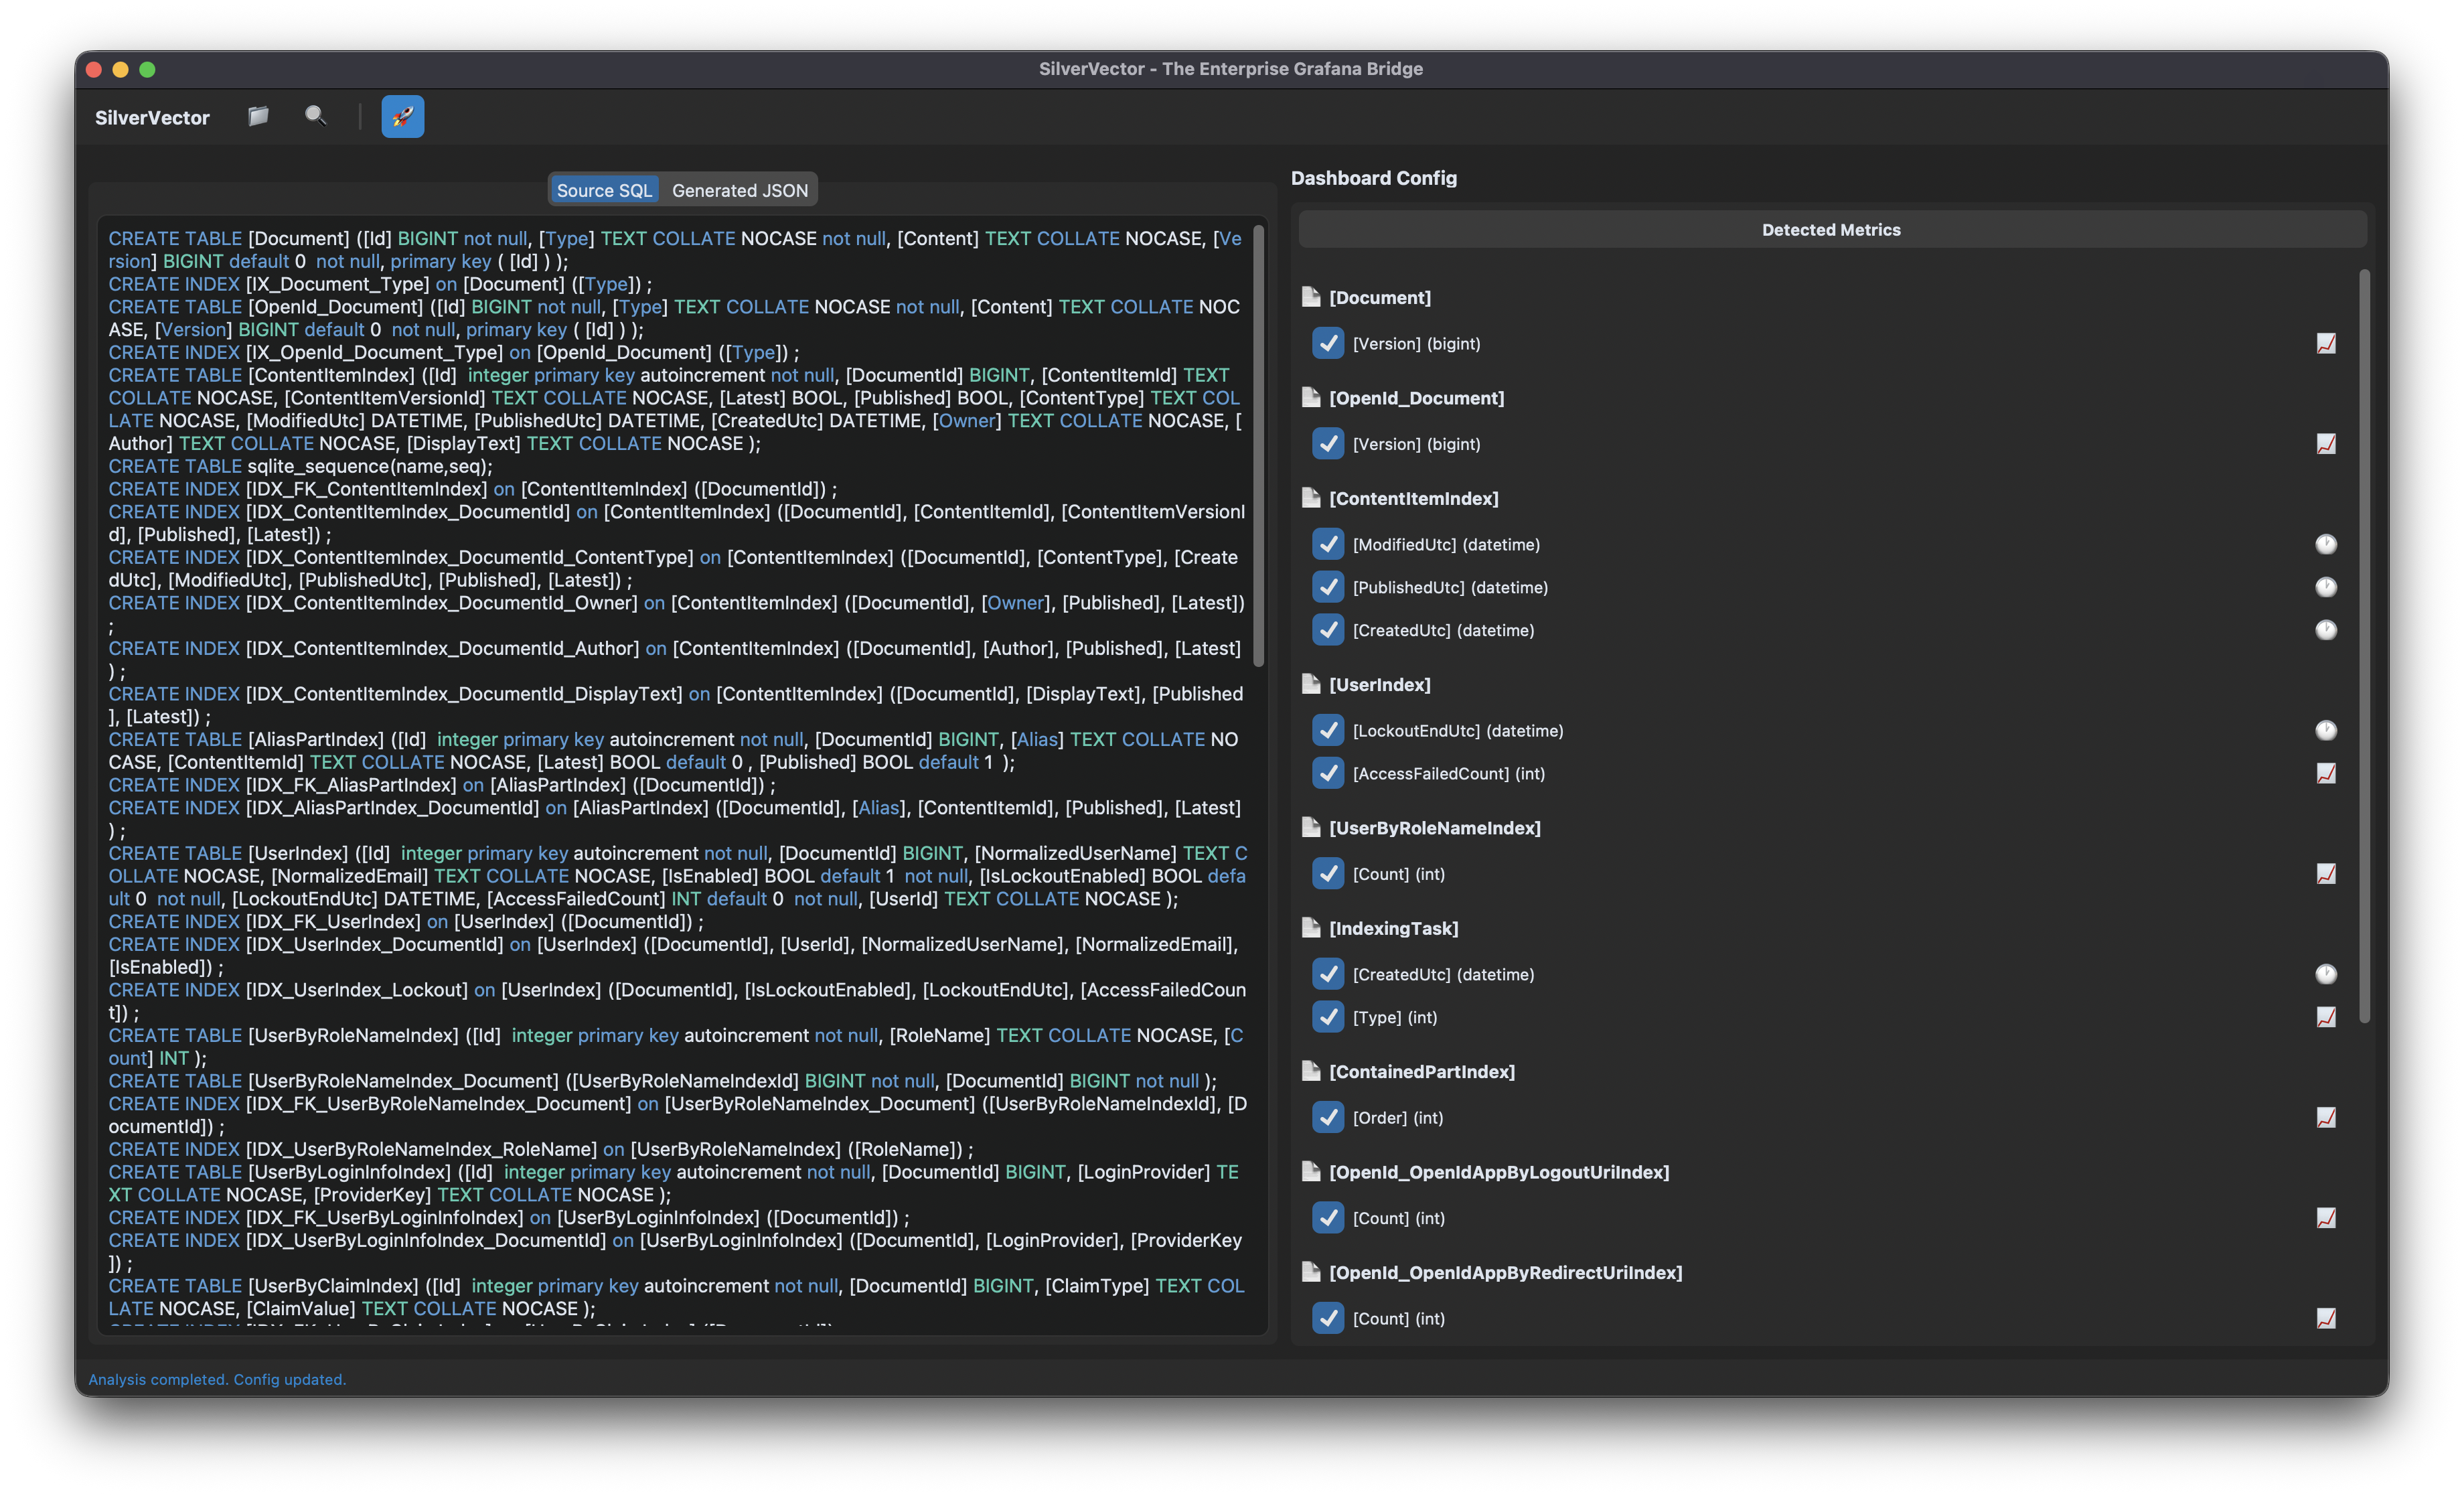
We took the standard SQL file containing Orchard Core DDL, i.e the script that creates the database tables used in the CMS. We did not need to connect to a live server. We also did not need API keys. We just needed the schema.
We taught SilverVector to recognise the signature of an Orchard Core database.
It sees ContentItemIndex? It knows this is an Orchard Core CMS;
It sees UserIndex? It knows there are users to count;
It sees PublishedUtc? It knows we can track velocity.
SilverVector detects the relevant metrics from the Orchard Core DDL that could be used in Grafana dashboard.
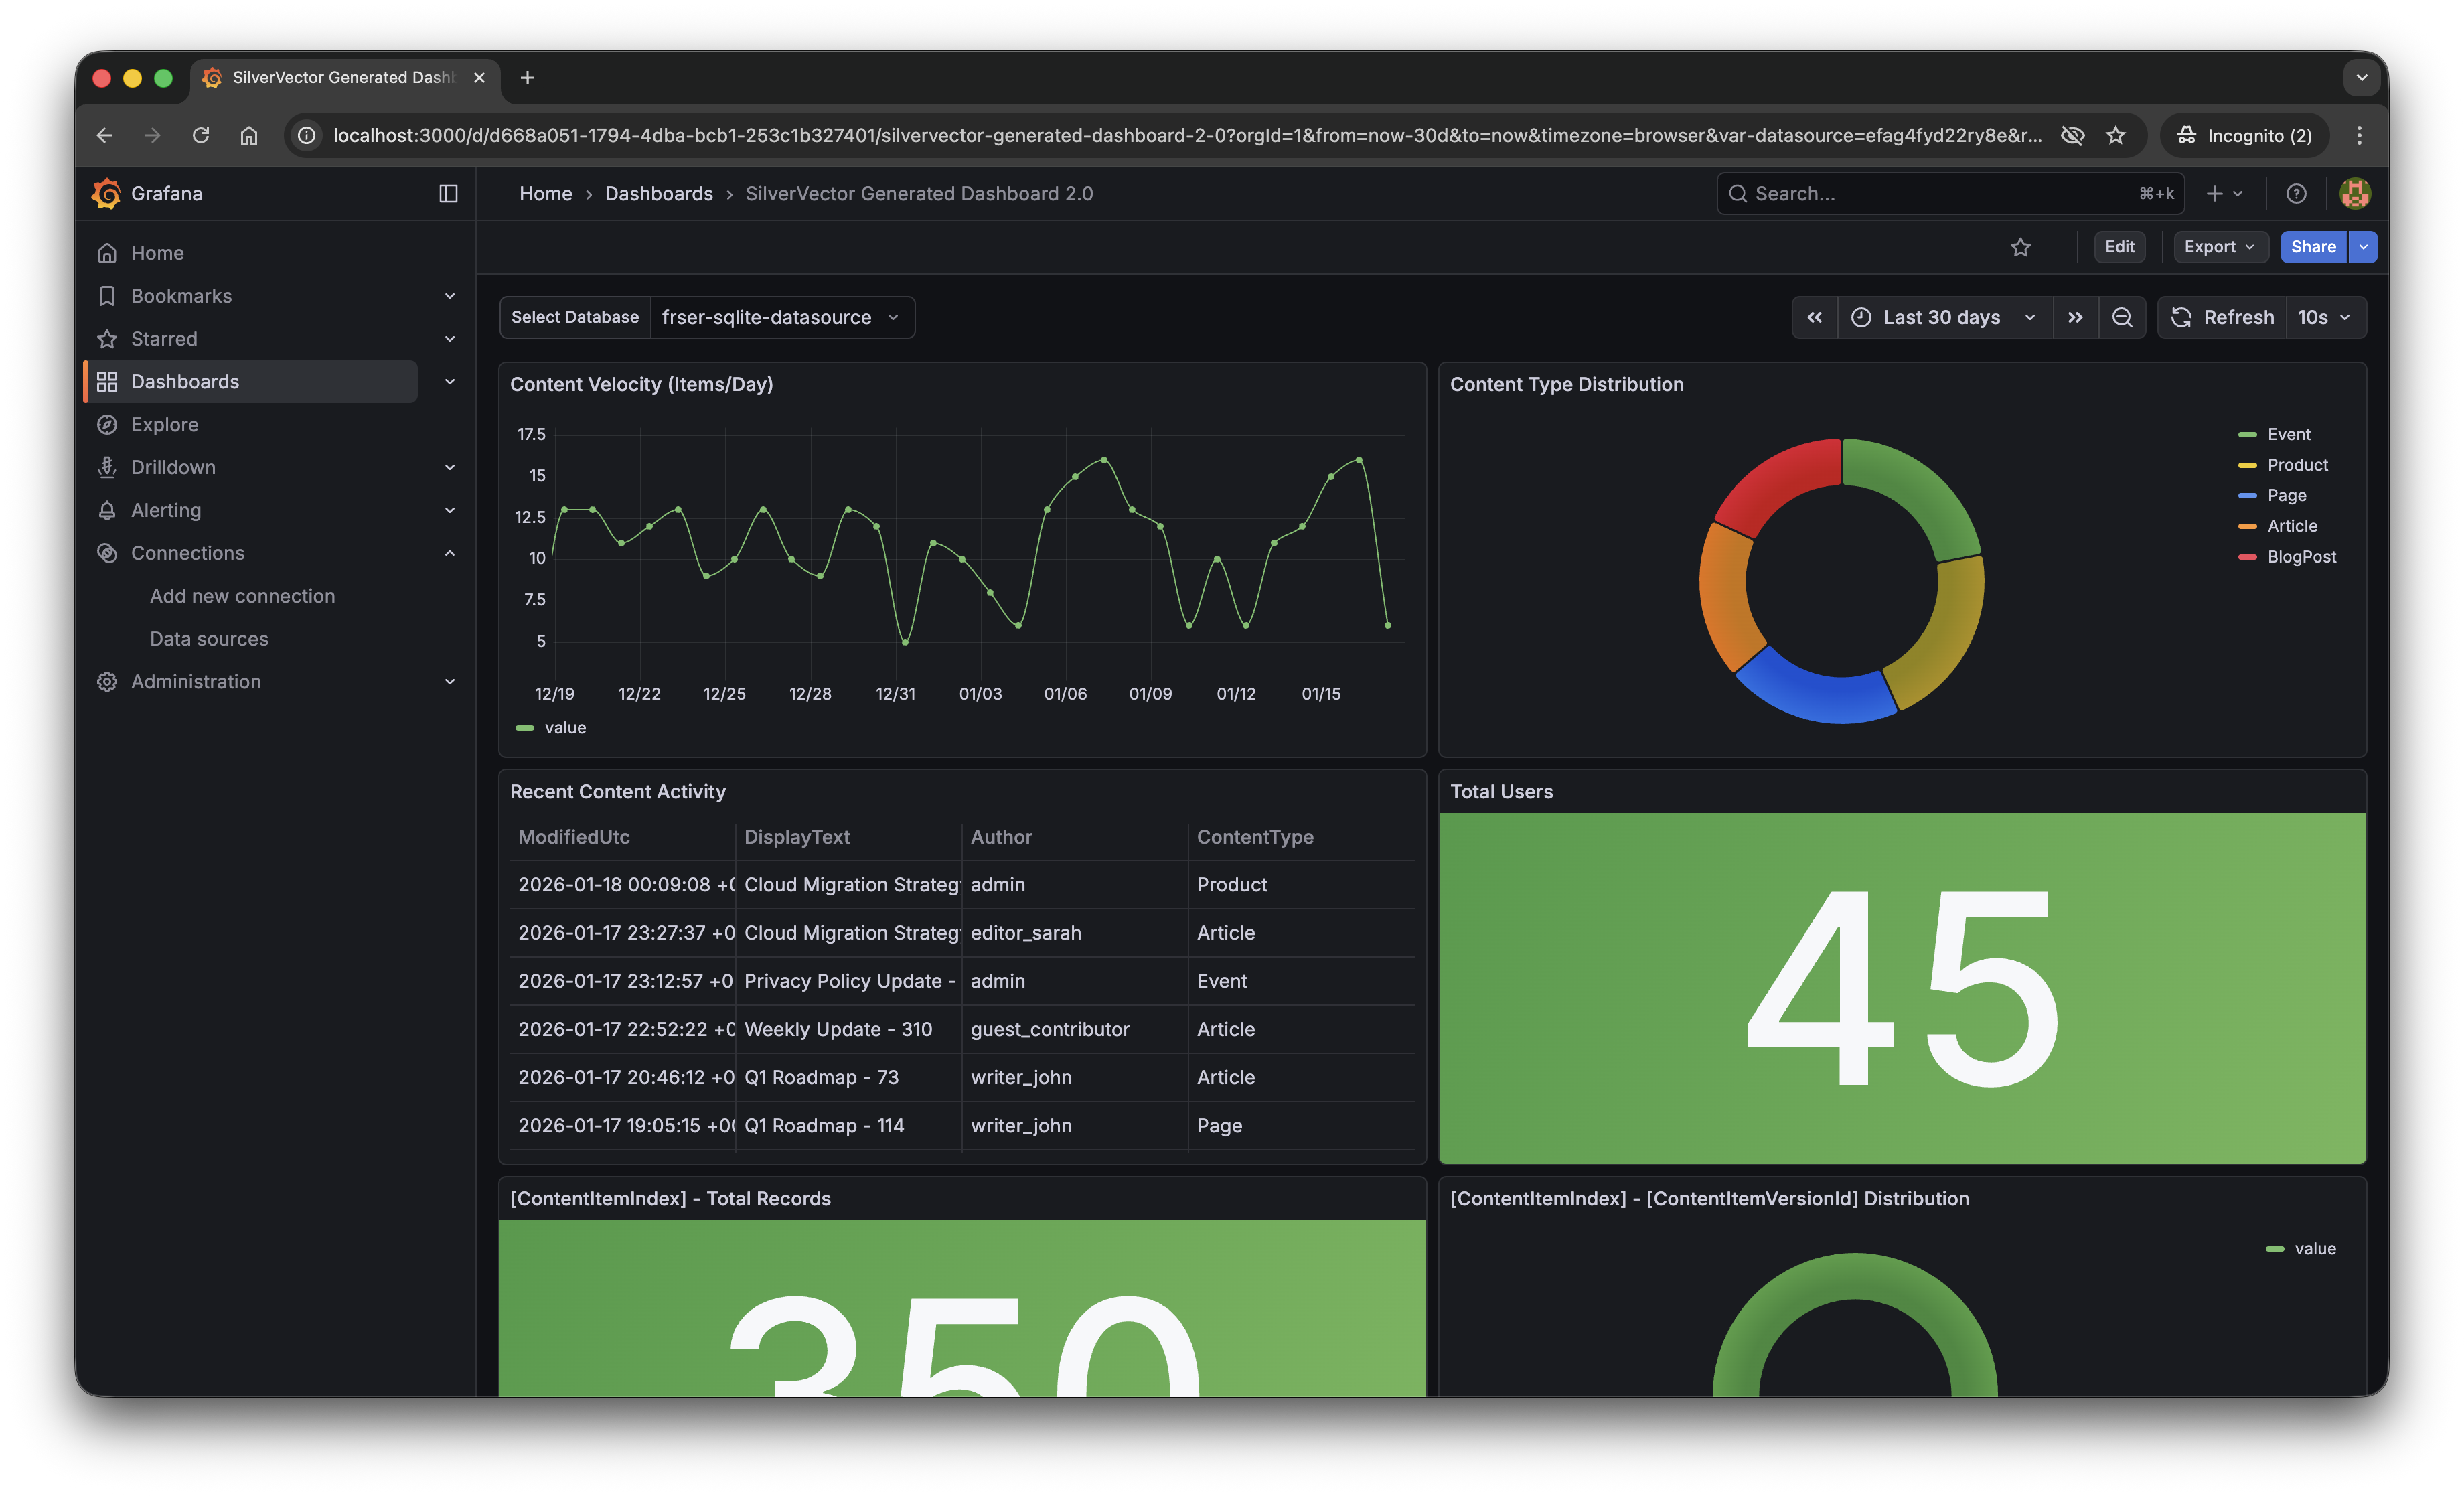
With a single click of the “blue rocket” button, SilverVector generated a JSON dashboard pre-configured with:
Content Velocity: A time-series graph showing publishing trends over the last 30 days.
Content Distribution: A pie chart breaking down content by type (Articles, Products, Pages).
Recent Activity: A detailed table of who changed what and when.
User Growth: A stat panel showing the total registered user base.
The “Content Velocity” graph generated by SilverVector.
Why This Matters for Orchard Core Developers
This is not just about saving 10 minutes of clicking to setup the initial Grafana dashboard. It is about empowerment.
As Orchard Core developers, you do not need to commit to a complex observability stack just to see if it is worth it. You can generate this dashboard locally, just as demonstrated above, point it at a backup of your production database, and instantly show your stakeholders the value of your work.
For many small SMEs in Singapore and Malaysia, as shared in our earlier post, the barrier of deploying observability stack is not just technical but it is survival. They are often too busy worrying about the rent of this month to invest time in a complex tech stack they do not fully understand. SilverVector lowers that barrier to minimal.
SilverVector gives you the foundation. We generate the boring boilerplate, i.e. the grid layout, the panel IDs, the basic SQL queries. Once you have that JSON, you are free to extend it! For example, you want to add CPU Usage? Just add a panel for your server metrics. Want to track Page Views? Join it with your IIS/Nginx logs.
In addition, since we rely on standard SQL indices such as ContentItemIndex, this dashboard works on any Orchard Core installation that uses a SQL database (SQL Server, SQLite, PostgreSQL, MySQL). You do not need to install a special module in your CMS application code.
A Call to Action
We believe the “Day 0” of observability should not be hard. It should be a default.
If you are an Orchard Core developer, try SilverVector today. Paste in your DDL, generate the dashboard, and see your Orchard Core CMS in a whole new light.
SilverVector is open source. Fork it, tweak the detection logic, and help us build the ultimate “Day 0” dashboard tool for every developer.
Let’s start with a problem that many of us in the systems engineering world have faced. You have a computationally intensive application such as a financial model, a scientific process, or in my case, a Discrete Event Simulation (DES). The code is correct, but it is slow.
In some DES problems, to get a statistically reliable answer, you cannot just run it once. You need to run it 5,000 times with different inputs, which is a massive parameter sweep combined with a Monte Carlo experiment to average out the randomness.
If you run this on your developer machine, it will finish in 2026. If you rent a single massive VM on cloud, you are burning money while one CPU core works and the others idle.
This is a brute-force computation problem. How do you solve it without rewriting your entire app? You build a simulation lab on Kubernetes. Here is the blueprint.
About Time
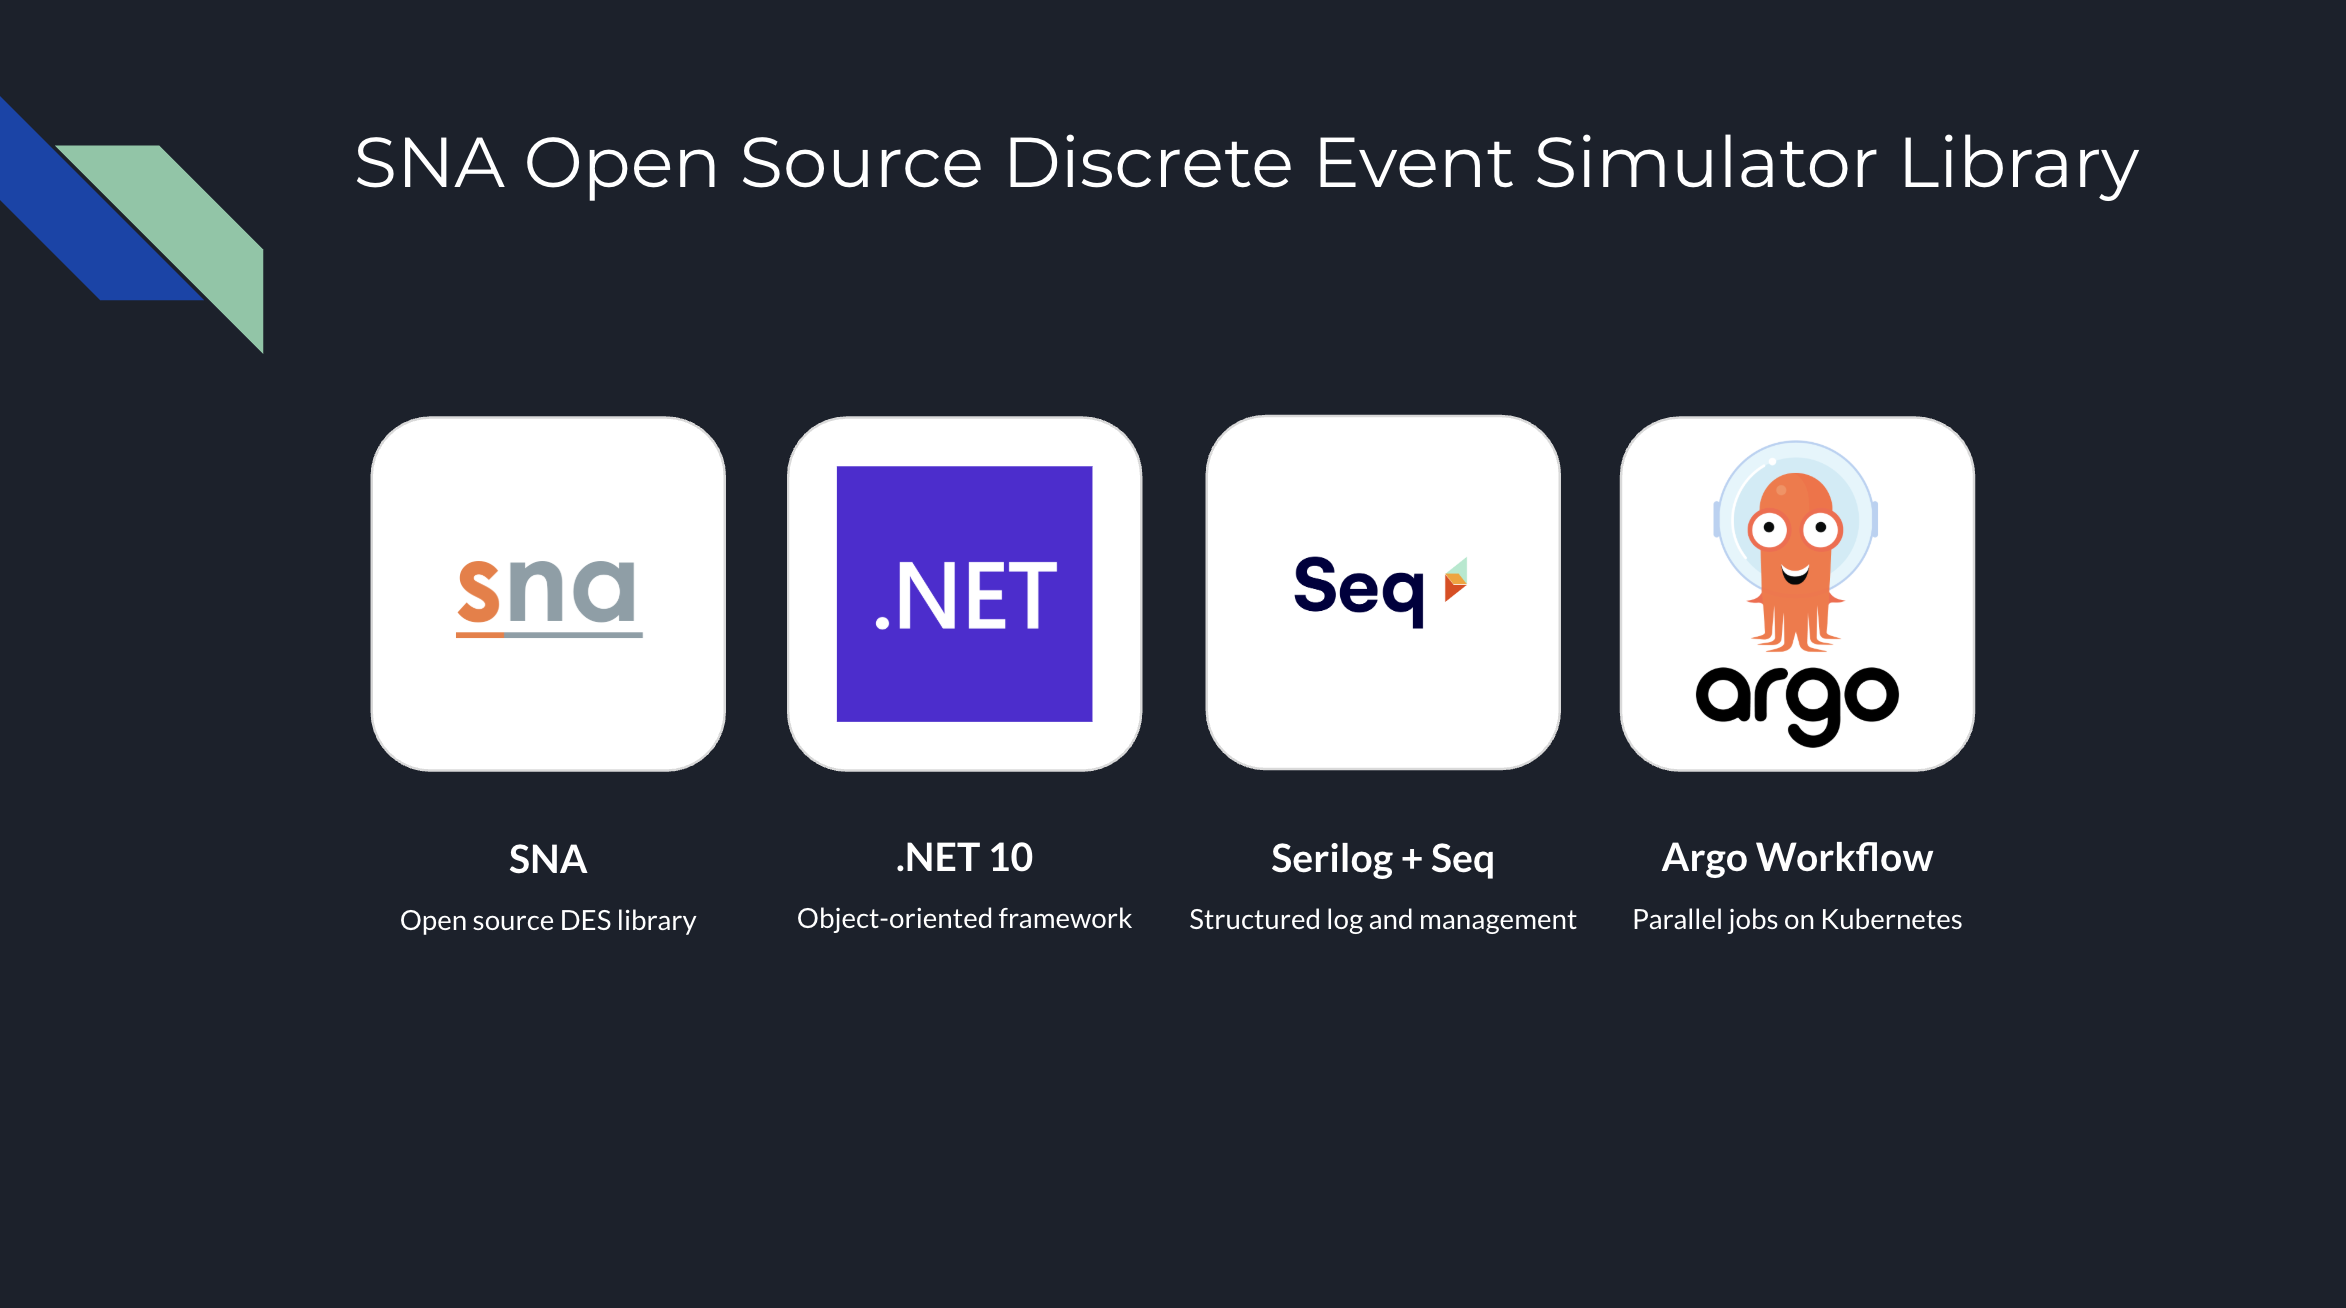
My specific app is a DES built with a C# library called SNA. In DES, the integrity of the entire system depends on a single, unified virtual clock and a centralised Future Event List (FEL). The core promise of the simulation engine is to process events one by one, in strict chronological order.
The FEL is a core component of a DES, which manages and schedules all future events that will occur in the simulation.
This creates an architectural barrier. You cannot simply chop a single simulation into pieces and run them on different pods on Kubernetes. Each pod has its own system clock, and network latency would destroy the causal chain of events. A single simulation run is, by its nature, an inherently single-threaded process.
We cannot parallelise the simulation, but we can parallelise the experiment.
This is what is known as an Embarrassingly Parallel problem. Since the multiple simulation runs do not need to talk to each other, we do not need a complex distributed system. We need an army of independent workers.
The Blueprint: The Simulation Lab
To solve this, I moved away from the idea of a “server” and toward the idea of a “lab”.
Our architecture has three components:
The Engine: A containerised .NET app that can run one full simulation and write its results as structured logs;
The Orchestrator: A system to manage the parameter sweep, scheduling thousands of simulation pods and ensuring they all run with unique inputs;
The Observatory: A centralised place to collect and analyse the structured results from the entire army of pods.
The Engine: Headless .NET
The foundation is a .NET console programme.
We use System.CommandLine to create a strict contract between the container and the orchestrator. We expose key variables of the simulation as CLI arguments, for example, arrival rates, resource counts, service times.
using System.CommandLine;
var rootCommand = new RootCommand { Description = "Discrete Event Simulation Demo CLI\n\n" + "Use 'demo <subcommand> --help' to view options for a specific demo.\n\n" + "Examples:\n" + " dotnet DemoApp.dll demo simple-generator\n" + " dotnet DemoApp.dll demo mmck --servers 3 --capacity 10 --arrival-secs 2.5" };
// Show help when run with no arguments if (args.Length == 0) { Console.WriteLine("No command provided. Showing help:\n"); rootCommand.Invoke("-h"); // Show help return 1; }
// ---- Demo: simple-server ---- var meanArrivalSecondsOption = new Option<double>( name: "--arrival-secs", description: "Mean arrival time in seconds.", getDefaultValue: () => 5.0 );
var simpleServerCommand = new Command("simple-server", "Run the SimpleServerAndGenerator demo"); simpleServerCommand.AddOption(meanArrivalSecondsOption);
var demoCommand = new Command("demo", "Run a simulation demo"); demoCommand.AddCommand(simpleServerCommand);
rootCommand.AddCommand(demoCommand);
return await rootCommand.InvokeAsync(args);
This console programme is then packaged into a Docker container. That’s it. The engine is complete.
The Orchestrator: Unleashing an Army with Argo Workflows
How do you manage a great number of pods without losing your mind?
My first attempt was using standard Kubernetes Jobs. Kubernetes Jobs are primitive, so they are hard to visualise, and managing retries or dependencies requires writing a lot of fragile bash scripts.
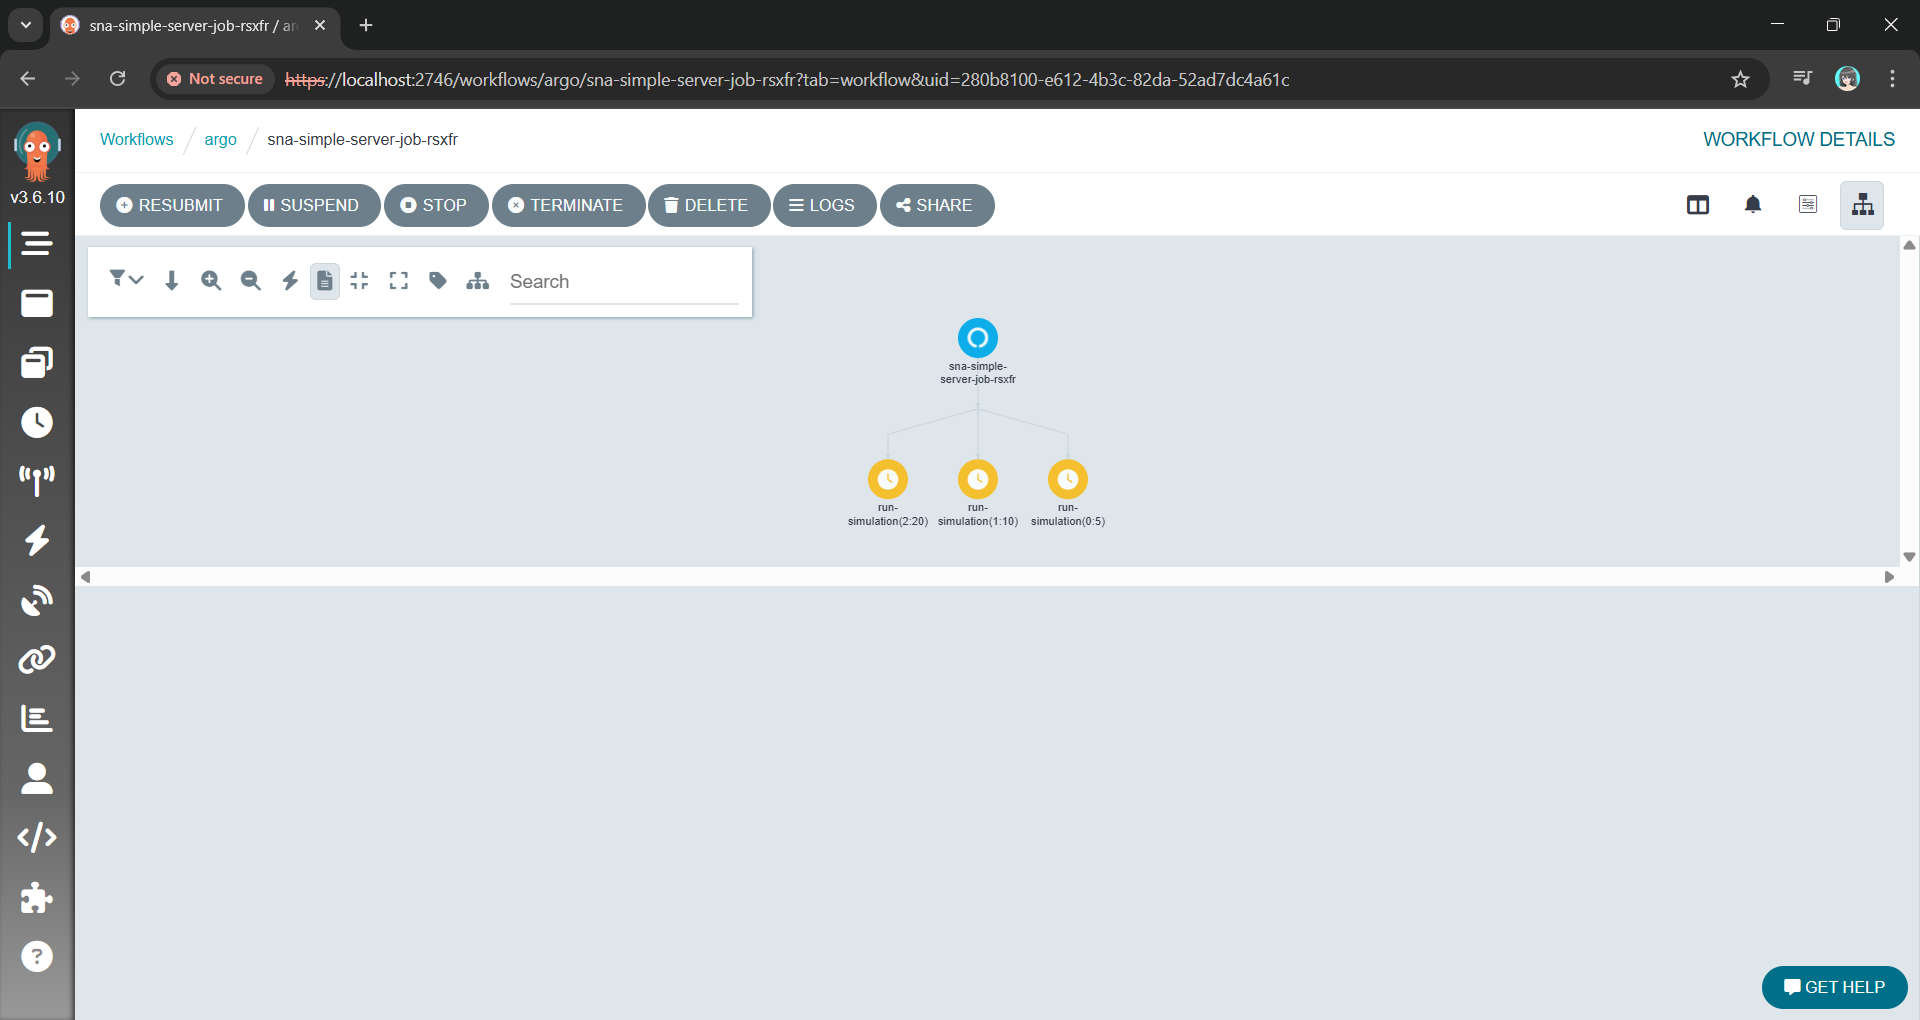
Argo allows us to define the entire parameter sweep as a single workflow object. The killer feature here is the withItems. Alternative, using withParam loop, we can feed Argo a JSON list of parameter combinations, and it handles the rest: Fan-out, throttling, concurrency control, and retries.
This YAML file is our lab manager. It can also be extended to support scheduling, retries, and parallelism, transforming a complex manual task into a single declarative manifest.
The Argo Workflow UI with the fan-out/parallel nodes using the YAML above.
Instead of managing pods, we are now managing a definition of an experiment.
The Observatory: Finding the Needle in a Thousand Haystacks
With a thousand pods running simultaneously, kubectl logs is useless. You are generating gigabytes of text per minute. If one simulation produces an anomaly, finding it in a text stream is impossible.
We solve this with Structured Logging.
By using Serilog, our .NET Engine does not just write text. Instead, it emits machine-readable events with key-value pairs for our parameters and results. Every log entry contains the input parameters (for example, { "WorkerCount": 5, "ServiceTime": 10 }) attached to the result.
These structured logs are sent directly to a centralised platform like Seq. Now, instead of a thousand messy log streams, we have a single, queryable database of our entire experiment results.
Viewing the structured log on Seq generated with Serilog.
Wrap-Up: A Reusable Pattern
This architecture allows us to treat the Kubernetes not just as a place to host websites, but as a massive, on-demand supercomputer.
By separating the Engine from the Orchestrator and the Observatory, we have taken a problem that was too slow for a single machine and solved it using the native strengths of the Kubernetes. We did not need to rewrite the core C# logic. Instead, we just needed to wrap it in a clean interface and unleash a container army to do the work.
The full source code for the SNA library and the Argo workflow examples can be found on GitHub: https://github.com/gcl-team/SNA
The turnout for my DES session in Taipei confirmed a growing hunger in our industry for proactive, simulation-driven approaches to engineering.
Quick note: I received a free license for NDepend to try it out and share my experience. All opinions in this blog post are on my own.
From O2DES.Net to Ea
In 2019, I had the honour of working closely with the team behind the O2DES.NET during my time working at the C4NGP research center in NUS, where I spent around two and a half years. After I left the team in 2022, O2DES.NET has not been actively updated on their GitHub public repository and it is still targeting at .NET Standard 2.1.
While .NET Standard 2.1 is not as old as the .NET Framework, it is considered somewhat outdated compared to the latest .NET versions. In the article “The Future of .NET Standard” written by Immo Landwerth, .NET Standard has been largely superseded by .NET 5 (and later versions), which unify these platforms into a single runtime. Hence, moving to .NET 8 is a forward-looking decision that aligns with current and future software development trends.
Immo Landwerth, program manager on the .NET Framework team at Microsoft, talked about .NET Standard 2.0 back in 2016. (Image Credit: dotnet – YouTube Channel)
Hence, in this article, I will walk you through the process of migrating O2DES.NET from targeting .NET Standard 2.1 to supporting .NET 8. To prevent any confusion, I’ve renamed the project to ‘Ea’ because I am no longer the active developer of O2DES.NET. Throughout this article, ‘Ea’ will refer to the version of the project updated to .NET 8.
In this migration journey, I will be relying on NDepend, a static code analysis tool for .NET developers.
Show Me the Code!
The complete source code of my project after migrating O2DES.NET to target at .NET 8 can be found on GitHub at https://github.com/gcl-team/Ea.
About NDepend: Why Do We Need a Static Code Analysis?
Why do we need NDepend, a static code analysis tool?
Static code analysis is a way of automatically checking our code for potential issues without actually running our apps. Think of it like a spell-checker, but for programming, scanning our codebase to find bugs, performance issues, and security vulnerabilities early in the development process.
During the migration of an older library, such as moving O2DES.NET from .NET Standard 2.1 to .NET 8, the challenges can add up. We are expected to run into outdated code patterns, performance bottlenecks, or even compatibility issues.
The O2DES.NET on GitHub has some of its NuGet references outdated too.
NDepend is designed to help with this by performing a deep static analysis of the entire codebase. It gives us detailed reports on code quality, shows where our dependencies are, and highlights areas that need attention. We can then focus on modernising the code with confidence, knowing that we are not likely introducing new bugs or performance issues as we are updating the codebase.
NDepend also helps enforce good coding practices by pointing out issues like overly complex methods, dead code, or potential security vulnerabilities. With features like code metrics, dependency maps, and rule enforcement, it acts as a guide to help us write better, more maintainable code.
Bringing Down Debt from 6.22% to 0.35%
One of the standout features of NDepend is its comprehensive dashboard, which I heavily rely on to get an overview of the entire O2DES.NET codebase.
Right after targeting the O2DES.NET library to .NET 8, a lot of issues surfaced.
From code quality metrics to technical debt, the dashboard presents critical insights in a visual and easy-to-understand format. Having all this information in one place is indeed invaluable to us during the migration project.
We can configure the SQALE Debt Ratio and Debt Rating.
In the book, the SQALE method for Managing Technical Debt written by Jean-Louis Letouzey, SQALE stands for Software Quality Assessment based on Life Expectations. SQALE is a method used to assess and manage technical debt in software projects. In the context of NDepend, the SQALE method is used to calculate the Debt Ratio and Debt Rating:
Debt Ratio: The percentage of effort needed to fix the technical debt compared to rewriting the code from scratch.
Debt Rating: A letter-based rating (A to E) derived from the Debt Ratio to give a quick overview of the severity of technical debt.
As shown in one of the earlier screenshots, Ea has a Debt Ratio of 6.22% and a B rating. This means that its technical debt is considered moderate and manageable. Nevertheless, it is a signal that it is now time we should start addressing the identified issues before they accumulate.
After just two weeks of code cleanup, we successfully reduced Ea’s Debt Ratio from 6.22% to an impressive 0.35%, elevating its rating to an A. This significant improvement not only enhances the overall quality of the codebase but also positions Ea for better maintainability.
The most recent analysis shows that the Debt Ratio of Ea is down to just 0.35%.
Issues and Trends
In Visual Studio, NDepend also provides interactive UI which indicates the number of critical rules violated and critical issues to solve. Unlike most of the static code analysis tools that show overwhelming number of issues, NDepend has this concept of baseline.
When we first set up an NDepend project, the very first analysis of our code becomes the “baseline.” This baseline serves as a starting point, capturing the current state of our code. As we continue to work on the project, future analyses will be compared against this baseline. The idea is to track how our code changes over time so that we can focus on knowing whether we are improving or introducing more issues to the codebase while we are changing it.
At some point during the code change, we fixed 31 “High” issues (shown in green) while introducing 42 new “High” issues (shown in red).
As shown in the screenshot above, those new issues added since the baseline need to be our priority to fix. This is to make sure the newly written code and refactored code will remain clean.
In fact, when fixing the issues, I get to learn from the NDepend rules. When we click on the numbers, we will be shown the corresponding issues. Then clicking on each of the issue will show us the detailed information about it. For example, as shown in the screenshot below, when we click on one of the green numbers, it shows us a list of issues that have been fixed by us.
As indicated, the issue is one which has been fixed since the baseline.
When we click on the red numbers, as shown in the following screenshot, we will get to see the new issues that we need to fix. The following example shows how the original O2DES.NET has some methods declared with high visibility unnecessarily.
This is an issue that has been newly added since the baseline.
By default, the dashboard also comes with some helpful trend charts. These charts give us a visual overview of how our codebase is evolving over time.
We have made significant progress in Ea library development over the past half month.
These charts give us a visual overview of how our codebase is evolving over time. For those new to static code analysis, think of these charts as the “health check” of the project. During the migration, they help us to track important metrics, like code coverage, issues, or technical debt, and show how they change with each analysis.
Code Dependency Graphs
NDepend offers a Dependency Graph. It is used to visually represent the relationships between different components such as namespaces and classes within our codebase. The graph helps us understand how tightly coupled our code is and how different parts of our codebase depend on each other.
When we are refactoring Ea during the migration, we depend on the Dependency Graph to visually shows us how the different parts of the codebase are connected. We use the insight provided by Dependency Graph to plan how to split components, which will then make the code easier to manage.
A dependency diagram made of all classes in the Ea project.
As shown in the diagram above, we can see a graph made of some entangled classes which are connected with a red bi-directional arrow. This is because in the original O2DES.NET library, there are some classes having circular dependency. This thus makes parts of the code heavily reliant on each other, reducing modularity and making it harder to unit test the code independently.
To further investigate the classes, we can double click the edge between those two classes. Doing so will generate a graph made of methods and fields involved in the dependency between the two classes, as shown in the screenshot below.
The coupling graph between two classes.
This coupling graph is a powerful tool for us as it offers detailed insights into how the two classes interact. This level of detail allows us to focus on the exact code causing the coupling, making it easier to assess whether the dependency is necessary or can be refactored. For instance, if multiple methods are too intertwined, it might be time to extract common logic into a new class or interface.
In addition, the Dependency Matrix is another way to visualise the dependencies between namespaces, classes, or methods. A number in a cell at the intersection of two elements indicates how many times the element in the row depends on the element in the column. This gives us an overview of the dependencies within our codebase.
The Dependency Matrix.
From the Dependency Matrix above, we first should look for cells with large numbers. This is because having large numbers indicating the two methods are highly dependent on each other. We should review those methods to understand why there is so much interaction and to make sure they are not tightly coupled.
If there is a cycle in the codebase, there will be a red square shown on the Dependency Matrix. We then can refactor by breaking the cycle, possibly by introducing new interfaces or decoupling responsibilities between the methods.
Code Metrics View
In the Code Metric View, each rectangle represents a method. The area of a rectangle is proportional to metrics such as the # lines of codes (LOC), cyclomatic complexity (CC), of the corresponding method, field, type, namespace, or assembly.
This treemap shows the # lines of code (LOC) of the methods in our project.
During the migration, the tree view format enables us to navigate our codebase and prioritise areas that require refactoring by spotting those methods that are too big and too complex. In addition, to help quickly identify problem areas, NDepend uses colour coding in the tree view. For example, red may indicate high complexity or large size, while green might indicate simpler, more maintainable code.
The tree view is interactive. Right-clicking on the rectangles provides options such as opening the source code declaration for the selected element, allowing us to navigate directly to the method.
Right-clicking on the rectangles will show the available actions to perform.
Integrating with GitHub Actions
NDepend integrate well with several CI/CD pipelines, making it a valuable tool for maintaining code quality throughout the development lifecycle. It can automatically analyse our code after each build. This ensures that every change in our codebase adheres to defined quality standards before the merge to main branch.
NDepend comes with Quality Gates that enforce standards such as unfixed critical issues. If the code fails to meet the required thresholds, the build can fail in the pipelines.
In NDepend, Quality Gates are predefined sets of code quality criteria that our project must meet before it is considered acceptable for deployment. They serve as automated checkpoints to help ensure that our code maintains a certain standard of quality, reducing technical debt and promoting maintainability.
One of our build failed because there was code violating a critical rule in our codebase.
As shown in the screenshot above, NDepend provides detailed reports on issues and violations after each build. We can also download the detailed report from the CI servers, such as GitHub Actions. These reports help us quickly identify where issues exist in our code.
NDepend report of the build can be found in the Artifacts of the pipeline.
The NDepend report is divided into seven sections, each providing detailed insights into various aspects of your codebase:
Overview: It gives a high-level view of the overall code quality and metrics, similar to what is displayed in the NDepend Dashboard within Visual Studio.
Projects: Similar to the Issues section but focuses on projects instead of individual files. It displays the total issues and associated debt at the project level.
Rules: This section highlights the violated rules, showing the issues and debt in terms of the rules that have been broken. It’s another way to assess code quality by focusing on adherence to coding standards.
Quality Gates: This section mirrors the Quality Gates you might have seen earlier in the CI/CD pipelines, such as in GitHub Actions.
Trend: The Trend section provides a visualisation of trends over time, similar to the trend charts found in the NDepend Dashboard in Visual Studio.
Logs: This section contains the logs generated during NDepend analysis.
Number of un-resolved issues and debt of the files in our project.
As described in the NDpend documentation, it has complete support for Azure DevOps, meaning it can be seamlessly integrated into the CI/CD pipelines without a lot of manual setup. We thus can easily configure NDepend to run as part of our Azure Pipelines, generating code quality reports after each build.
For our Ea project, since it is an open-source project hosted on GitHub, we can also integrate NDepend with our GitHub Actions instead.
In conclusion, NDepend has proven to be an invaluable tool in our journey to modernise and maintain the Ea library.
By offering comprehensive static code analysis, insightful metrics, and seamless integration with CI/CD pipelines like GitHub Actions, it empowers us to catch issues early, reduce technical debt, and ensure a high standard of code quality.
NDepend provides the guidance and clarity needed to ensure our code remains clean, efficient, and maintainable. For any .NET individual or development team serious about improving code quality, NDepend is definitely a must-have in the toolkit.
Getting our apps to the market is always an exciting moment. I once remembered I worked with the business co-founders until mid-night when we launched our first version of the app. There was also a time when minister and other government officers visited the launch event of our UWP app. So, yup, publishing and releasing the apps to market is a crucial knowledge to learn for developers. Today, this post will share my journey of submitting my first UWP app to the Microsoft Store.
As a staff in an education institute, I can access Microsoft Store for Education too.
When we package our apps using Visual Studio and then release it to the Microsoft Store, a special capability will be added automatically. It’s called runFullTrust, a restricted capability. It allows our apps to run at the full trust permission level and to have full access to resources on the users’ machine. Hence, we need to submit our apps to the Microsoft Store and then wait for approval from Microsoft before our apps can be released on the Microsoft Store.
So, let’s start the app publish journey with me now.
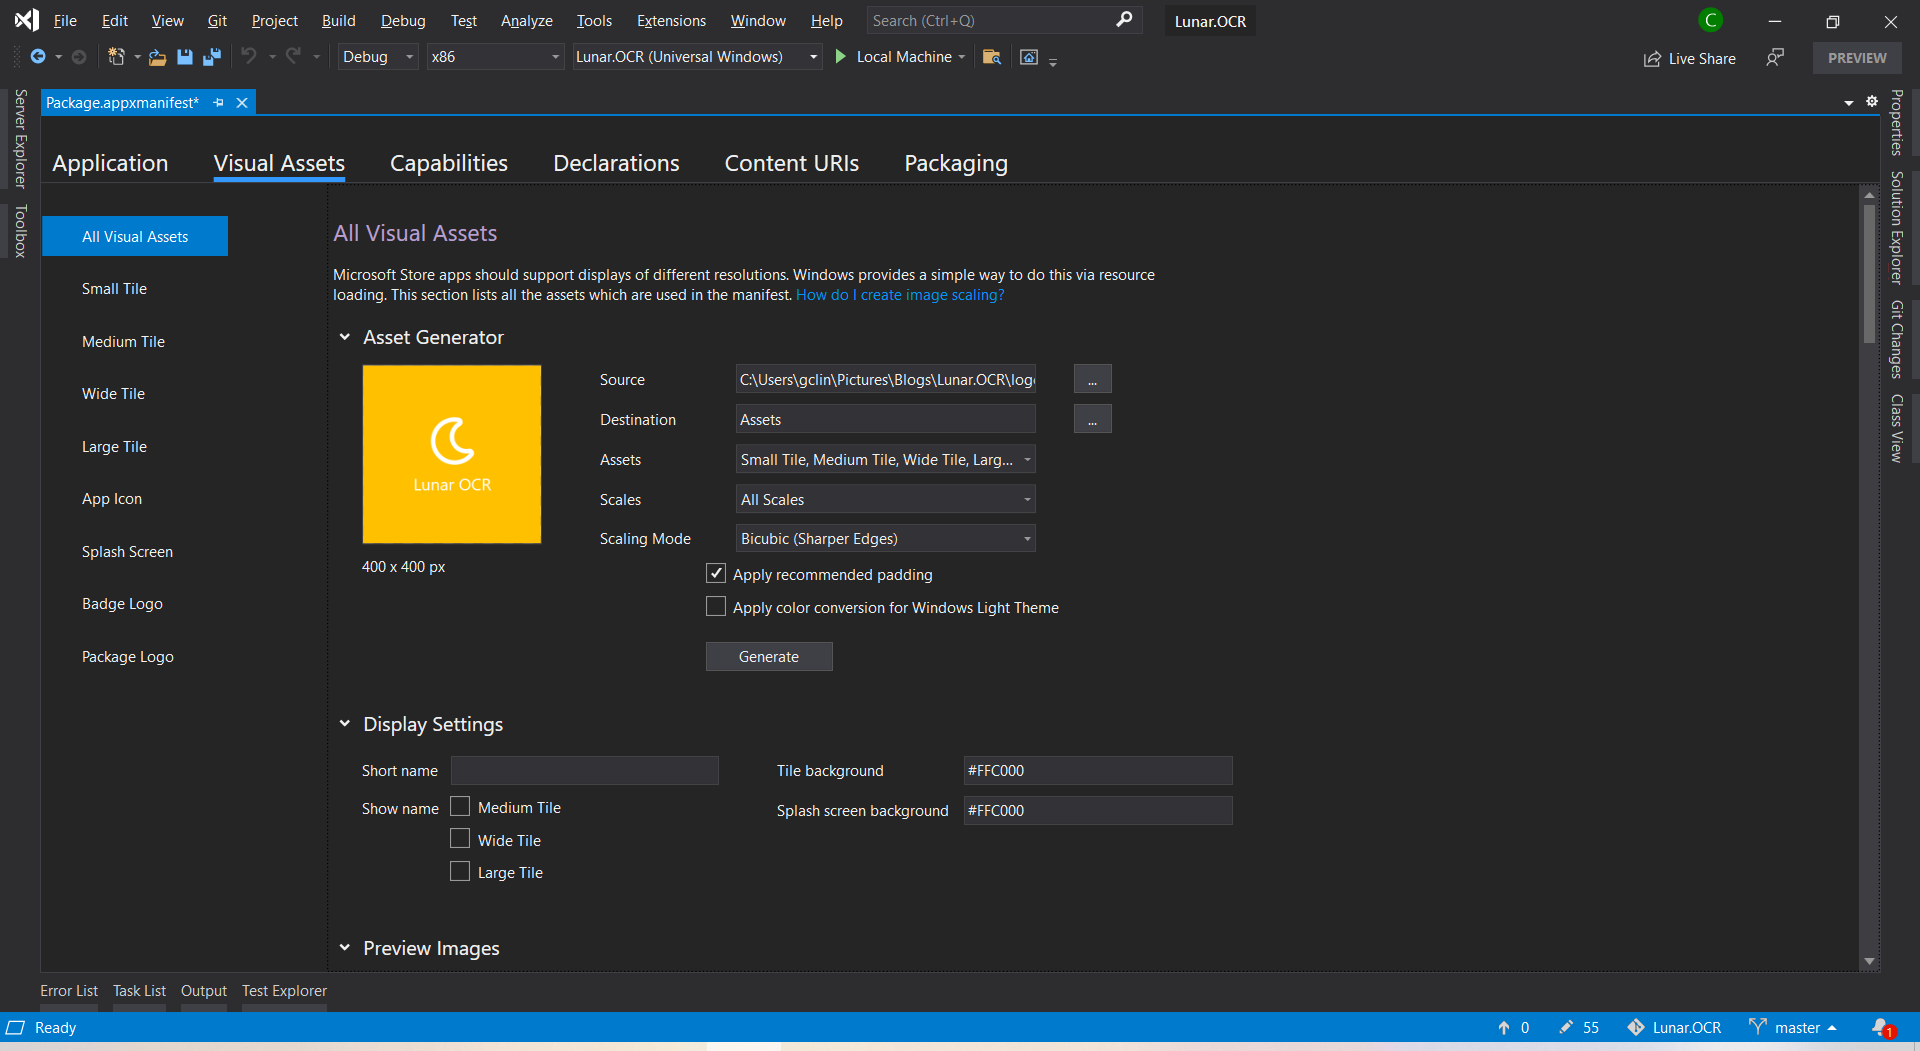
After that, we will proceed to configure our app manifest file Package.appxmanifest. It’s an XML file that contains the properties and settings required to create our app package.
The Display Name and Description are controlled in the resource file Resources.resw. I also set my app to support the Landscape views only.
After that, we will need to upload the product logo. Even though there are many visual assets for different sizes of tiles, icons, package logo, and splash screen, what we need to do is simply just upload one logo image which is at least 400×400 pixels. Then Visual Studio will be able to help us to generate the necessary assets.
I set the background of tile and splash screen to be the same colour as the uploaded logo because the logo file comes with a background colour.
I will skip the Capabilities, Declarations, and Content URIs tabs here because they are not relevant to our app for now.
We need to pay a one-time registration fee with no renewal is required. In Singapore, individual account costs SGD 24 and company account is SGD 120.
After we have logged in to the Microsoft Partner Center, we can first reserve our product name first. So we can take our time developing and publishing our apps without worrying the name will be used by other developer or company within the next three months.
Reserving a name for our app before submitting it is similar to the act of placing packets of tissue on empty tables to reserve seats while we go grab our food. (Photo Credit: The Straits Times)
Mission 3: Associate App with the Microsoft Store
After we have successfully created a developer account, we can then associate our app with the Microsoft Store in Visual Studio.
Right click our solution and we can associate our app with the Microsoft Store.
After the association is done, we will see that, in the Packaging tab of our app manifest, the app has already been signed with a trusted certificate. This allows the users to install and run our app without installing the associated app signing certificate.
Mission 4: Create the App Package
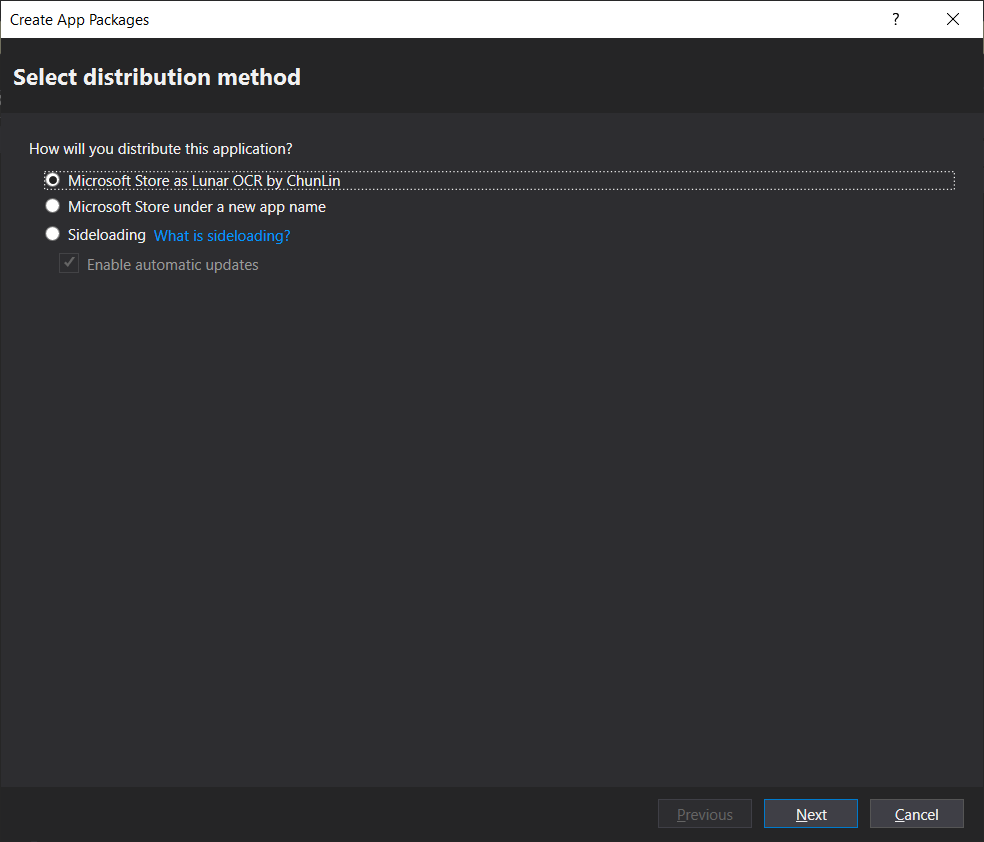
Since we have already associated the app, now when we proceed to create the app package, we will have an option to distribute to the Microsoft Store for the app directly.
Choosing the distribution method.
After that, we will need to select the architectures for our app. In order to make it runnable on most of the platforms, we should choose relevant ones.
Windows 10 devices and architectures. (Image Source: MSIX Docs)
Certification tests for our app on Windows App Certification Kit.
This mission is successfully completed as long as the Overall Result shows “PASSED”.
Mission 5: Publish to Microsoft Store!
Before we can submit our package on the Microsoft Partner Center, there are a few information we need to prepare.
Markets: There are in total 241 markets available. We need to choose to list our app in which markets. Currently, if the app is made available in Singapore, then the app can also be found on the Microsoft Store on Xbox One for Singapore market;
Privacy Policy: We need to provide a privacy policy URL to our app.
Website: A web page showing what our app is about.
Both privacy policy and website of my app are hosted as GitHub Pages.
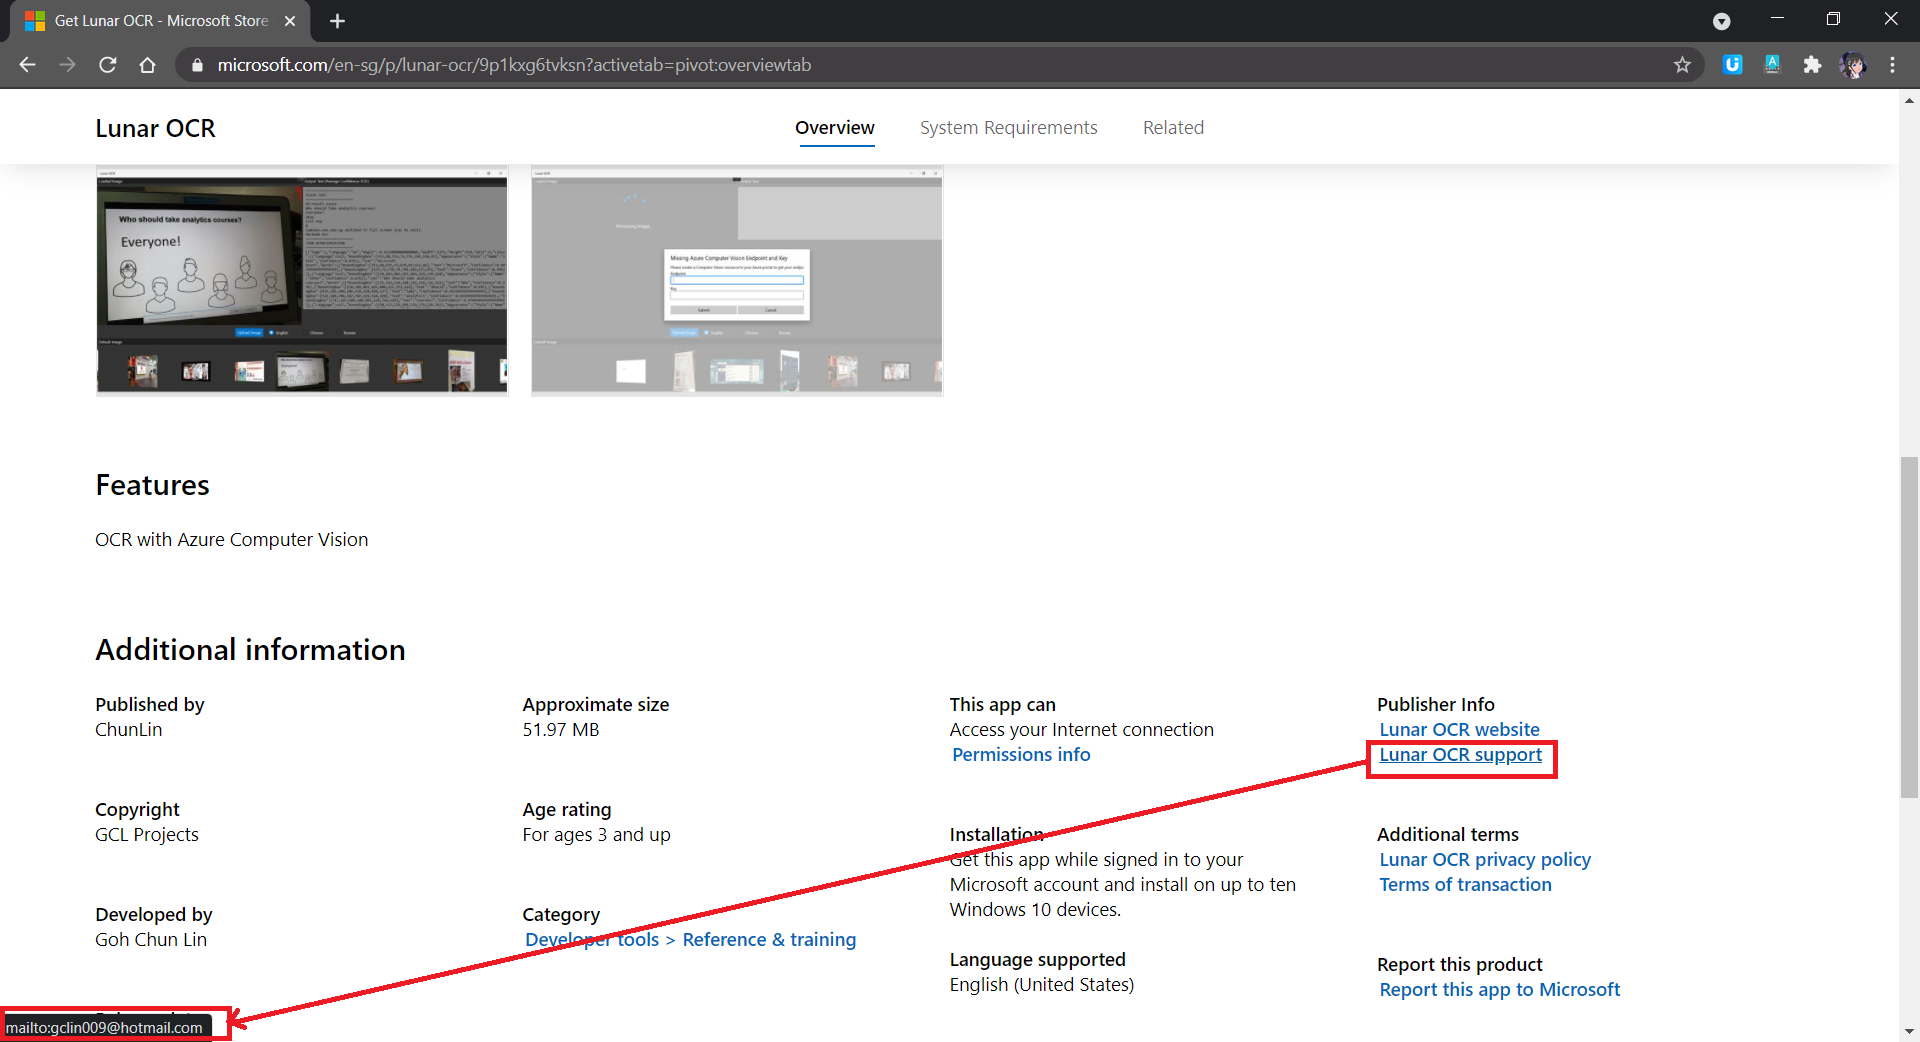
Support Contact Info: Please do not enter email as Support Contact Info, provide URL of a support page of the app instead. I received many spam mails after using my email for this field. Haha.
If email is used as Support Contact Info, web crawlers can easily retrieve our email address and spam us.
System Requirements: If customers are using hardware that doesn’t meet the minimum requirements, they may see a warning before they download our app.
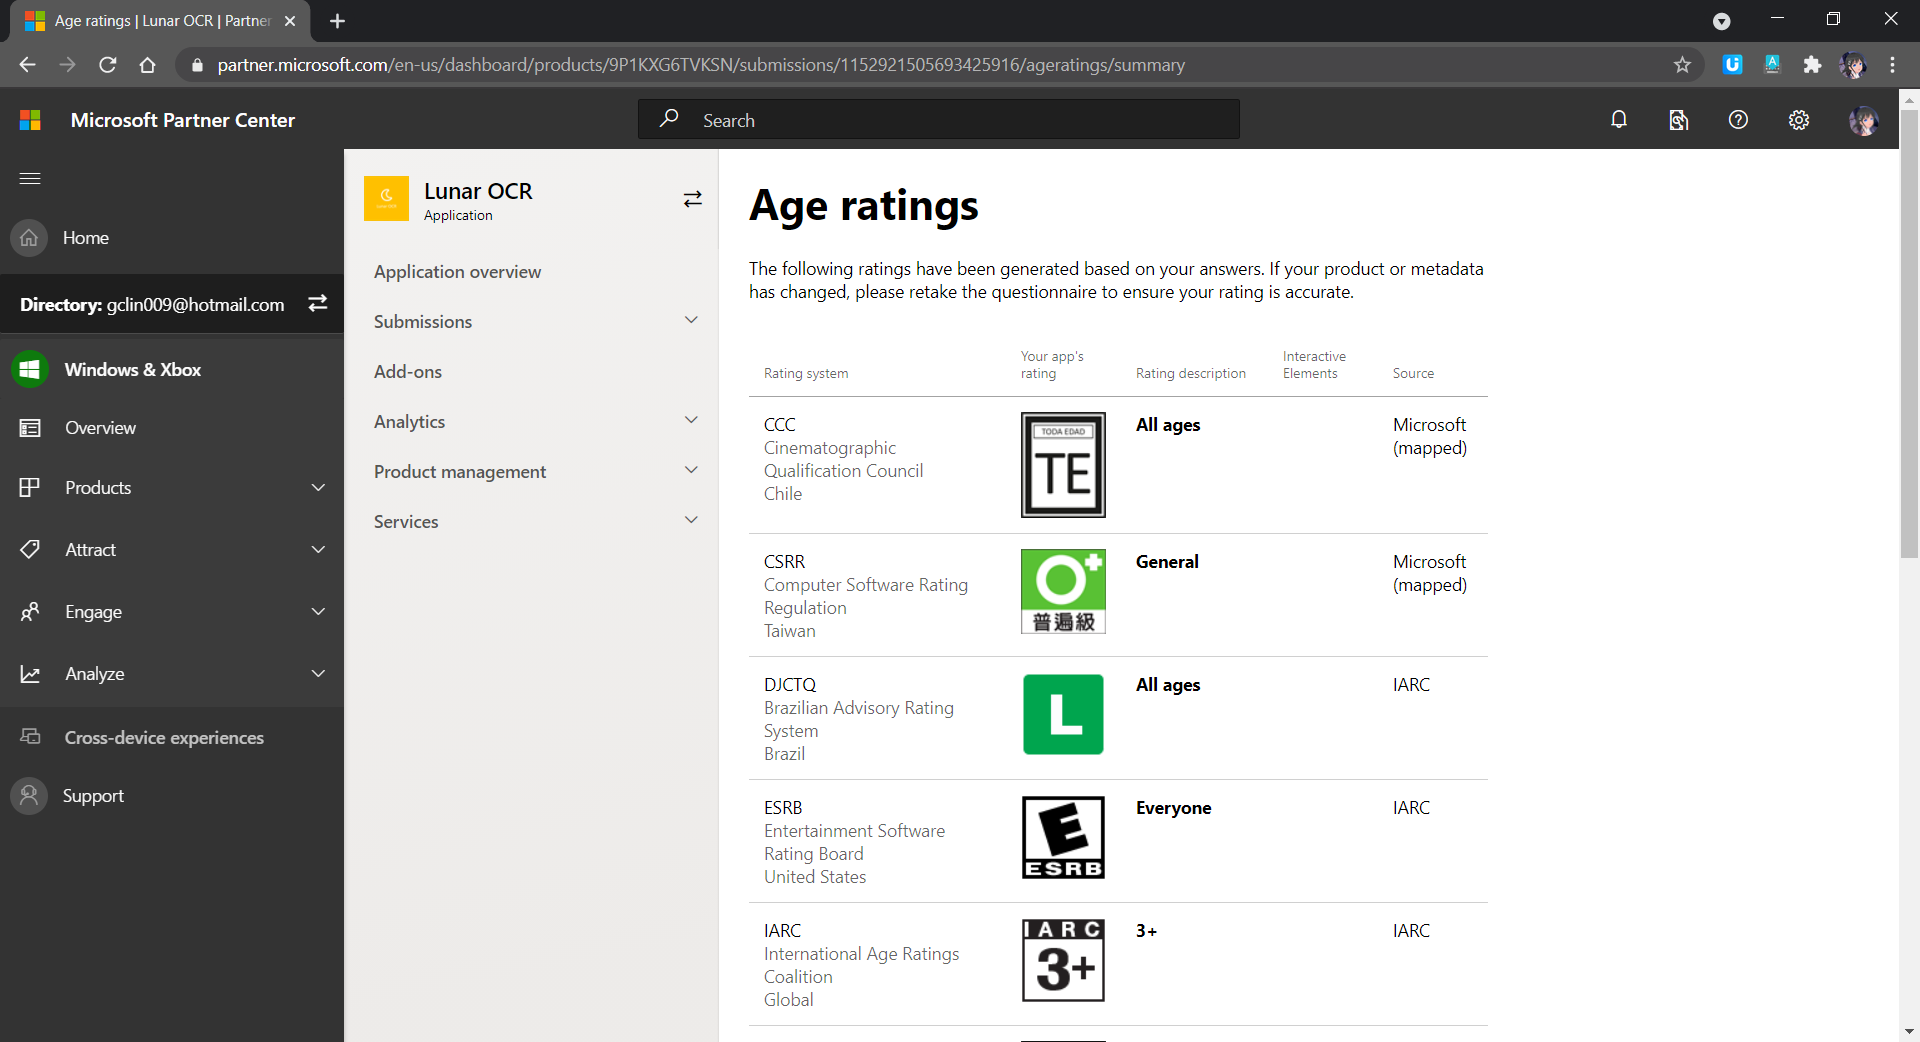
Age Rating: There will be a tool to help us determine the rating of our app in each of the markets.
Age rating of our app.
Publish Date: By default, our app will be published to the Microsoft Store as soon as the submission passes certification. However, we can also manually publish it later or schedule the publish to a later date and time.
Once we have provided all the information above, we can proceed to upload our app package to the Packages section, as shown in the screenshot below.
If the submission is rejected, we simply replace the app package here with a new one and then resubmit the same submission.
After our submission is done, we just need to wait for the Microsoft staff to certify our app.
If our submission is rejected, we will see a report as follows under the Submission where there will be details on action to take.
Oh no, there is an uncaught exception in our app. We gonna fix it fast.
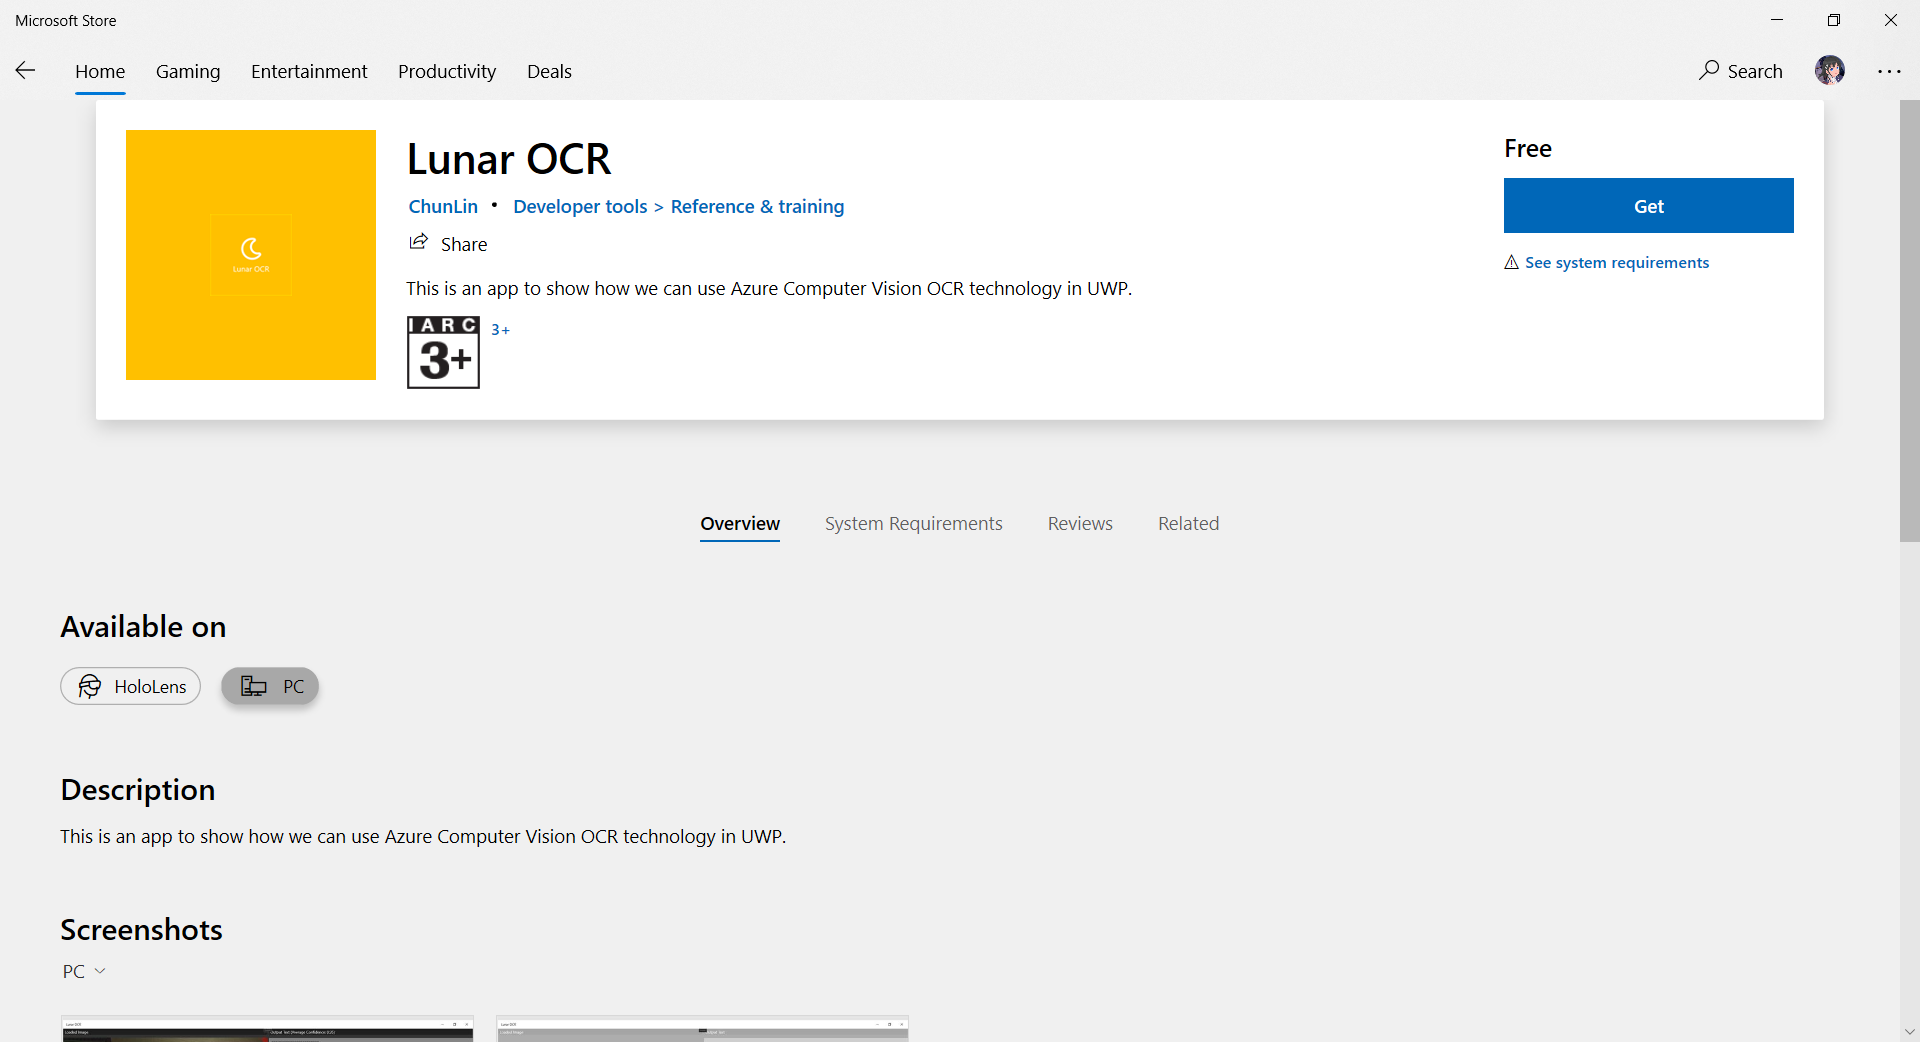
If there is no problem, we will be able to see our app on the Microsoft Store, as demonstrated in the following screenshot. The whole certification and release process is very fast to me.
I submitted the app on Sunday night (SGT) and my app was approved on Monday night (SGT) after fixing the problems reported by Microsoft and re-submitting again for one time on Monday evening (SGT).
Mission 6: Monetise App with In-app Ads
Since I am supporting open-source software, so the apps I publish are all free to the public to download. However, it would still be great if I can get financial supports from users who love my work. Hence, monetisation our app with in-app ads is one of the options.
It is better to get our app approved on Ads Jumbo before uploading our app with in-app ads to the Microsoft Store.
The approval process on Ads Jumbo is fast to me. My app was approved on the day I submitted it on Ads Jumbo. While waiting for approval, we can also first do a test so that we can visualise the ads positioning in our app, as shown below.
We should test to see how the ads would be positioned before publishing it.
Yup, that’s all about my journey of getting my first Windows 10 UWP app on the Microsoft Store. Please download it now and let me know what you think. Thank you!