Modern Data Warehouse with Azure

This month marks my third year in port and logistics industry.

In April, I attended a talk organised by NUS Business School on the future-ready supply chain. The talk is delivered by Dr Robert Yap, the YCH Group Executive Chairman. During the talk, Dr Yap mentioned that they innovated to survive because innovation was always at the heart of their development and growth. To him and his team, technology is not only an enabler for the growth of their business, but also a competitive advantage of the YCH Group.

In YCH Group, they have a vision of integrating the data flows in the supply chain with their unique analytics capabilities so that they can provide a total end-to-end supply chain enablement and transformation. Hence, today I’d like to share about how, with Microsoft Azure, we can build a data pipeline and modern data warehouse which helps to enable logistics companies to gear towards a future-ready supply chain.

Dr Yap shared about the The 7PLâ„¢ Strategy in YCH Group.

Two months ago, I also had the opportunity to join an online workshop to learn from Michelle Xie, Microsoft Azure Technical Trainer, about Azure Data Fundamentals. The workshop consists of four modules. In the workshop, we learnt core data concepts, relational and non-relational data offerings in Azure, modern data warehouses, and Power BI. Hence, I will share with you what I have learned in the workshop in this article as well.

About Data

Data is a collection of facts, figures, descriptions, and objects. Hence, data can be texts written on papers, or it can be in digital form and stored inside the electronic devices, or it could be facts that are in our mind. Data can be classified as follows.

Unstructured data like image is frequently used in combination with Machine Learning or Azure Cognitive Services capabilities to extract data.

ETL Data Pipeline

To build an data analytical system, we normally will have the following steps in a data pipeline to perform ETL procedure. ETL stands for Extract, Transform and Load. ETL loads data first into the staging storage server and then into the target storage system, as shown below.

ETL procedure in a data processing pipeline.
  • Data Ingestion: Data is moved from one or many data sources to a destination where it can be stored and further analysed;
  • Data Processing: Sometimes the raw data may not in the format suitable for querying. Hence, we need to transform and clean up the data;
  • Data Storage: Once the raw data has been processed, all the cleaned and transformed data will be stored to different storage systems which serve different purposes;
  • Data Exploration: A way of analysing performance through graphs and charts with business intelligence tools. This is helpful in making informed business decisions.
A map in the Power BI report showing the location of a prime mover within a time period.

In the world of big data, raw data often comes from different endpoints and the data is stored in different storage systems. Hence, there is a need of a service which can orchestrate the processes to refine these enormous stores of raw data into actionable business insights. This is where the Azure Data Factory, a cloud ETL service for scale-out serverless data integration and data transformation, comes into picture.

There are two ways of capturing the data in the Data Ingestion stage.

The first method is called the Batch Processing where a set of data is first collected over time and then fed into an analytics system to process them in group. For example, the daily sales data collected is scheduled to be processed every midnight. This is not just because midnight is the end of the day but also because the business normally ends at night and thus midnight is also the time when the servers are most likely to have more computing capacity.

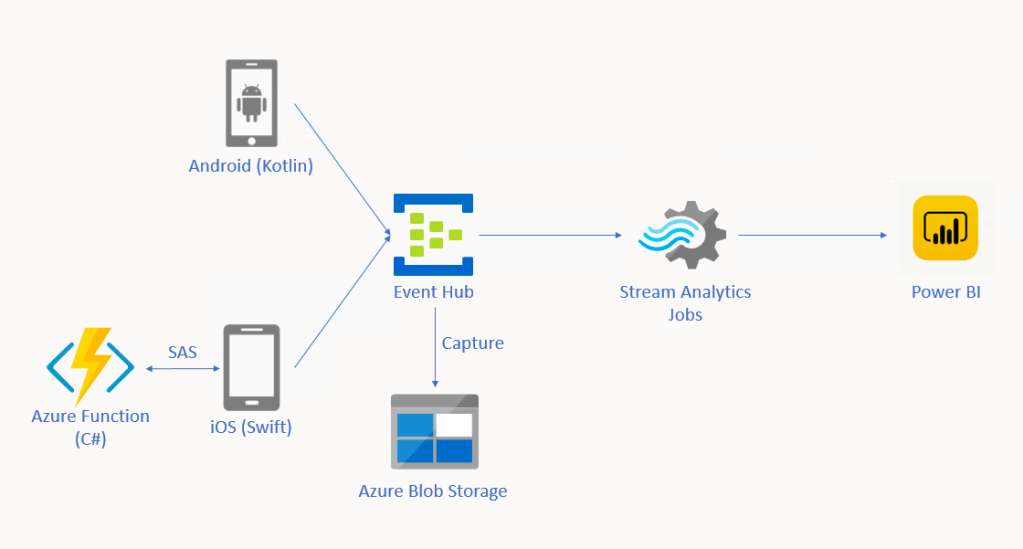
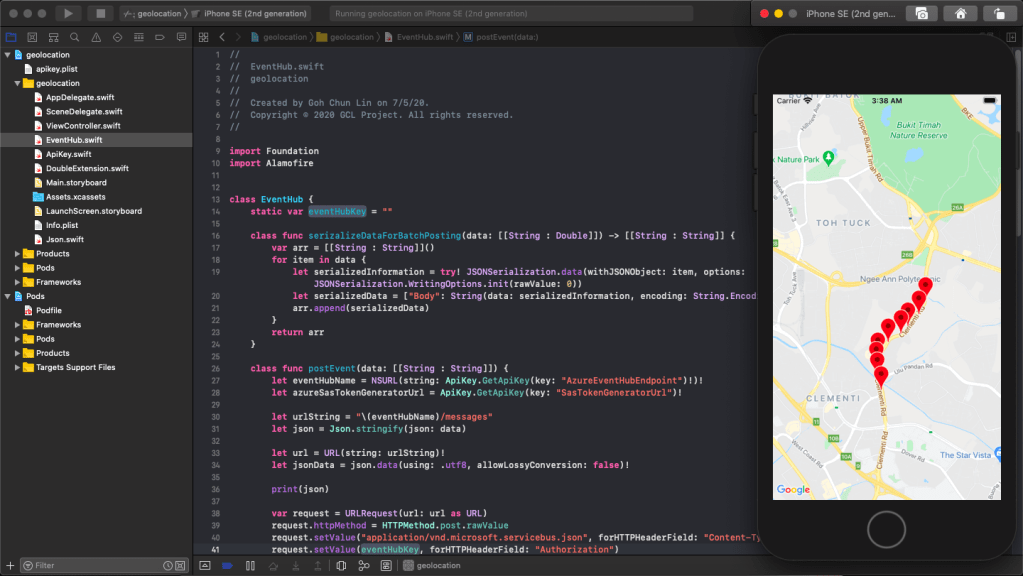
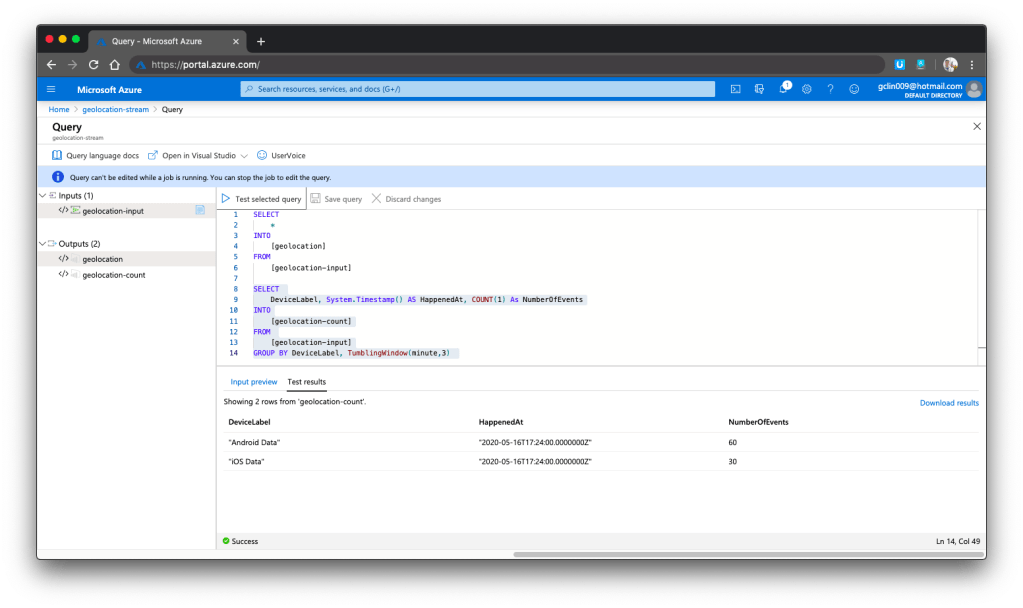
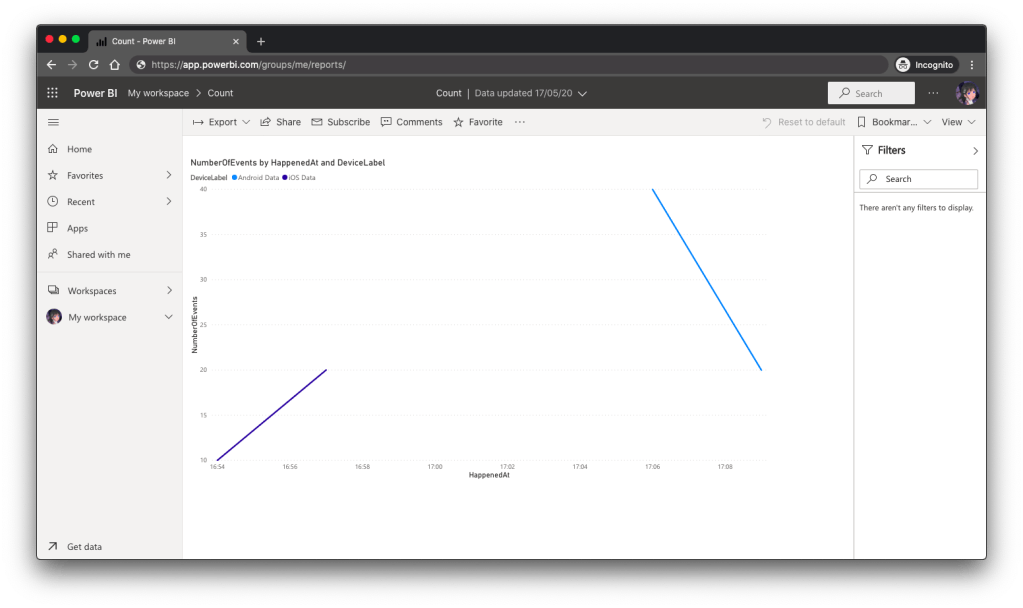
Another method will be Streaming model where data is fed into analytics tools as it arrives and the data is processed in real time. This is suitable for use cases like collecting GPS data sent from the trucks because every piece of new data is generated in continuous manner and needs to be sent in real time.

Modern Data Warehouse

A modern data warehouse allows us to gather all our data at any scale easily, and to get insights through analytics, dashboard, and reports. The following image shows the data warehouse components on Azure.

Architecture diagram
Azure modern data warehouse architecture. (Image Source: Azure Docs)

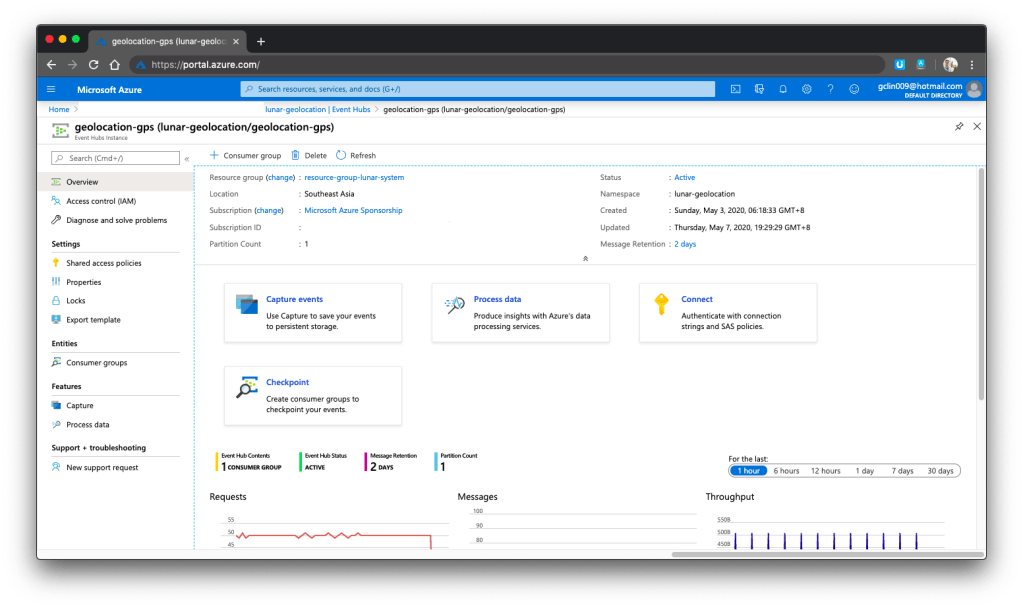
For a big data pipeline, the data is ingested into Azure through Azure Data Factory in batches, or streamed near real-time using Apache Kafka, Event Hub, or IoT Hub. This data will then land in Azure Data Lake Storage long term persisted storage.

The Azure Data Lake Storage is an enterprise-wide hyper-scale repository for large volume of raw data. It is a suitable staging storage for our ingested data before the data is converted into a format suitable for data analysis. Thus, it can store any data in its native format, without requiring any prior transformations. Data Lake Storage can be accessed from Hadoop with the WebHDFS-compatible REST APIs.

As part of our data analytics workflow, we can use Azure Databricks as a platform to run SQL queries on the data lake and provide results for the dashboards in, for example, PowerBI. In addition, Azure Databricks also integrates with the MLflow machine learning platform API to support the end-to-end machine learning lifecycle from data preparation to deployment.

In the logistics industry, the need to store spatial data is greater than ever.

Let’s say a container trucking company collects data about each container delivery through an IoT device installed on the vehicle. Information such as the location and the speed of the prime mover is constantly sent from the IoT device to Azure Event Hub. We then can use Azure Databricks to correlate of the trip data, and also to enrich the correlated data with neighborhood data stored in the Databricks file system.

In addition, to process large amount of data efficiently, we can also rely on the Azure Synapse Analytics, which is basically an analytics service and a cloud data warehouse that lets us scale, compute, and store elastically and independently, with a massively parallel processing architecture.

Finally, we have Azure Analysis Services, which is an enterprise-grade analytics engine as a service. It is used to combine the data, define metrics, and secure the data in a single, trusted tabular semantic data model with enterprise-grade data models. As mentioned by Christian Wade, the Power BI Principal Program Manager in Microsoft, in March 2021, they have brought Azure Analysis Services capabilities to Power BI.

Pricing tiers available for Azure Analysis Services.

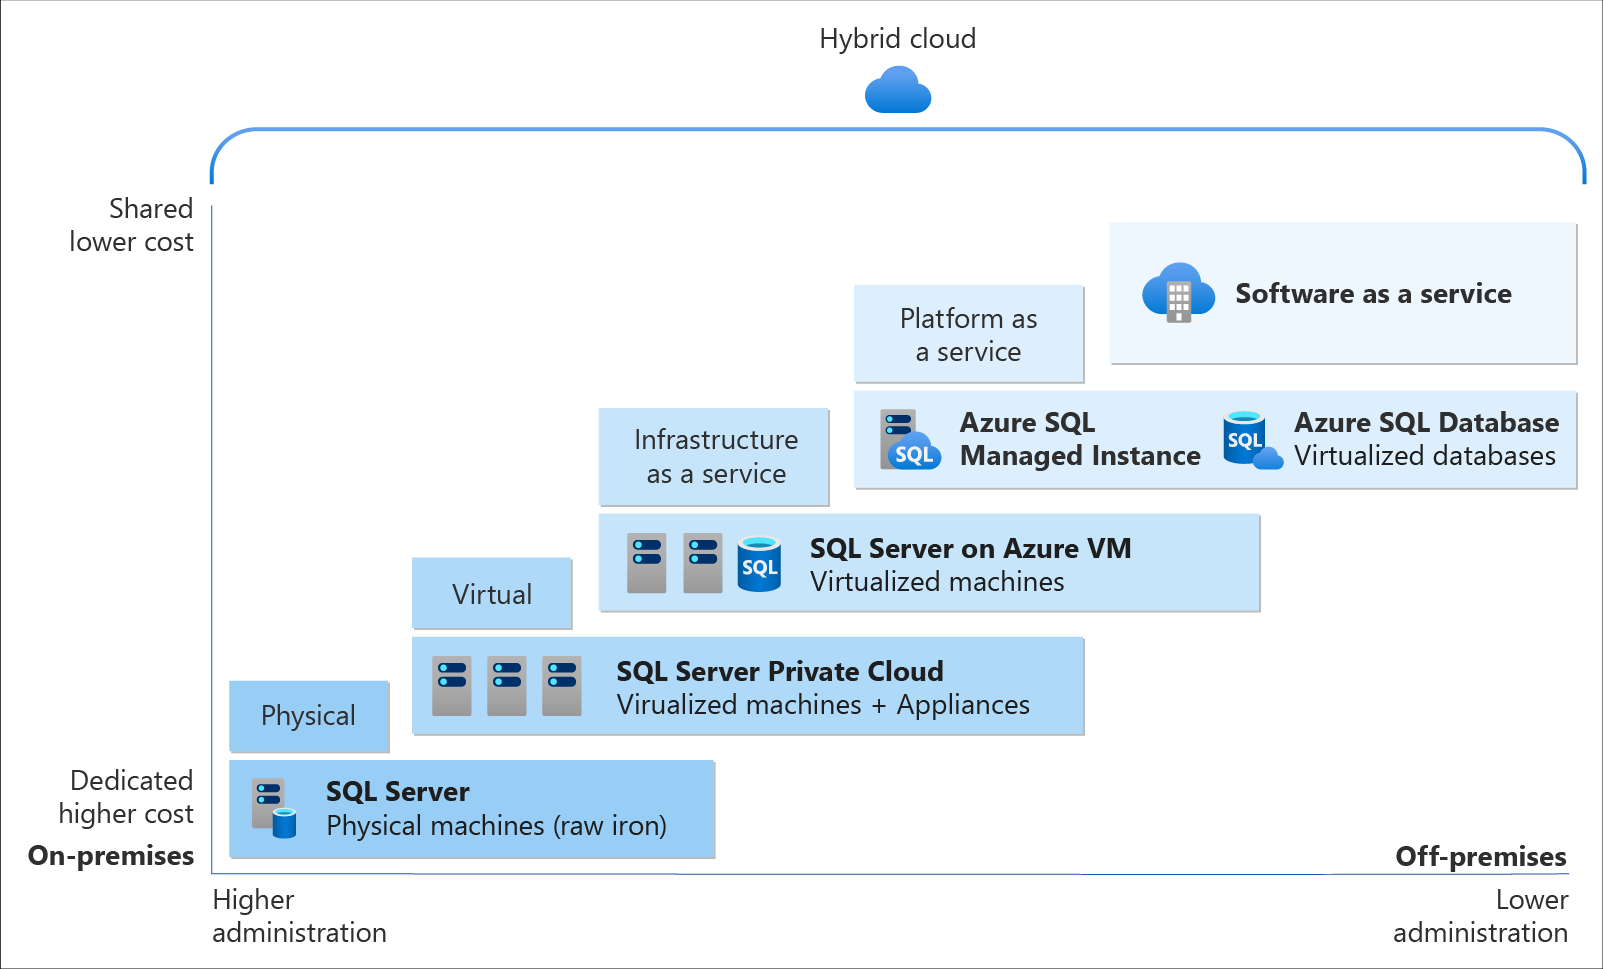
Relational Database Deployment Options on Azure and HOSTING COST

On Azure, there are two database deployment options available, i.e. IaaS and PaaS. IaaS option means that we have to host our SQL server on their virtual machines. For PaaS approach, we are able to either use Azure SQL Database, which is considered as DBaaS, or Azure SQL Managed Instance. Unless there is a need for the team to have OS-level access and control to the SQL servers, PaaS approach is normally the best choice.

Both PaaS and IaaS options include base price that covers underlying infrastructure and licensing. In IaaS, we can reduce the cost by shutting down the resources. However, in PaaS, the resources are always running unless we drop and re-create our resources when they are needed.

Cloud SQL Server options: SQL Server on IaaS, or SaaS SQL Database in the cloud.
The level of administration we have over the infrastructure and by the degree of cost efficiency. (Image Source: Azure Docs)

SQL Managed Instance is the latest deployment option which enables easy migration of most of the on-premises databases to Azure. It’s a fully-fledged SQL instance with nearly complete compatible with on-premise version of SQL server. Also, since SQL Managed Instance is built on the same PaaS service infrastructure, it comes with all PaaS features. Hence, if you would like to migrate from on-premise to Azure without management overhead but at the same time you require instance-scoped features, such as SQL Server Agent, you can try the SQL Managed Instance.

Andreas Wolter, one of the only 7 Microsoft Certified Solutions Masters (MCSM) for the Data Platform worldwide, once came to Singapore .NET Developers Community to talk about the SQL Database Managed Instance. If you’re new to SQL Managed Instance, check out the video below.

Spatial Data Types

Visibility plays a crucial role in the logistics industry because it relates to the ability of supply chain partners to be able to access and share operation information with other parties. Tracking the asset locations with GPS is one of the examples. However, how should we handle the geography data in our database?

Spatial data, also known as geospatial data, is data represented by numerical values in a geographic coordinate system. There are two types of spatial data, i.e. the Geometry Data Type, which supports Euclidean flat-earth data, and the Geography Data Type, which stores round-earth data, such as GPS latitude and longitude coordinates.

In Microsoft SQL Server, native spatial data types are used to represent spatial objects. In addition, it is able to index spatial data, provide cost-based optimizations, and support operations such as the intersection of two spatial objects. This functionality is also available in Azure SQL Database and Azure Managed Instances.

geom_hierarchy
The geometry hierarchy upon which the geometry and geography data types are based. (Image Source: SQL Docs)

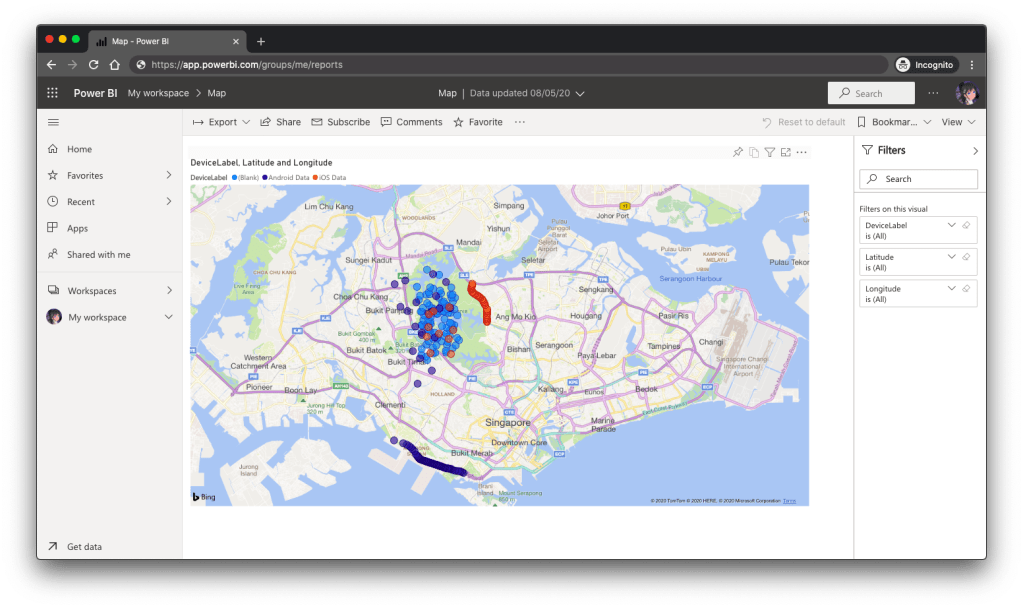
Let’s say now we want to find the closest containers to a prime mover as shown in the following map.

The locations of 5 containers (marked as red) and location of the prime mover (marked as blue).

In addition, we have a table of container positions defined with the schema below.

CREATE TABLE ContainerPositions
(
    Id int IDENTITY (1,1),
    ContainerNumber varchar(13) UNIQUE,
    Position GEOGRAPHY
);

We can then simply use spatial function as shown below like STDistance, which will return the shortest distance between the two geography locations, in our query to sort the containers having the shortest to the longest distance from the prime mover.

The container “HKXU 200841-9” is the nearest container to the prime mover.

In addition, starting from version 2.2, Entity Framework Core also supports mapping to spatial data types using the NetTopologySuite spatial library. So, if you are using EF Core in your ASP .NET Core project, for example, you can easily get the mapping to spatial data types.

In the .NET Conference Singapore 2018, we announced the launch of Spatial Extension in EF Core 2.2.

Non-Relational DatabaseS on Azure

Azure Table Storage is one of the Azure services storing non-relational structured data. It provides a key/attribute store with a schema-less design. Since it’s a NoSQL datastore, it is suitable for datasets which do not require complex joins and can be denormalised for fast access.

Each of the Azure Table Storage consists of relevant entities, similar to a database row in RDBMS. Then each entity can have up to 252 properties to store the data together with a partition key. Entities with the same partition key will be stored in the same partition and the same partition server. Thus, entities with the same partition key can be queried more quickly. This also means that batch processing, the mechanism for performing atomic updates across multiple entities, can only operate on entities stored in the same partition.

In Azure Table Storage, using more partitions increases the scalability of our application. However, at the same time, using more partitions might limit the ability of the application to perform atomic transactions and maintain strong consistency for the data. We can then make use of this design to store, for example, data from each of the IoT devices in a warehouse, into different partition in the Azure Table Storage.

For a larger scale of the system, we can also design a data solution architecture that captures real-time data via Azure IoT Hub and store them into Cosmos DB which is a fast and flexible distributed database that scales seamlessly with guaranteed latency and throughput. If there is existing data in other data sources, we can also import data from data sources such as JSON files, CSV files, SQL database, and Azure Table storage to the Cosmos DB with the Azure Cosmos DB Migration Tool.

Azure Cosmos DB Migration Tool can be downloaded as a pre-compiled binary.

Globally, supply chain with Industry 4.0 is transformed into a smart and effective procedure to produce new outlines of income. Hence, the key impression motivating Industry 4.0 is to guide companies by transforming current manual processes with digital technologies.

Hard-copy of container proof of delivery (POD), for example, is still necessary in today’s container trucking industry. Hence, storing images and files for document generation and printing later is still a key feature in the digitalised supply chain workflow.

Proof of Delivery is now still mostly recorded on paper and sent via email or instant messaging services like Whatsapp. There is also no acceptable standard for what a proof of delivery form should specify. Each company more or less makes up their own rules.

On Azure, we can make use of Blob Storage to store large, discrete, binary objects that change infrequently, such as the documents like Proof of Delivery mentioned earlier.

In addition, there is another service called Azure Files available to provide serverless enterprise-grade cloud file shares. Azure Files can thus completely replace or supplement traditional on-premises file servers or NAS devices.

Hence, as shown in the screenshot below, we can upload files from a computer to the Azure File Share directly. Then the files will be accessible in another computer which is also connected to the Azure File Share, as shown below.

We can mount Azure File Share on macOS, Windows, and even Linux.

The Data Team

Setting up a new data team, especially in a startup, is a challenging problem. We need to explore roles and responsibilities in the world of data.

There are basically three roles that we need to have in a data team.

  • Database Administrator: In charge of operations such as managing the databases, creating database backups, restoring backups, monitoring database server performance, and implementing data security and access rights policy.
    • Tools: SQL Server Management Studio, Azure Portal, Azure Data Studio, etc.
  • Data Engineer: Works with the data to build up data pipeline and processes as well as apply data cleaning routine and transformations. This role is important to turn the raw data into useful information for the data analysis.
    • Tools: SQL Server Management Studio, Azure Portal, Azure Synapse Studio.
  • Data Analysis: Explores and analyses data by creating data visualisation and reporting which transforms data into insights to help in business decision making.
    • Tools: Excel, Power BI, Power BI Report Builder

In 2016, Gartner, a global research and advisory firm, shared a Venn Diagram on how data science is multi-disciplinary as shown below. Hence, there are some crucial technical skills needed, such as statistics, querying, modelling, R, Python, SQL, and data visualisation. Besides the technical skill, the team also needs to be equipped with business domain knowledge and soft skills.

The data science Venn Diagram. (Image source: Gartner)

In addition, the data team can also be organised in two manners, according to Lisa Cohen, Microsoft Principal Data Science Manager.

  • Embedded: The data science teams are spread throughout the company and each of the teams serves specific functional team in the company;
  • Centralised: There will be a core data team providing services to all functional teams across the company.

References

Building Driver Tracking System with Eventing in Microsoft Azure

Recently due to the coronavirus pandemic, ordering food from online platform becomes one of the popular choices here. Drivers will deliver the food to us without us leaving our house to pickup the food from the restaurants.

The drivers are all equipped with a smart phone that will send I’m not sure how those online food ordering platforms design their backend system to track the drivers. However, today I’d like to suggest how we can build such driver tracking system with Azure Event Hub and Stream Analytics.

The Traditional Approach

Previously, the approach that I took to build such system by building a Web API which provides endpoints for the mobile devices (assuming to be only Android and iOS) to send the GPS data to. Then our Web API will save the data to CosmosDB, which is a good choice for any serverless application that needs low order-of-millisecond response times.

However, this approach is costly in terms of hosting and maintainability, especially with the expensive CosmosDB even though there is now a free tier available for CosmosDB starting March 2020. Also it is not scalable unless we spent extra time working on the infrastructure to load balance the Web APIs and the reporting servers.

So, let’s see how we can use the robust Azure services and Microsoft tools to help us build a better tracking system.

Eventing in Azure

As we all know, GPS reporting of drivers in delivery industry needs real-time processing and the volume of data is always huge to a certain level that there are millions of events happening in every second.

Hence, in this article, I’d like to share with you all an alternative, which is cheaper (unfortunately, not free) and more scalable with higher maintainability.

🎨  Alternative solution for driver tracking system with Eventing in Microsoft Azure. 🎨 

In this approach, we will be using tools such as Event Hub, Stream Analytics, and Power BI. There is also Azure Function needed for iOS side which I will explain why later in this article.

Event Hub

As shown in the diagram above, we remove the needs of building the API endpoints and maintaining a reporting module ourselves. Instead, we have Event Hub, a serverless Big Data streaming platform and event ingestion service which can provide real-time event processing and is able to stream million of events per second. Since it’s a serverless setup, we don’t need to provision server resources to handle the events and we also don’t have to pay for large upfront infrastructure cost.

🎨  One of my event hubs that is receiving geolocation data from the mobile devices. 🎨 

Since Event Hub is an open multi-platform, it accepts a range of input methods. So later we shall see how data can be sent to Event Hub from both Android app and iOS app directly.

Event Hub Namespace Throughput Unit

There is a very interesting property in Event Hub Namespace called the Throughput Unit (TU), which is the amount of work that we want to assign to the namespace.

1 TU gives us 1MB/s ingress or 1,000 events/s and 2MB/s outgress or 2,000 events/s. We can scale our namespace up to 20 TUs.

🎨  Scaling the event hub namespace by its TU. 🎨 

In the screenshot above, we can see that there is also a functionality to auto-inflate our namespace which will auto scale-up the TU to a defined limit. This is good for handling sudden peak in volume. However, take note that there is no auto-deflate, so once the TU goes up, we need to use another way to scale it down when the peak is over.

One more thing to take note here is that the TU is shared among the Event Hubs under the namespace.

Capture in Event Hub

By default, Event Hub can store the data for one day. We can adjust it to be the maximum, which is 7 days (in Standard pricing tier only). This is to remind us that Event Hub should not be used as a data storage.

However, with the easy integration of Event Hub with the Azure Stream Analytics, Event Hub can serve as input of the Stream Analytics and output the data to places such as Power BI for data analysis and visualisation or SQL / Azure Storage for data storage.

In addition, we can also enable the Capture function in Event Hub. Capture will automatically persist the data to Azure Storage with no administrative cost. This is the easiest way to load streaming data into Azure without the need of Stream Analytics. The captured streaming data will be stored in the AVRO format which has the data serialised in a compact binary format.

🎨  Viewing the captured streaming data in Azure Storage on the portal. 🎨 

Mobile Clients

Now with the Event Hub setup, we will proceed to discuss how we can send data from our mobile devices to the Event Hub.

🎨  “Driving” on iOS Google map. 🎨 

Unfortunately, there are very little documentation about how to do this online, especially on Kotlin/Swift + Event Hub. Hence, I hope this article can help somebody out there who are interested in similar approach.

Since during the coronavirus pandemic, we are advised not to leave our house so how do I test in such a situation? I thus decide to cheat a bit here. Instead of using the actual mobile location, I will be running my apps on the emulator/simulator. What the apps do is then collecting the latitude and longitude of the points that I click on the app and send them to the Event Hub.

Connecting Android App with Event Hub

GitHub Repo: https://github.com/goh-chunlin/Lunar.Geolocation.Android

In the system, we have both Android and iOS mobile devices that will send GPS data of the users to the Event Hub. For the Android, I will be using Kotlin because it’s the modern recommended way of developing Android app.

If you are interested in using Java, Microsoft has a documentation for connecting Android app to Event Hub in Java. So far I still can’t find Microsoft documentation on using Kotlin to do this task, hence I will be using Kotlin.

Having said that, I will still be using the existing Java client library for Event Hub from the repository. However, there are a few configurations we need to take care of in order to use this Java library.

Firstly, we will add the dependency to the project as follows in the build.gradle of the app.

dependencies {
    ...
    implementation 'com.azure:azure-messaging-eventhubs:5.0.3'
    ...
}

Secondly, there is a need to make adjustment to our gradle file to specify the compatibility of Java in the compileOptions as shown below.

compileOptions {
sourceCompatibility JavaVersion.VERSION_1_8
targetCompatibility JavaVersion.VERSION_1_8
}

Without doing so, it will complain that no methods found for the Event Hub.

Thirdly, there are two markdown files in conflict after we add the library to the project. We can fix that by doing pickFirst.

packagingOptions {
pickFirst 'META-INF/LICENSE.md'
pickFirst 'META-INF/NOTICE.md'
}
🎨 Geolocation data will be sent in batches. 🎨

Another thing why we choose Event Hub is that it allows us to send data in batches. The following function shows how to send data in batch to the Event Hub.

private fun sendLatitudeAndLongitudeDataToAzure() {
    var producer = EventHubClientBuilder()
        .connectionString(BuildConfig.AZURE_EVENT_HUB_CONNECTION_STRING, BuildConfig.AZURE_EVENT_HUB_NAME)
        .buildProducerClient()

    val batch = producer.createBatch()

    recentLatitudeAndLongitudeRecords.forEach {
        batch.tryAdd(EventData(it))
    }

    if (batch.count > 0) {
        producer.send(batch)
    }

    producer.close()
}

The variable recentLatitudeAndLogitudeRecords is a collection of all recent latitude and longitude data collected by the device. In my demo code, which is not shown above, I make it to hold 10 records. So in just one send command, 10 geolocation records will be sent altogether to the Event Hub. The devices thus do not need to make multiple connections to the server to send multiple records.

I only highlighted the key points here for programming an Android app in Kotlin to connect to the Azure Event Hub. The complete demo code is available on GitHub for those who want to find out more about how we can integrate Event Hub in Android projects.

Connecting iOS App with Event Hub

GitHub Repo: https://github.com/goh-chunlin/Lunar.Geolocation.iOS

We should be glad that there is still Event Hub documentation and library available for Android platform because for iOS, there is basically nothing, not even an Event Hub SDK for iOS from Microsoft.

Luckily, there is an excellent blog post on how to connect iOS app to Event Hub written by Luis Delgado back in April 2016. Hmm… 2016? That was written when the President of the USA was still Barack Obama! As we can see, that article is quite outdated so I decided to write down a newer approach on how I do it with Swift 5.

🎨  Barack Obama served as the 44th president of the United States from 2009 to 2017. (Image Credit: CBS News) 🎨 

Since there is no Event Hub SDK for iOS, we have to use its REST APIs instead. For using Event Hub REST APIs, we first need to programmatically generate a SAS (Shared Access Signature) token in order to call the APIs.

This is where the Azure Function comes into picture. In Luis’ blog post, he setup an Azure Web App to host a NodeJS application which will generate SAS token. To be more cost effective, we will be using Azure Function with a short and sweet C# code as shown in the Microsoft documentation.

🎨  Simple C# code to generate SAS token (Please refer to my GitHub repo and its README file for the complete code). 🎨 

With this, then we can then use Alamofire, an HTTP networking library, to make a request to the Azure Event Hub. To send batch data, we first need to make sure the message body to have a valid JSON payload, which is something as follows.

[
{"Body": "<stringify of the record 01 JSON object to send>"}, 
{"Body": "<stringify of the record 02 JSON object to send>"}, 
...
]

We then also need to make sure we have set the Content-Type header to “application/vnd.microsoft.servicebus.json”. For more details, please refer to the Microsoft documentation on sending batch data.

Of course, here I also highlight only the key points to successfully send event data in batch from iOS using Swift 5 to Azure Event Hub. If you would like to find out more, I have my entire demo project for this available on my GitHub repository, please review it.

🎨 Running the app which is sending data to the Event Hub on iPhone simulator. 🎨

Stream Analytics

With the events sent from the mobile devices to the Event Hub, we now can link the Event Hub with the Stream Analytics. Take note that Stream Analytics is just one of the many ways of pulling data from the Event Hub. For example, if you are familiar with Apache Storm, you can link it up with that too.

Stream Analytics is a real-time analytics and complex event-processing engine that is designed to analyse and process high volumes of fast streaming data from multiple sources simultaneously. Besides Event Hub, it can also accept inputs from IoT devices or Blob Storage.

The reason why we choose Stream Analytics in our solution is that it requires no upfront infrastructure setup and it is easy to configure and scale.

Consumer Groups in Event Hub

The publish/subscribe mechanism of Event Hubs is enabled through consumer groups. Hence, when we are creating a new Stream Analytics Job, we need to specify the consumer group that we are going to use.

Consumer groups enable multiple consuming applications to each have a separate view of the event stream, and to read the data stream independently. Hence, it is recommended to create a new consumer group for each Stream Analytics Job.

Stream Analytics Query

One exciting feature in the Stream Analytics is the query of data. Stream Analytics has a SQL-like query language which accepts user-defined functions written in JavaScript.

The Stream Analytics accepts multiple inputs and multiple outputs with multiple queries. In our scenario, we have one input from the Event Hub and two outputs to two different datasets on the Power BI.

One dataset is to show all the data points collected by the mobile devices. We will use this dataset to plot the places visited by the drivers on a map. Another dataset will be showing the number of points collected in each mobile device.

Hence, we have the following queries in our Stream Analytics.

SELECT *
INTO [geolocation]
FROM [geolocation-input]

SELECT DeviceLabel, System.Timestamp() AS HappenedAt, COUNT(1) As NumberOfEvents
INTO [geolocation-count]
FROM [geolocation-input]
GROUP BY DeviceLabel, TumblingWindow(minute,3)  

The first query is very straight-forward. What is interesting is the second query where TumblingWindow is used. Tumbling windows are a series of fixed-sized, non-overlapping and contiguous time intervals. So what the query does is using the Aggregate Function Count() over the time window to count the number of data points collected in each device (identified with DeviceLabel) within the 3-minute time window. For more information about the Time Management in Stream Analytics, please read its documentation.

Another interesting point in the second query is the HappenedAt field. It gets its value from System.Timestamp(). In Stream Analytics, every event that flows through the system comes with a timestamp that can be accessed via System.Timestamp(). In our case, since we are using Event Hub, this time is the timestamp given by the Event Hub.

We can now test run the queries above on the Azure Portal, as shown in the screenshot below.

🎨  We can choose to test only the selected query and view its test results. 🎨 

Here, there are additional two things that I’d like to highlight.

Firstly, the data format that we sent to Event Hub is very important. Sometimes it is possible that the Event Hub can receive the messages but due to the wrong format in the messages, Stream Analytics cannot take them as inputs and there will be warning shown in the Overview page of the Stream Analytics.

Secondly, to view detailed logs so that we can better understand what’s happening in Stream Analytics when something goes wrong, it is important to understand how to debug using its Activity Log page and monitor its activities with Azure Monitor.

Data Visualisation with Power BI

Now, let’s see some colourful graphs.

In Power BI, with our setup above in the Stream Analytics, it should now show two datasets.

Firstly, we have the map in Power BI using the first dataset to show the location of the drivers. There are some data points having blank Device ID because it is a new field I added after I setup the first dataset in the Stream Analytics.

🎨  Map showing the driver locations using results returned from the first query in Stream Analytics. 🎨 

Secondly, we can also visualise the results returned from the second dataset using the Line Chart in Power BI, as shown below.

🎨  The second driver starts work after the first driver. 🎨 

Conclusion

So, what do you think about my alternative above? In fact, there are other ways of doing this as well. There is one more alternative that requires Azure Time Series Insights service which I will be researching. Hopefully I can have time to blog about it soon.

If you have any other better solution, feel free to let me know in the comment section. I may not have time to try all of them out but it may help other developers to find out more alternatives. Thank you in advance!

🎨  If you have a good suggestion to share, let’s discuss over a meal. 🎨