I like to explore interesting new technologies. I also love to learn more from the materials available on Microsoft Virtual Academy, Google Developers channel, and several other tech/dev events.
When a role instance is brought online by Windows Azure, the OnStart method will be called and the role instance will be marked as Busy. Azure Load Balancer thus will not direct traffic to the role instance. Hence, having more than one role instance actually help on keeping the website accessible while deploying new code to the site.
If we are going to use load balancing in our ASP .NET web applications, Session State can no longer be kept in memory of an instance. Instead, the Sessions need to be stored in SQL Server or State Server. Those are the three popular Session-State Modes available, i.e. InProc, SQLServer, and StateServer.
Now, with Azure Redis Cache, we can use the 4th option, the Custom mode, to store Session State values.
First of all, we need to download RedisSessionStateProvider from Nuget so that all necessary assembly references will be added automatically to our web application project. In addition, there will be new lines added to web.config, as shown below, to help us get started with Redis Cache Session State Provider.
As shown in the commented section, we need to provide values to a few attributes before we can use the Redis Cache. Those values can be easily found on the new Azure Preview Portal. So, a complete configuration should be as follows.
Yup, that’s all. We can now happily use Redis Cache Session State Provider to make Session variables works well with the load balancing in our web applications. =)
For more information about Redis Cache Session State Provider, please read its documentation.
As a developer working on web applications deployed on the cloud, I am always asked to make sure the applications are always up and running. Hence, it is very important to understand some of the diagnostics resources available for Azure.
Logs
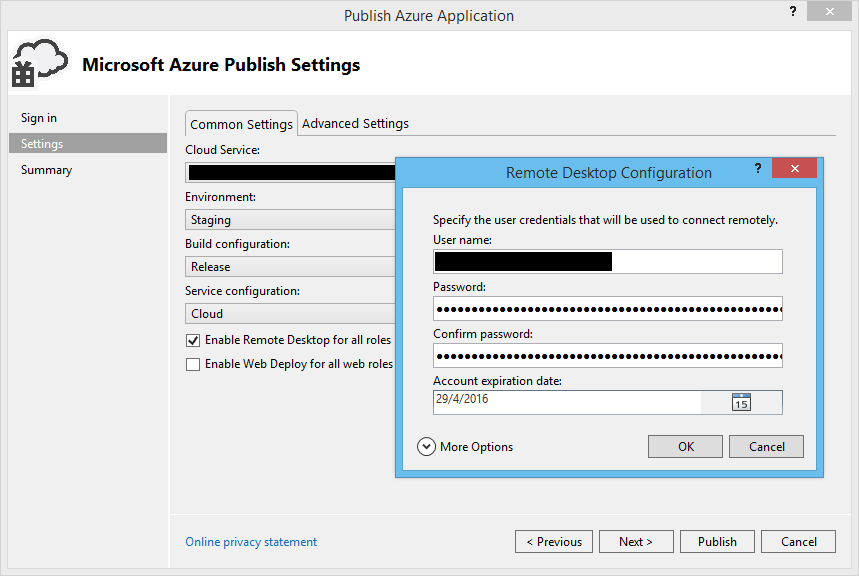
The first thing that comes to my mind is reading the Event Logs and IIS Logs in the VMs. To allow this, we first need to enable Remote Desktop for all roles.
You can enable Remote Desktop for all roles before publish.
This approach should be familiar for those who are using on-premise. So, where to find the log files?
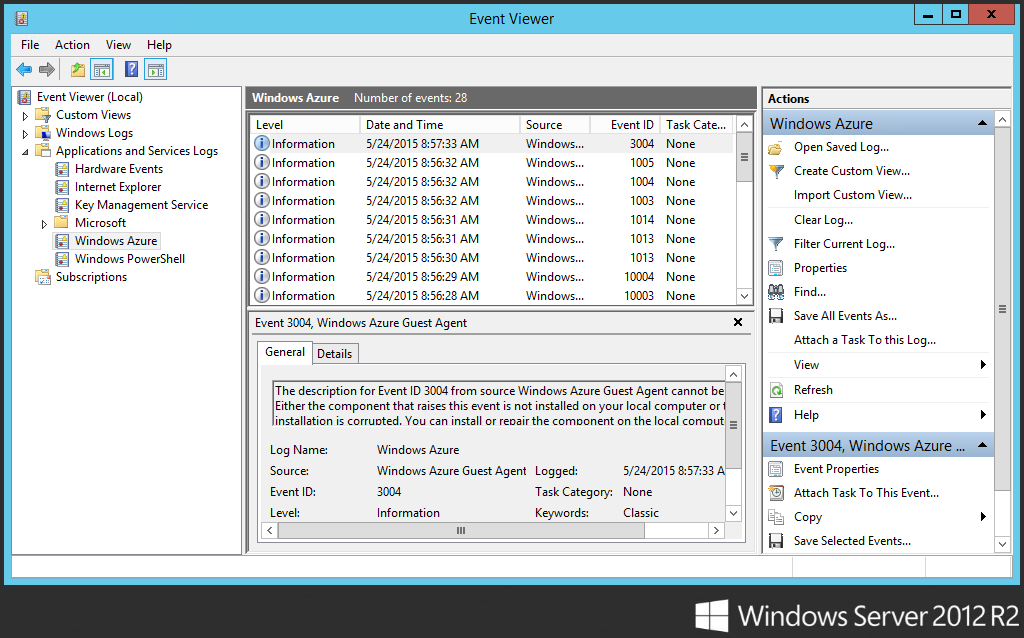
Azure Event Logs: Diagnostic output from the Windows Azure Runtime, including information such as role start/stop, startup tasks, crashes, recycles, etc.
Location of Azure Event Logs
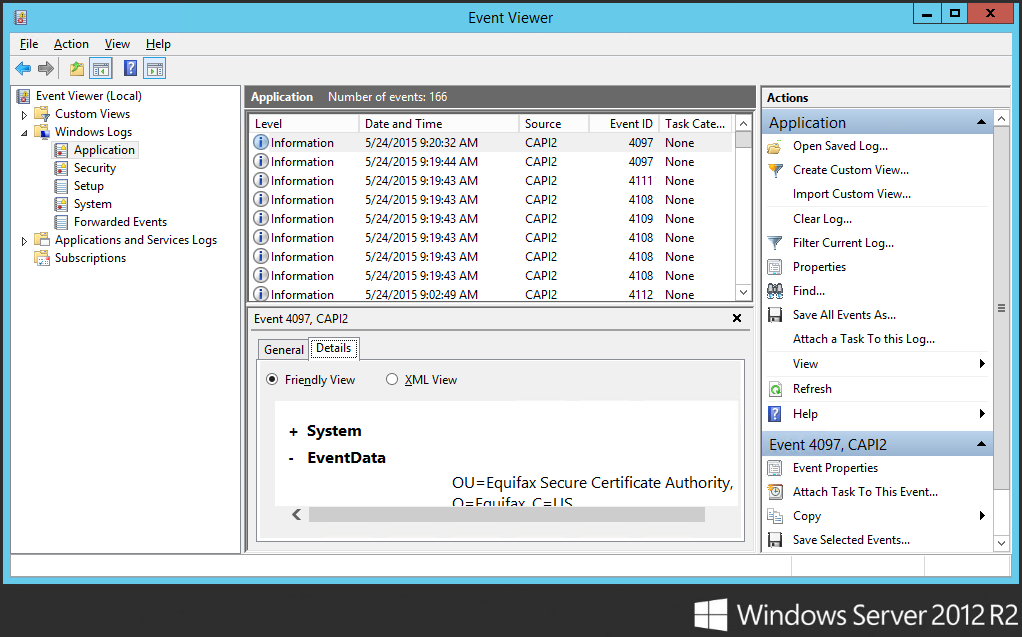
Application Event Logs: Often can find w3wp.exe (a process associated with the application pool in IIS) related errors here.
Location of Application event logs.
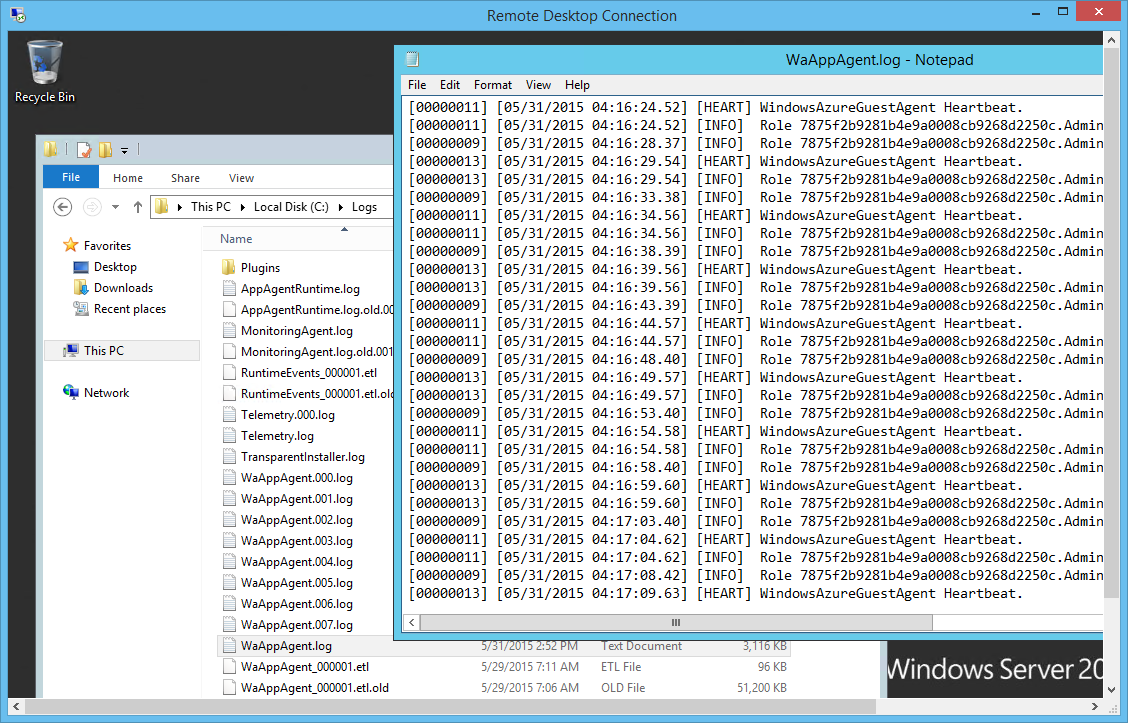
App Agent HeartBeat Logs: Useful for determining the current state of the role within the VM. It can be used to find out the health status of the role in the past as well. These logs are generated by WindowsAzureGuestAgent.exe.
Location of App Agent Heartbeat logs.
When I viewed the App Agent Heartbeat logs two hours after my website went down, I saw the following records in the file.
[00000011] [06/19/2015 05:59:43.37] [HEART] WindowsAzureGuestAgent Heartbeat.
[00000011] [06/19/2015 05:59:43.37] [INFO] Generating substatus from system events.
[00000011] [06/19/2015 05:59:43.37] [INFO] Substatus is Sites are being deployed. [2015-06-19T05:59:42Z]
[00000011] [06/19/2015 05:59:43.37] [INFO] Role 1234f2b2986b4e9a1234cc9268d2250c.MyWebRole_IN_0 isreporting state NotReady with sub-status Starting and details Starting role... Sites are being deployed. [2015-06-19T05:59:42Z].
[00000008] [06/19/2015 05:59:46.64] [INFO] Role 1234f2b2986b4e9a1234cc9268d2250c.MyWebRole_IN_0 has current state Unhealthy, desired state Started, and goal state execution status StartInProgress.
After my website went back online, then I found the following records which marked the role to be healthy then.
[00000011] [06/19/2015 06:00:03.70] [HEART] WindowsAzureGuestAgent Heartbeat.
[00000011] [06/19/2015 06:00:03.70] [INFO] Role 1234f2b2986b4e9a1234cc9268d2250c.MyWebRole_IN_0 is reporting state Ready.
[00000008] [06/19/2015 06:00:06.89] [INFO] Role 1234f2b2986b4e9a1234cc9268d2250c.MyWebRole_IN_0 has current state Started, desired state Started, and goal state execution status StartSucceeded.
App Agent Runtime Logs: If you would like to get an overview of the events happening over time to a role, you can refer to AppAgentRuntime.log in C:\Logs which logs major changes to the role without logging heartbeats.
IIS Logs: To determine whether a problem is caused by the website itself or comes from Azure, it is always good to check the IIS logs first.
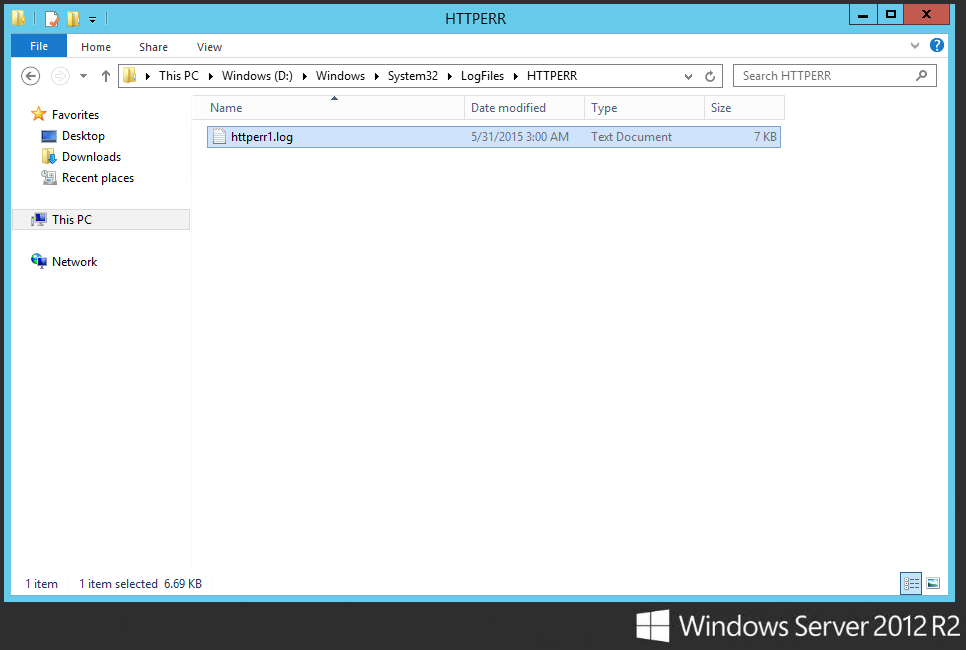
Location of IIS logs: C:\Resources\Directory\{DeploymentID}.{Rolename}.DiagnosticStore\LogFiles\Web
HTTP.SYS Logs: Very important to troubleshoot an issue with a hosted service website not responding. The evidence of, for example, IIS not being able to process the high-volume requests can be found in HTTP.SYS logs.
HTTP.SYS logs can be found here!
Monitoring ASP .NET Web Application with Application Insights
If you would like to have a graphical dashboard with diagrams showing availability, performance, usage, failures, and other events happening on your web apps, please try out Application Insights too.
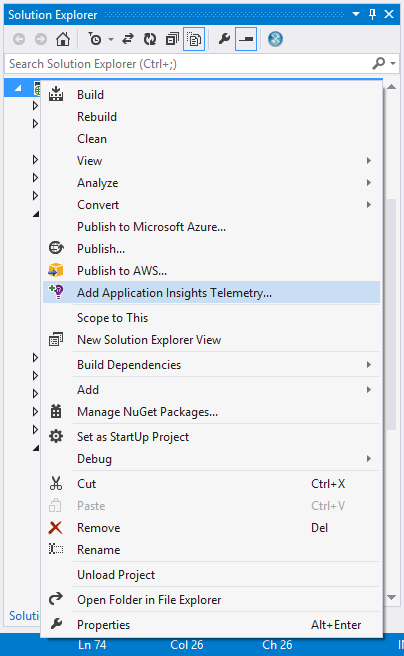
The reason I like it very much because with Visual Studio 2013, Application Insights can be added to the application with just a few clicks.
Just right click your project in Solution Explorer and choose “Add Application Insights Telemetry”.
After Application Insights is successfully added, the ApplicationInsights.config file with an instrumentation key will be added to your project.
However, by doing this, Visual Studio will not add the JavaScript SDK to the web pages of the project. If you are interested to know more about load time and user events, you can proceed to add it. After the JavaScript SDK is successfully added, you should be able to see the following lines of codes in your web pages.
    var appInsights=window.appInsights||function(config){
    function s(config){...}({instrumentationKey:"02gh149f-3ce6-47cf-b49a-6efg14d83928"});

     window.appInsights=appInsights;
     appInsights.trackPageView();
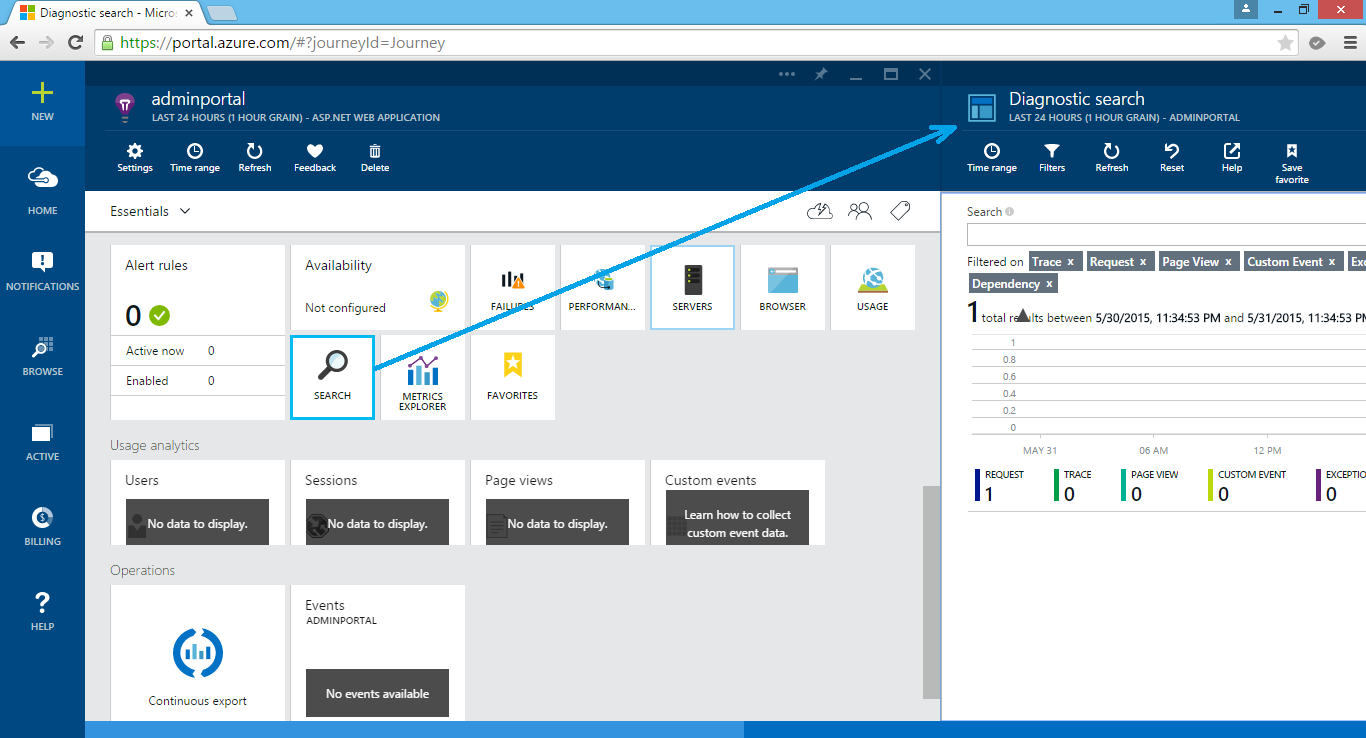
Now, if you right-click on the same project again, you will be able to launch the Application Insights of the project in the new Azure portal.
Application Insights on Azure.
Yup, let’s start improving our web applications based on these useful insights and reports. =)
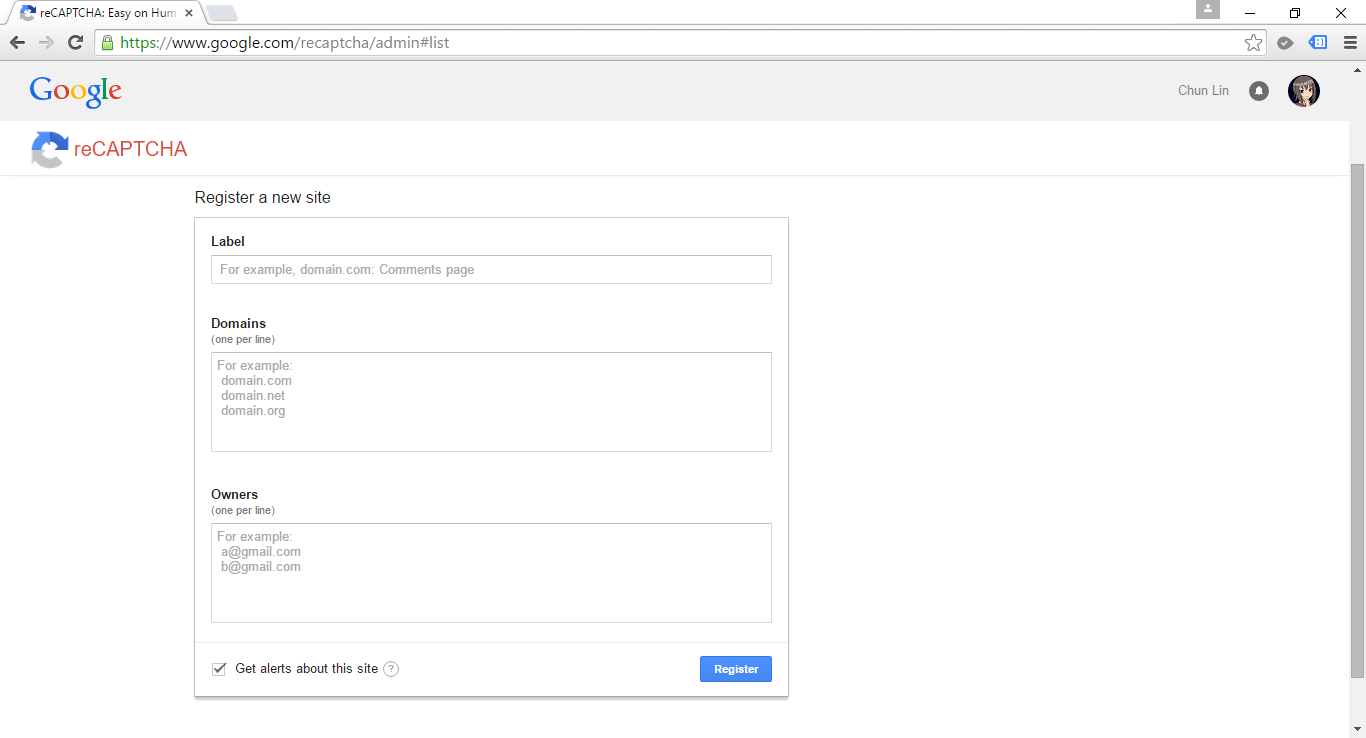
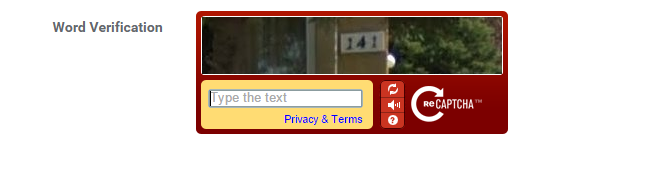
reCAPTCHA is a free Google CAPTCHA service that comes in the form of widget that can be added to websites easily. So, how do we implement reCAPTCHA in our ASP .NET MVC sites?
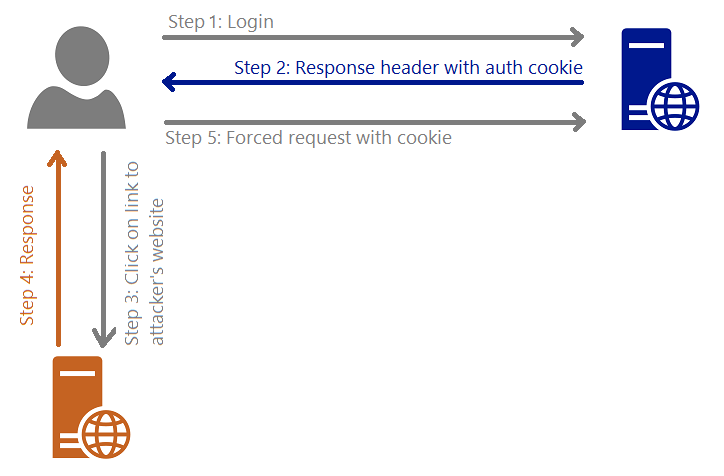
I draw a graph for me to better explain about what XSRF is.
XSRF (Cross-Site Request Forgery)
Steps are as follows.
The user logs in to, for example, a bank website.
The response header from the bank site will contain the user’s authentication cookie. Since authentication cookie is a session cookie, it will only be cleared when the process ends. Thus, until that time, the browser will always include the cookie with each request to the same bank website.
The attacker sends to the user a link and somehow encourage the user to click on it. This causes sending a request to the attacker’s server.
Because of Step 4, the user will be forced to send a request to the bank website to transfer money to attacker’s account with the user’s authentication cookie.
You want to control what is being passed into the binder.
There are two my personal favourite solutions to avoid Over-Posting Attack.
One is using Bind attribute in the controller method. For example, in order to prevent users editing the value of isAdmin when they update their profile, I can do something as follows.
[HttpPost]
public ViewResult Edit([Bind(Exclude = "IsAdmin")] User user)
{
    ...
}
Alternatively, we can also use “Include” to define those fields that should be included in the binding.
Second solution is using view model. For example, the following class will not contain properties such as IsAdmin which are not allowed to be edited in the form post of profile edit.
public class UserProfileUpdateViewModel
{
    public string FirstName { get; set; }
    public string LastName { get; set; }
    ...
}
XSS: Cross-Site Scripting
According to OWASP (Open Web Application Security Project), XSS attacks
…are a type of injection, in which malicious scripts are injected into otherwise benign and trusted web sites… Flaws that allow these attacks are quite widespread and occur anywhere a web application uses input from a user within the output it generates without validating or encoding it.
Kirill Saltanov from NUS is explaining to guests about XSS during 5th STePS event.
There are some cases where our web application should accept HTML tags. For example, we have a <textarea> element in our blogging system where user can write the content of post, then we need to skip the default checking of ASP .NET.
To post HTML back to our Model, we can simply add the [AllowHtml] attribute to the corresponding property in the Model, for example
publicclassBlogPost{
[Key]
public int ID { get; set; }
...
[AllowHtml]publicstring Content { get; set; }}
Then in the View, we will need to use @Html.Raw to tell Razor not to encode the HTML markup.
@Html.Raw(post.Content)
Wait… Won’t this make XSS attack possible in our website? Yup, of course. So, we must be very careful whenever we are trying to bypass the Razor encoding. The solution will then be using AntiXSS encoding library from Microsoft.
Previously in the discussion of XSS, we know that by default ASP .NET throws exception if potentially dangerous content is detected in the request. This is because of the existence of ASP .NET Request Validation.
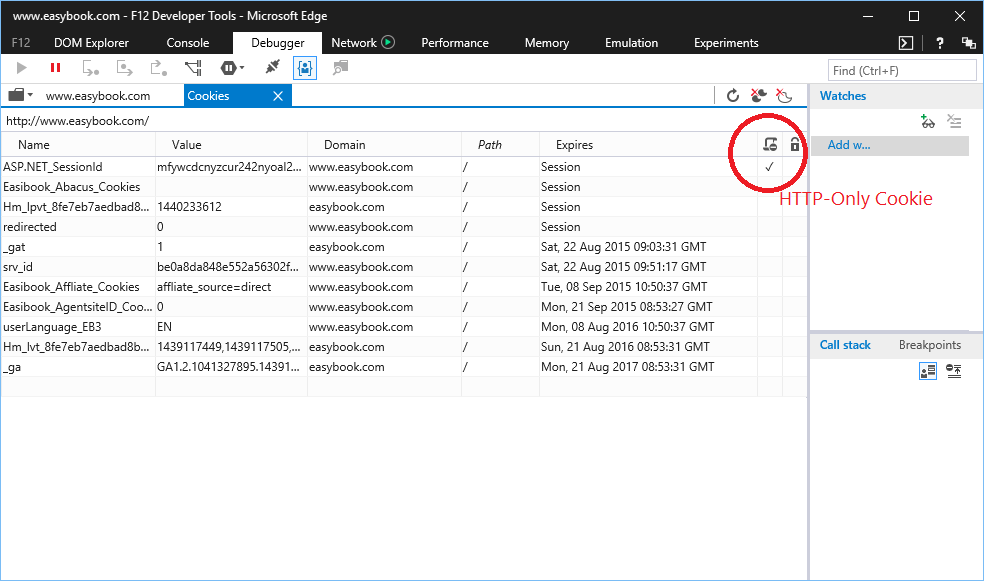
In order to reduce the risk of XSS, popular modern browsers have added a new attribute to cookie called HttpOnly Cookie. This new attribute specifies that a cookie is not accessible through script. Hence, it prevents the sensitive data contained in the cookie can be sent to attacker’s side via malicious JavaScript in XSS attack.
This request has been blocked because sensitive information could be disclosed to third party web sites when this is used in a GET request. To allow GET requests, set JsonRequestBehavior to AllowGet.
Since the method only accepts POST requests, unless Cross-Origin Resource Sharing (CORS) is implemented, the browser will be able to protect our data from returning the Json result to other domains.
The reason why “returning JSON data as array” is dangerous is that although browsers nowadays stop us from making cross domain HTTP request via JavaScript, we are still able to use a <script> tag to make the browser load a script from another domain.
Normally, we will show only tabular data in our online report module. However, tables are not exciting. So, why don’t we add some charts to the report to better describe the data? Thanks to Google Charts, web developers can add colourful charts to the web pages easily.
Step 1: The Required Libraries
The first thing we need is the Google API Loader which allows us later to easily load APIs from Google. So, with the help of it, we can make use of the Google Hosted Libraries.
Recently, in order to support a common look-and-feel across all Google properties and apps running on Google platforms, Material Design is introduced to Google Charts as well.
There are more than 20 of charts available in Google Chart Gallery. Depends on which chart that you would like to use, you need to load different API in order to use the Material version of each chart. I played around with some of them which are useful in my use cases.
The first chart that I use is the Column Chart which is to draw vertical bar chart. So, the API can be called as follows.
The third chart that I use is Timeline. This chart is different from the two charts introduced above because so far I still can’t find the non-Material version of it. So, the only way to call the API of Timeline is as follows.
Timeline is a chart describing the happening events over time.
Step 2: The Data
After we have loaded API of the chart that we want to use, then we need to pump in the data.
var data = new google.visualization.DataTable();
data.addColumn('string', 'Branch');
data.addColumn('number', 'Sales');
data.addRows([
    ['Ang Mo Kio', 1205.80],
    ['Bedok', 828.90],
    ['Clementi', 2222.10],
    ['Dhoby Ghaut', 3180.00]
]);
In the code above, I created a data table with 2 columns. Then I added 4 rows of data with addRows.
The addRows part can be done using a simple for loop. However, due to the fact that not all browsers support Tailing Comma, the for loop needs to have additional step to remove Tailing Comma.
Step 3: Chart Render
After we have the data, now we can proceed to draw the chart. For example, if we want to draw a Column Chart for the data table above, then we will use the following code.
var chart = new google.visualization.ColumnChart(document.getElementById('chart_div'));chart.draw(data);
The HTML element chart_div above is just an empty div where the chart should be rendered at.
We will then be able to get the following diagram (Non-Material).
A simple Column Chart.
Customization of Charts with Options
Google Charts allows us to customize the diagram. For example, we can add title for the diagram, horizontal axis, and vertical axis.
When I was adding Google Charts to one of my web page with tabs using Bootstrap framework, I realized there was a problem with the display of the rendered diagram. The labels in the chart are incorrectly positioned. This problem has been discussed on Stack Overflow as well.
Display Issues of Google Charts in Bootstrap Tabs
Interestingly, if the chart happens to be in the first tab which is visible by default, then there won’t be any display issue on the chart. This problem only occurs when the charts are located in those subsequent tabs which are hidden during the first load of the page. When user clicks on any of those subsequent tabs, then the display issue will happen.
So one obvious solution is actually to only call the Google API to render the graph when the tab is clicked. To be safe enough, I actually put a delay to the click event of the tab so that the chart will be drawn 3 seconds after the the corresponding tab is clicked. This seems to help fixing the display problem.
Google Charts is undoubtedly a very easy-to-use solution for web developers to present their data. So, please try it out and be amazed by the number of charts available on Google Charts.