I like to explore interesting new technologies. I also love to learn more from the materials available on Microsoft Virtual Academy, Google Developers channel, and several other tech/dev events.
I was once asked how to build and maintain an open source project. A successful open source project not only solves a particular problem well, but also follows best practices in order to have a high code quality.
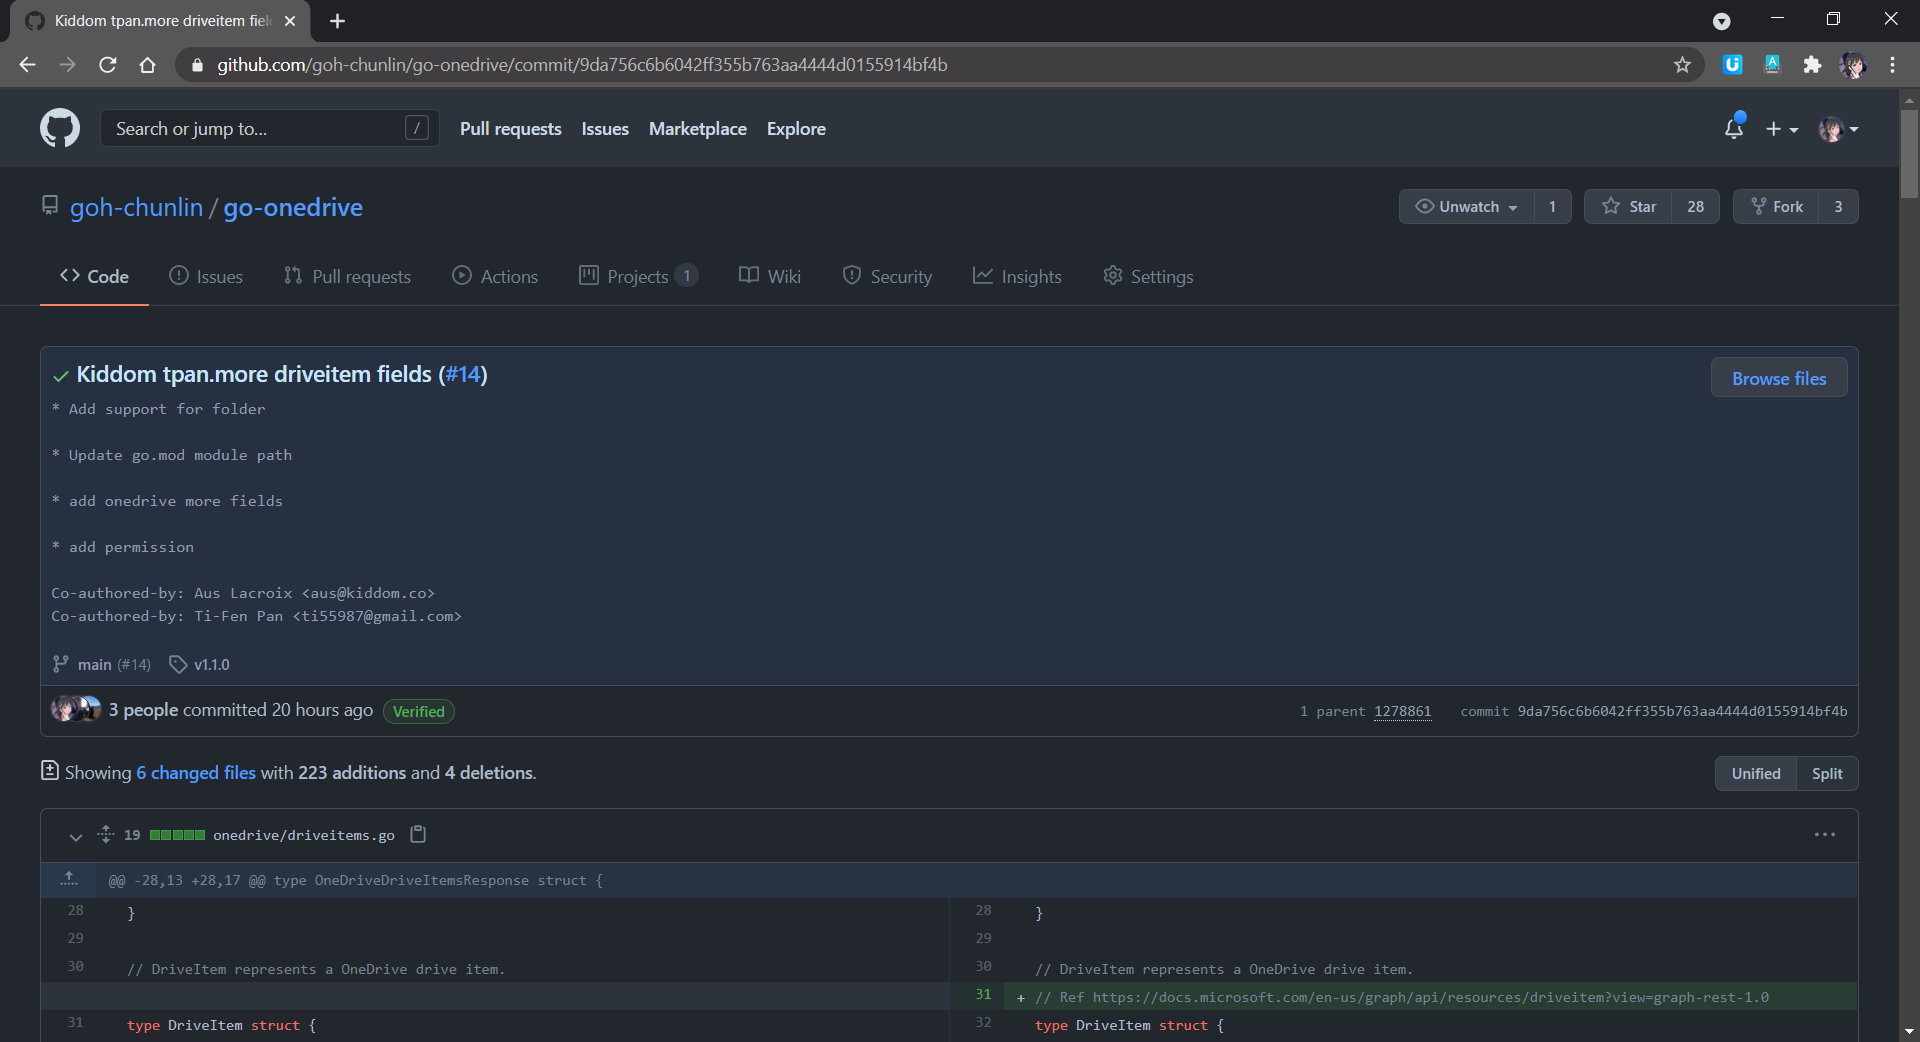
Last year December, I published my open source project, go-onedrive, a Golang client library for accessing the Microsoft OneDrive REST API.
Last month, go-onedrive successfully received 28 stars, which is the highest number of stars I received on GitHub. Also, there are new contributors joining the project. Meanwhile, I am also honoured to have received code review feedback about the go-onedrive project from Brian Ketelsen, Principal Cloud Advocate in Microsoft. Even though it’s not a great achievement, but I’m still satisfied because it’s the first time my projects on GitHub received so many eyeballs.
Hence, in this article, I will talk about maintaining this open source project, go-onedrive.
Changes Based on Feedback Received
Not all contributors will submit a pull request for their feedback. They may just submit an issue on GitHub and we have to work on that. Sometimes, they may simply message us to let us know their thoughts. Hence, we need to make the changes according to the valid feedback and comments.
Brian Ketelsen commented about the Golang file naming in the project. According to Brian, Golang source file names should be all lower case (same with package names and directory names) because some file systems are case-preserving. Hence, there will be cases where both myFile.go and myfile.go can be two different files in the same directory.
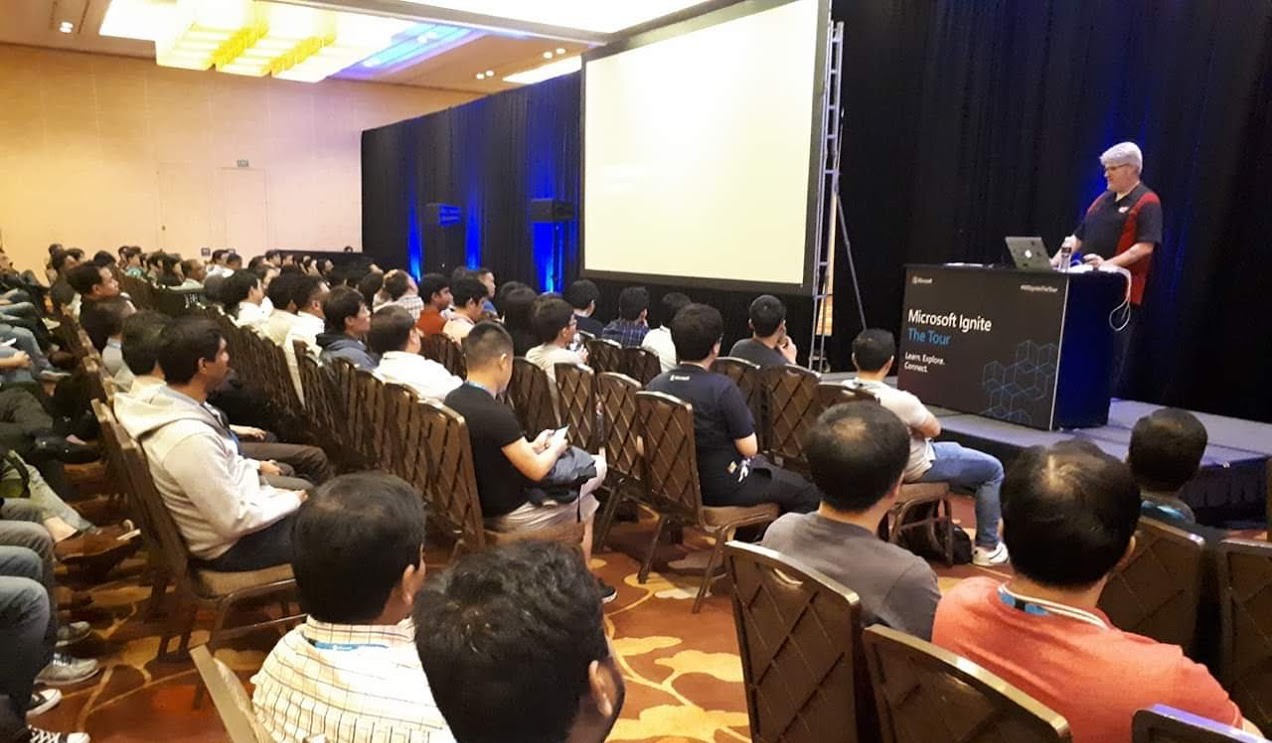
Brian Ketelsen talked about microservices and Golang in Singapore during a Microsoft event. (Photo Credit: Riza Marhaban)
I am glad to have two contributors, @nullaus and @ti55987, joining from another part of the world. They not only provided great improvement to the library by introducing new functionalities, but also followed the existing coding style in the project. So, I’d like to take this opportunity to thank them.
As the owner of the library, I’m aware that how contributors communicate can have a significant impact on the success of the Pull Request. I respect the time taken by the contributors to improve the codes. Hence, if sometimes they’re not able to correct the Pull Request based on the agreement, then I will try to make the changes on their behalf.
Three of us are helping each other to improve the codes in the same Pull Request whenever we can.
In the most recent change, one of the contributors submitted a new service for Shared Link in OneDrive. I noticed that hardcoded strings are used in the new code. This makes the client to be able to send any valid string and there will be no errors. Hence, I changed the code to use proper enums.
Publish Package with VS Code
Once all the necessary changes are done, it’s time to publish a new package for the users on Pkg.go.dev.
Firstly, we use the following command to tidy up the dependencies in go-onedrive library. This removes any dependencies the module might have accumulated that are no longer necessary.
go mod tidy
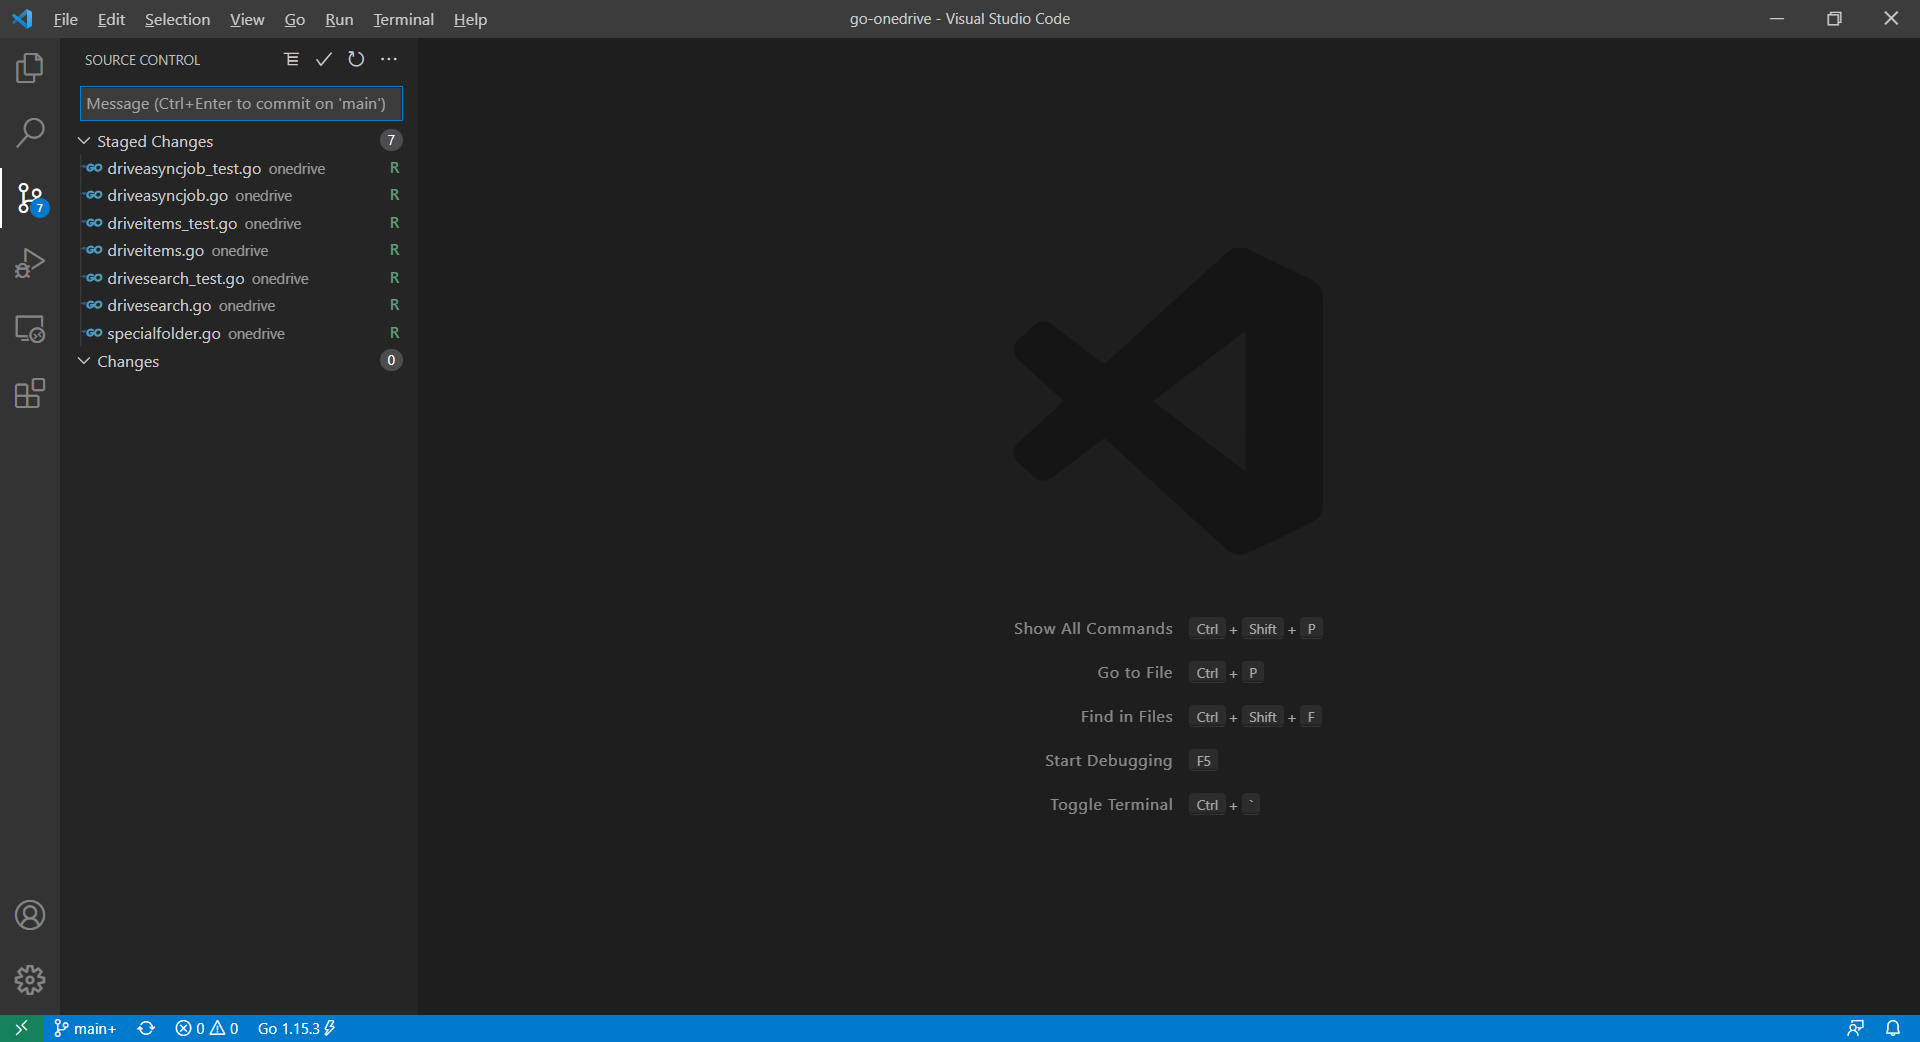
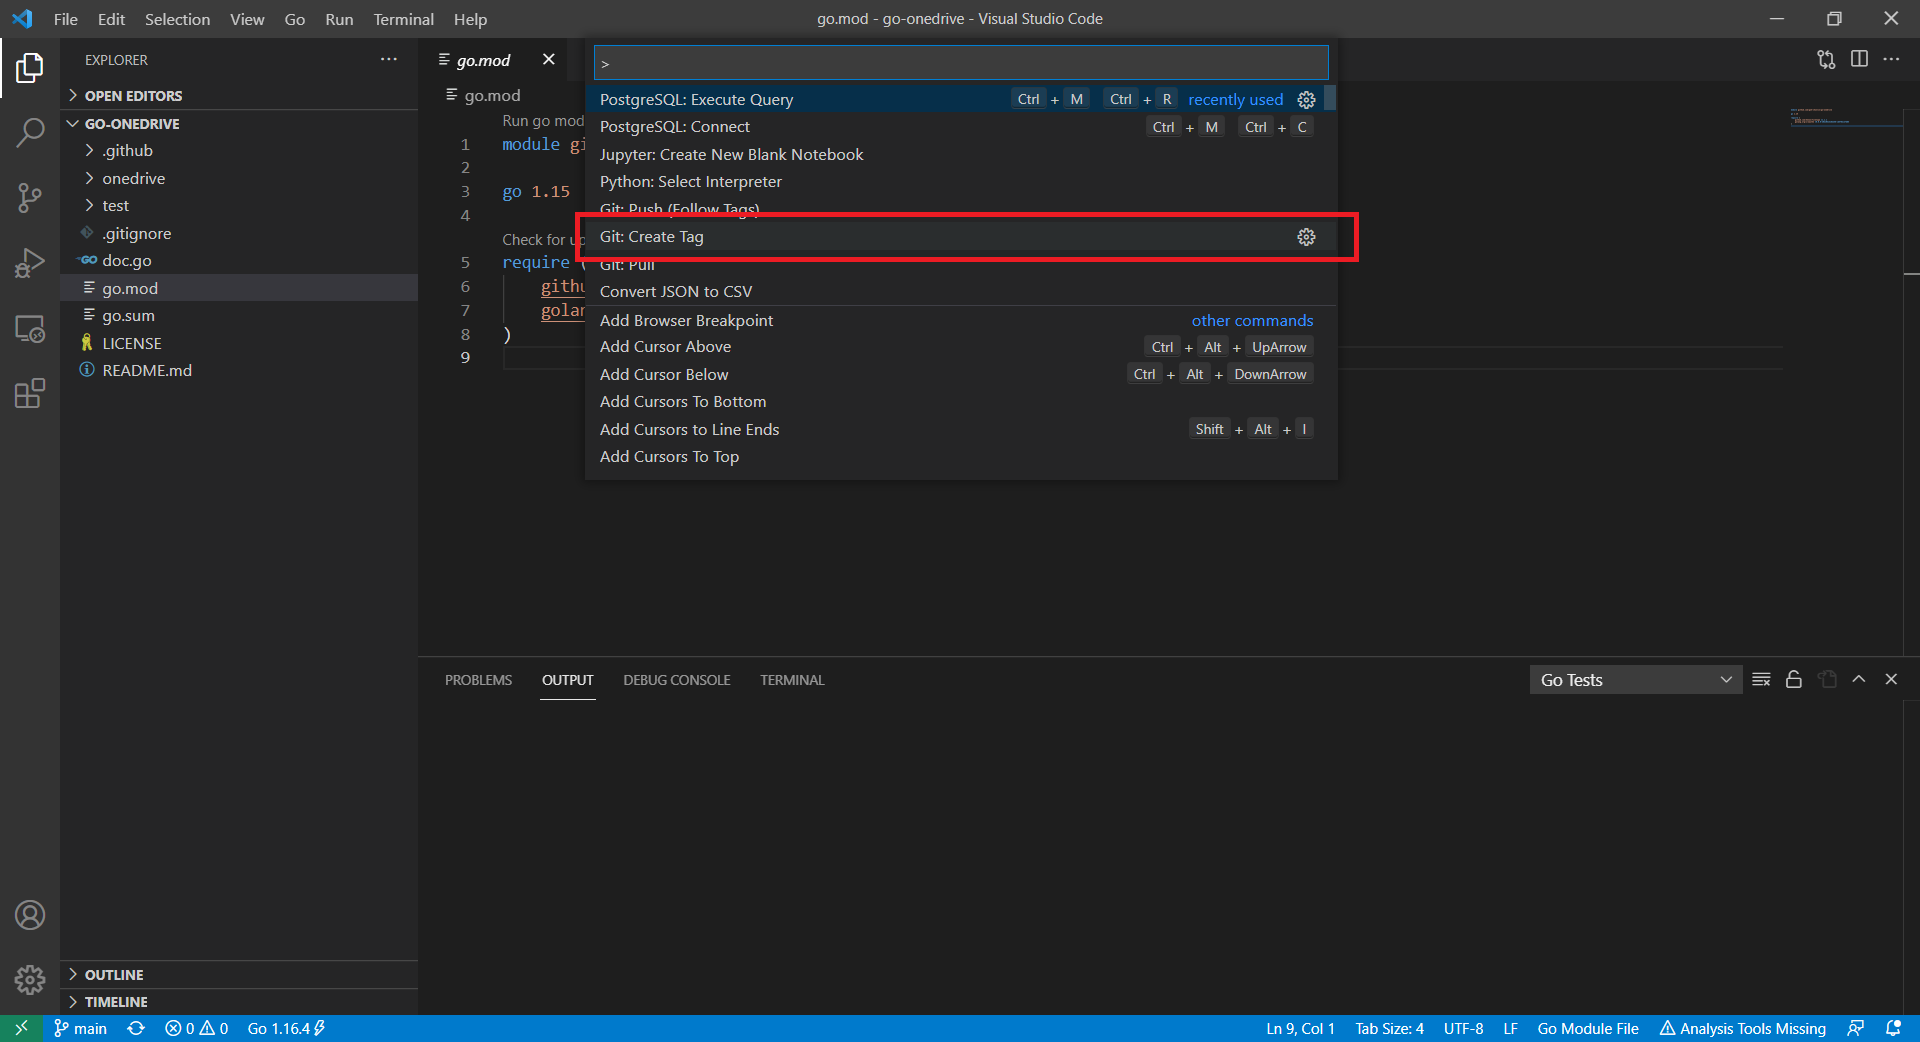
Now we can proceed to publish our module by first creating a Release of it on the GitHub. To do so, we open the Command Palette (Ctrl + Shift + P) and choose Git: Create Tag.
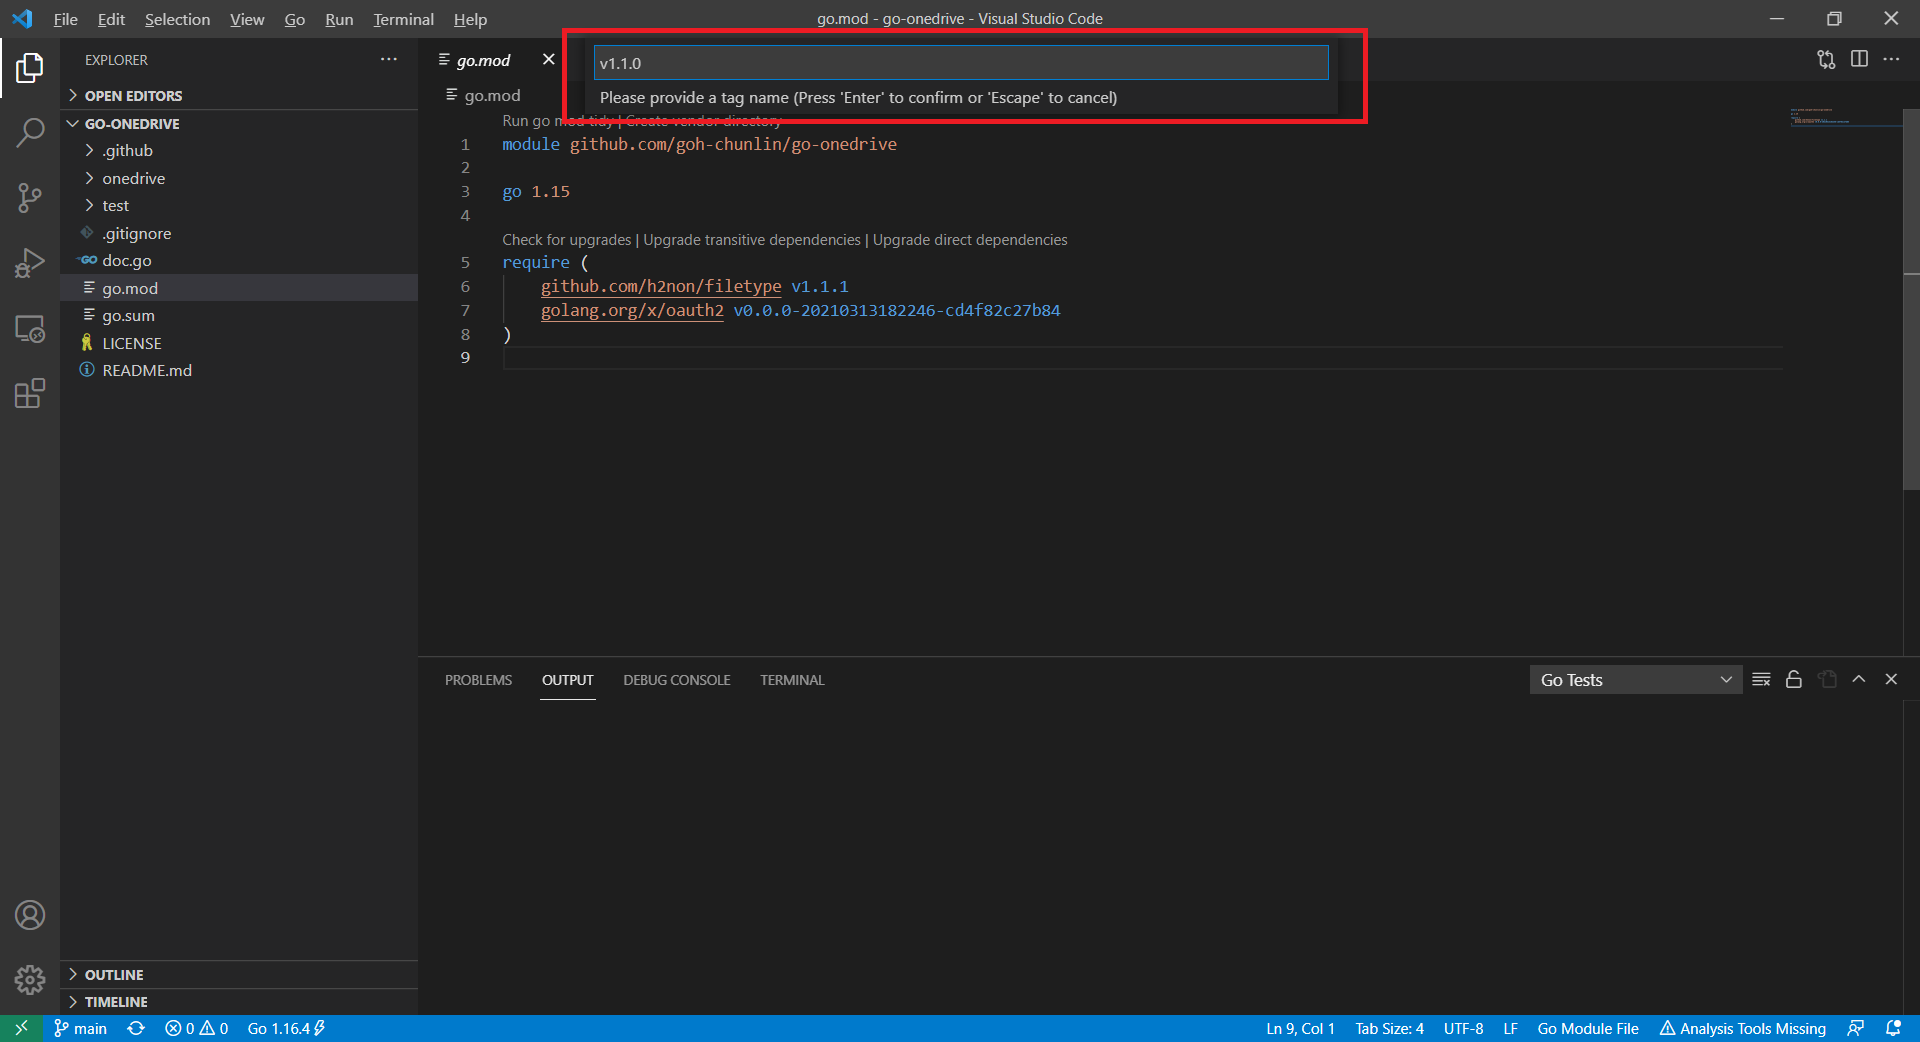
We will tag this release as v1.1.0 and provide a message to describe this release in the next step.
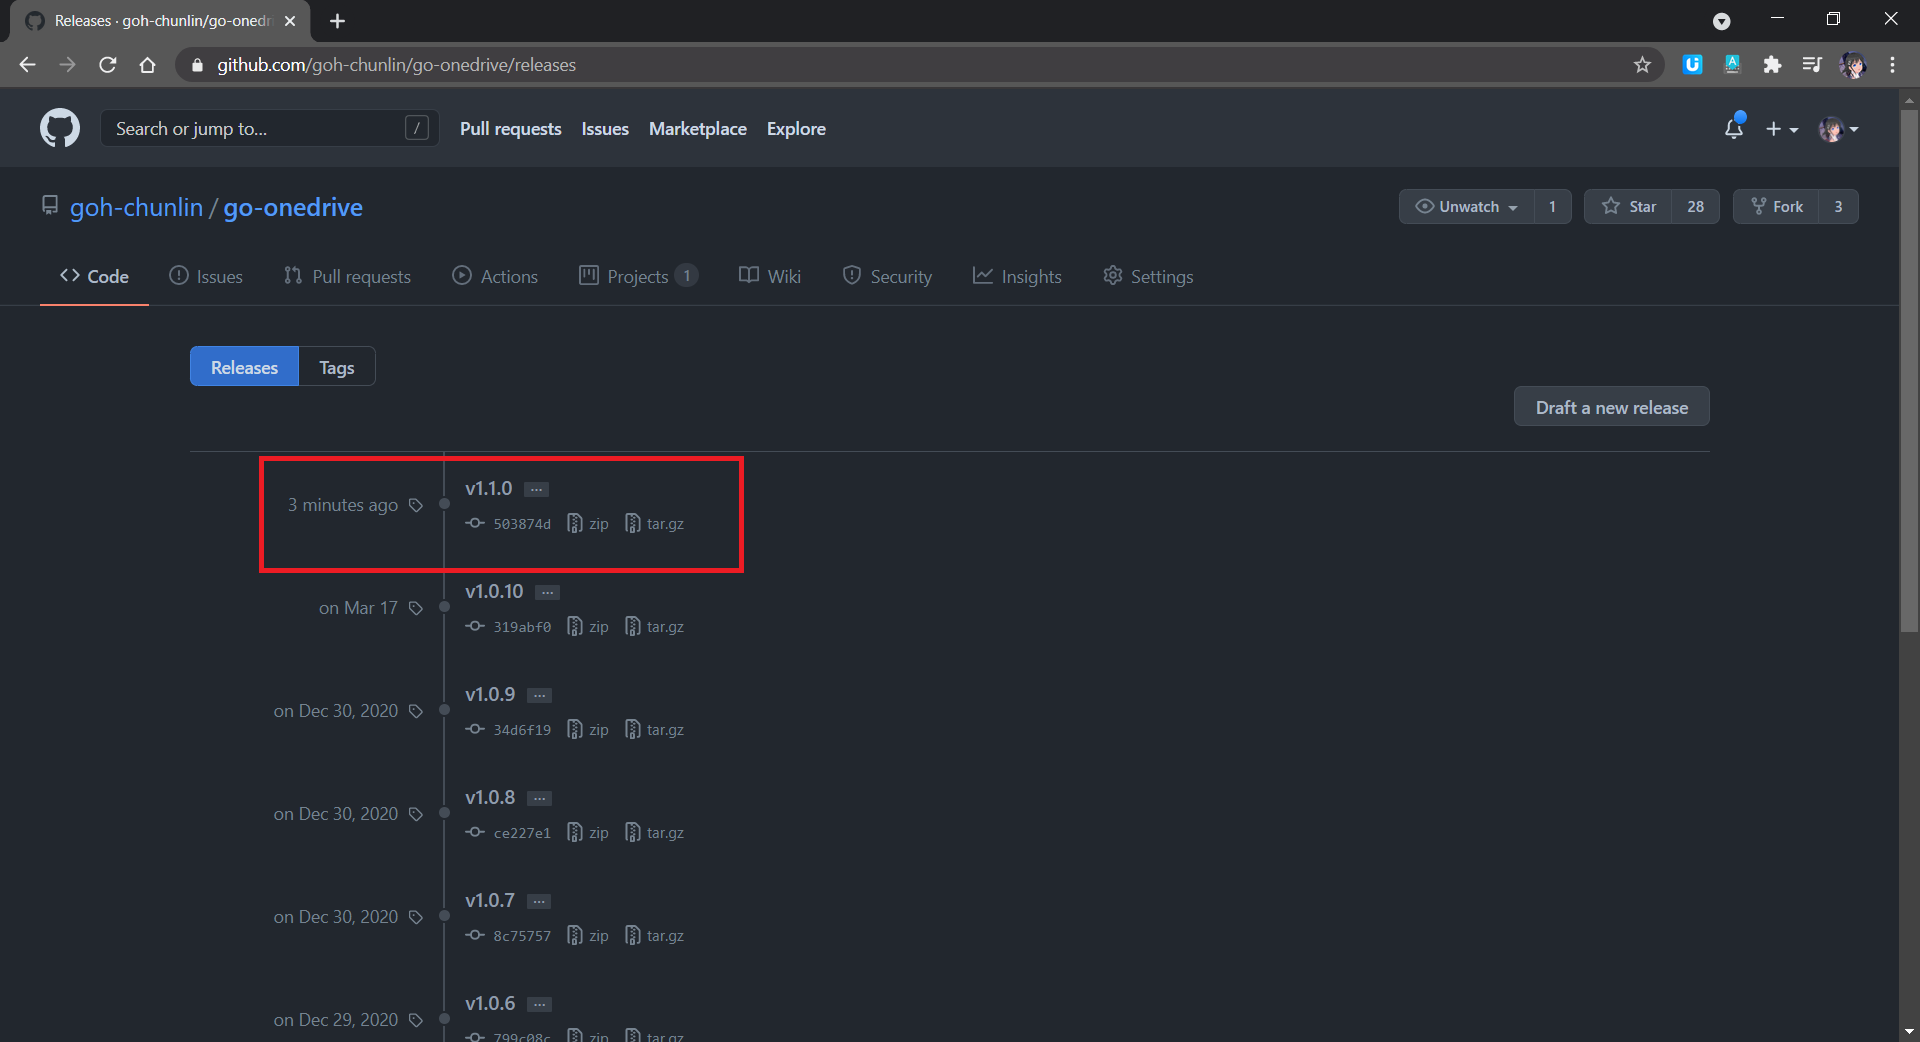
Finally, we need to push the tag to the remote server. To do so, we simply open the Command Palette again and choose Git: Push (Follow Tags). Then we shall see our new package now available on GitHub Releases page, as shown below.
Yay, this is our new package for go-onedrive.
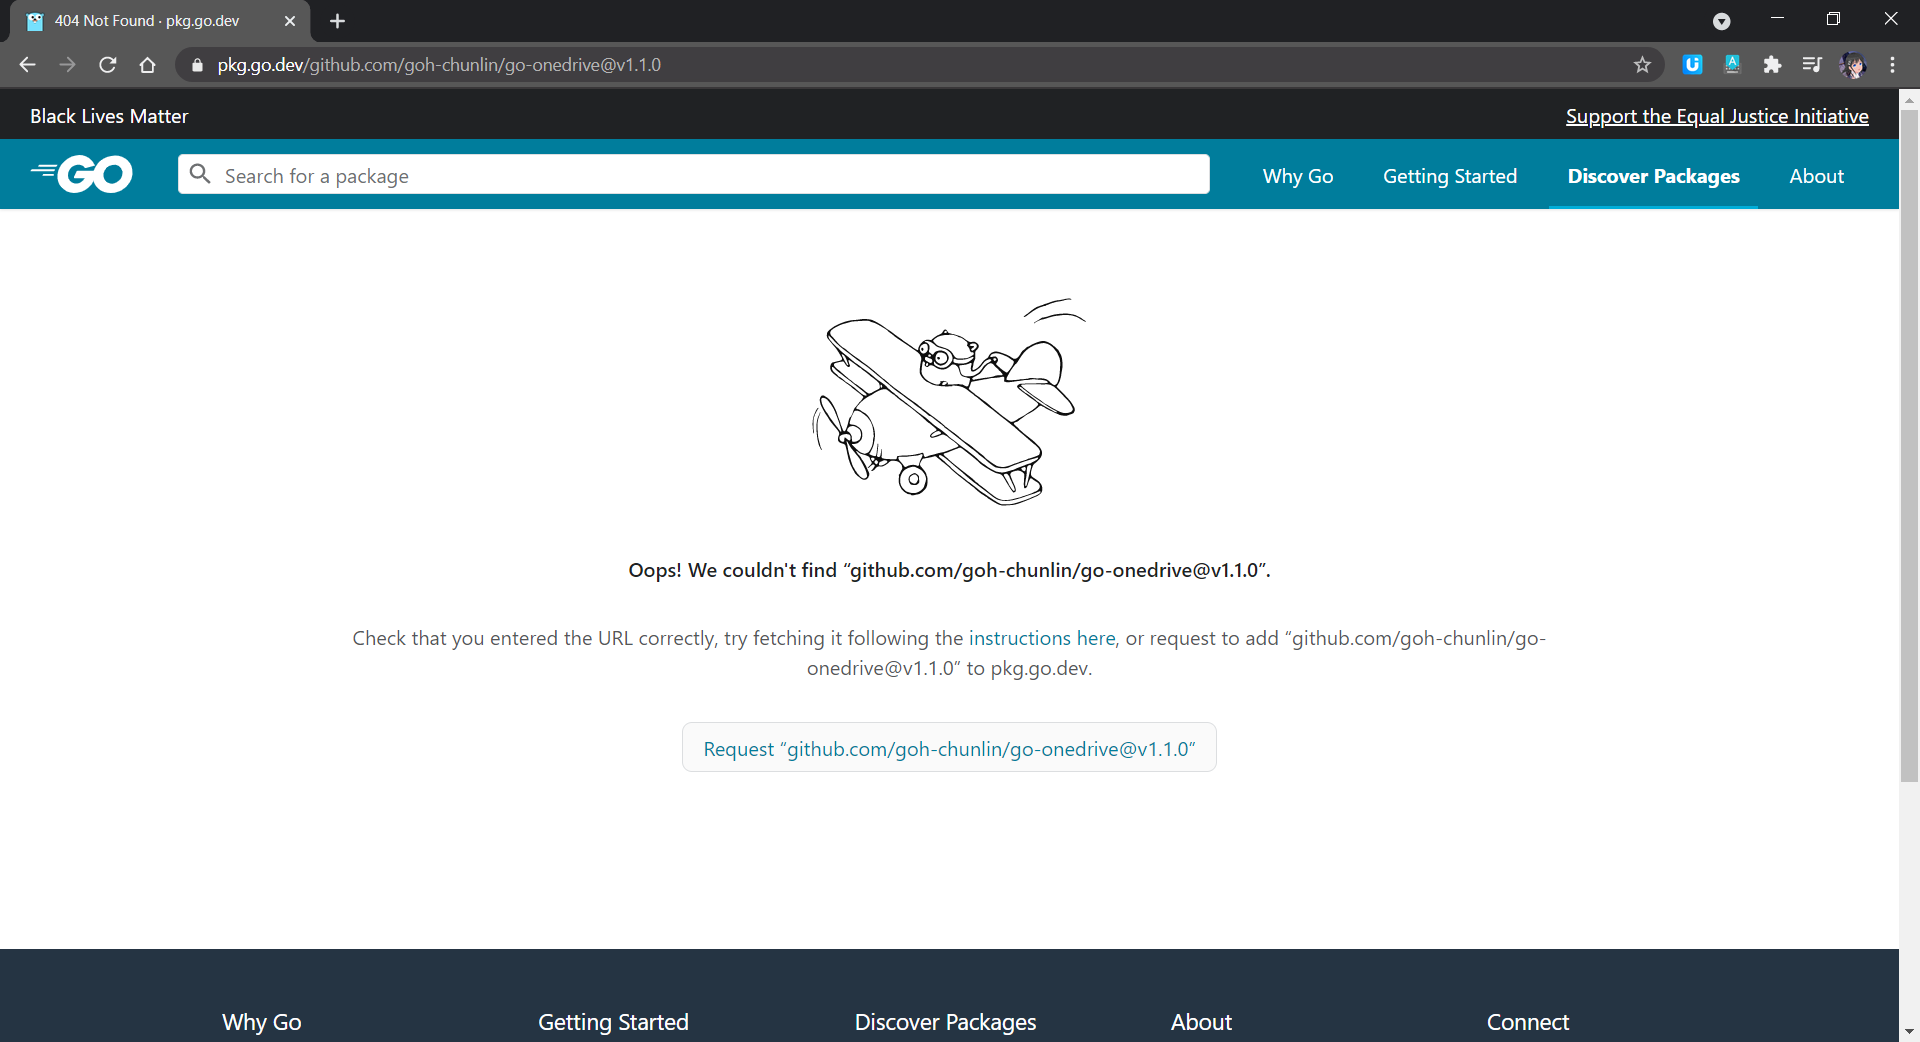
Now, how to we update the Pkg.go.dev? Now if we navigate to the v.1.1.0 web page on Pkg.go.dev, we will be told that it cannot yet be found, as shown below.
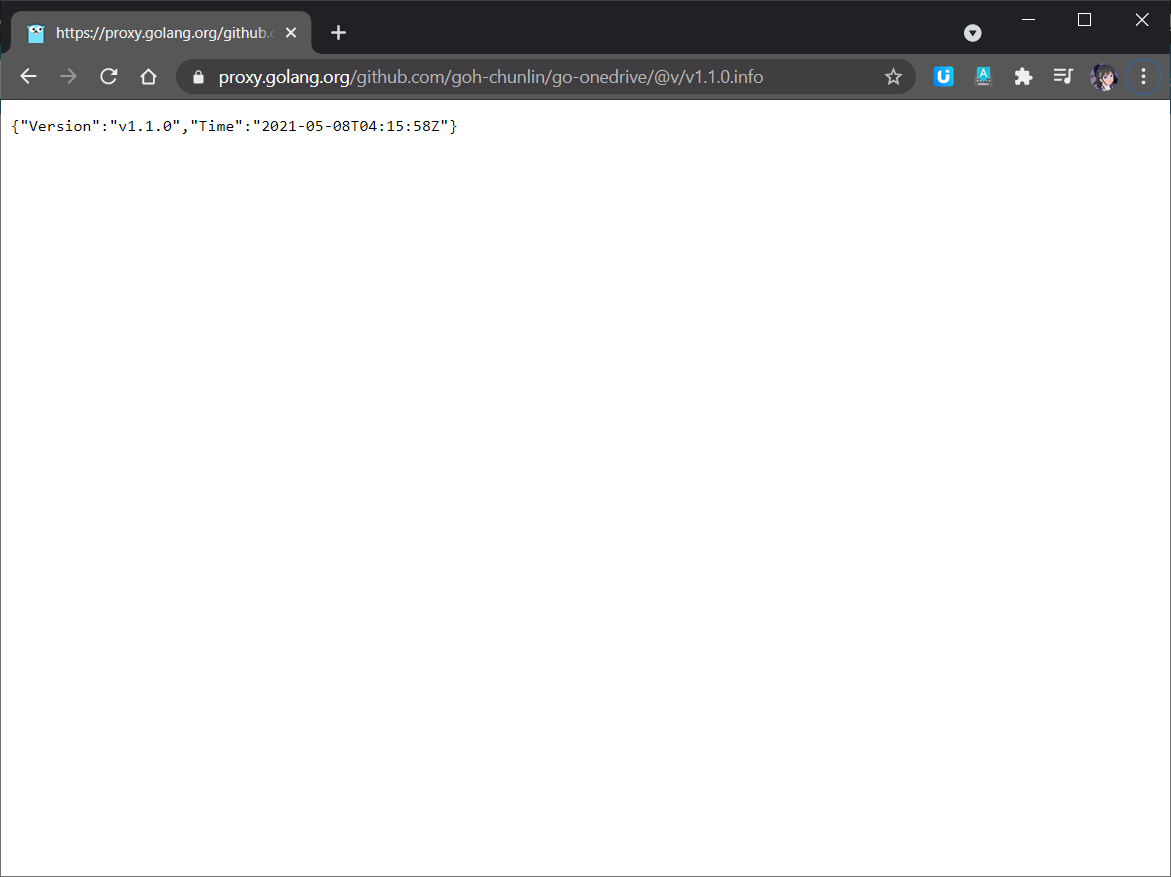
This is because new packages are added to Pkg.go.dev through the scheduled monitoring of the Go Module Index. Hence, if we don’t see our packages on the website, we can manually make a request to fetch our packages by following the instructions here. The following screenshot shows how I make a request to proxy.golang.org, where the data of the Pkg.go.dev is downloaded from. In my case, after doing that, in less than 10 minutes, the package will be made available on the Pkg.go.dev website.
Manually request proxy.golang.org for the module version to endpoint specified by the Module proxy protocol.
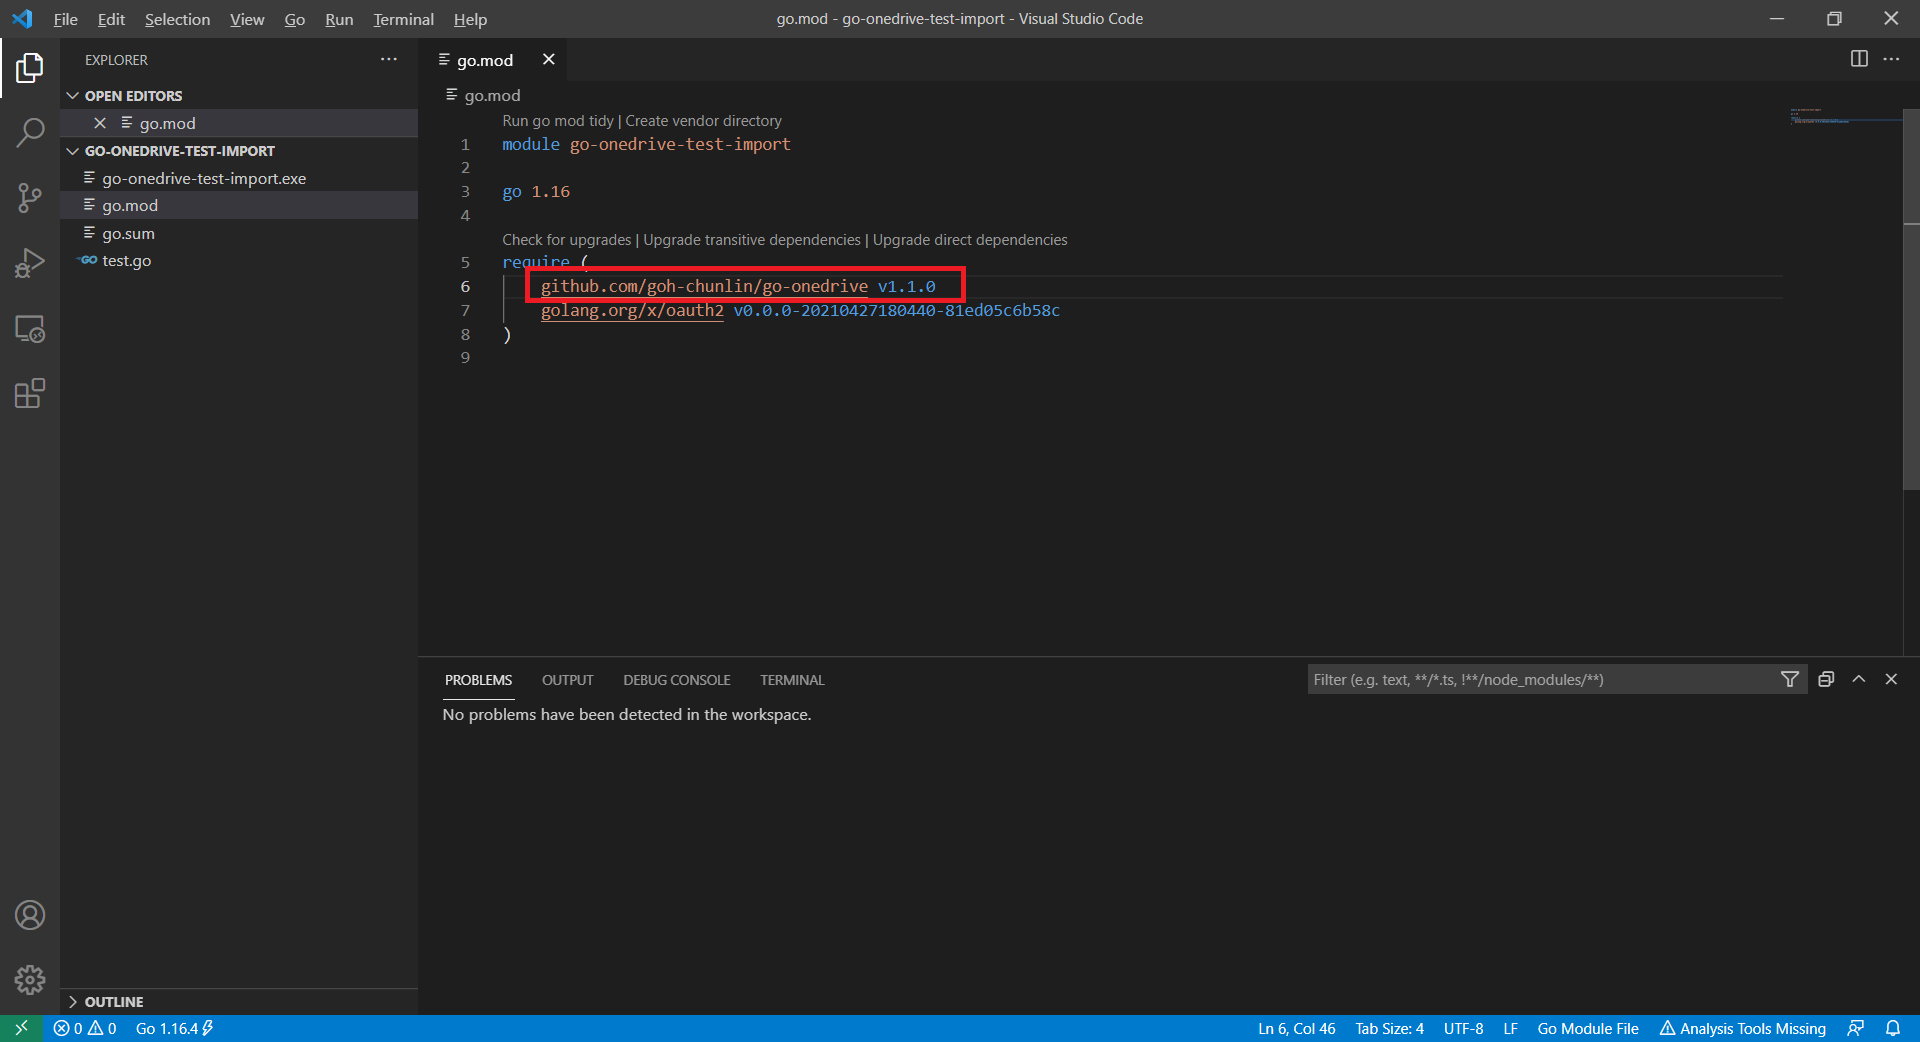
With this new release, the users can simply update to use the latest version of go-onedrive in the go.mod file of their projects. After running the go mod tidy command, then they are good to go to use the new go-onedrive library.
Getting our apps to the market is always an exciting moment. I once remembered I worked with the business co-founders until mid-night when we launched our first version of the app. There was also a time when minister and other government officers visited the launch event of our UWP app. So, yup, publishing and releasing the apps to market is a crucial knowledge to learn for developers. Today, this post will share my journey of submitting my first UWP app to the Microsoft Store.
As a staff in an education institute, I can access Microsoft Store for Education too.
When we package our apps using Visual Studio and then release it to the Microsoft Store, a special capability will be added automatically. It’s called runFullTrust, a restricted capability. It allows our apps to run at the full trust permission level and to have full access to resources on the users’ machine. Hence, we need to submit our apps to the Microsoft Store and then wait for approval from Microsoft before our apps can be released on the Microsoft Store.
So, let’s start the app publish journey with me now.
After that, we will proceed to configure our app manifest file Package.appxmanifest. It’s an XML file that contains the properties and settings required to create our app package.
The Display Name and Description are controlled in the resource file Resources.resw. I also set my app to support the Landscape views only.
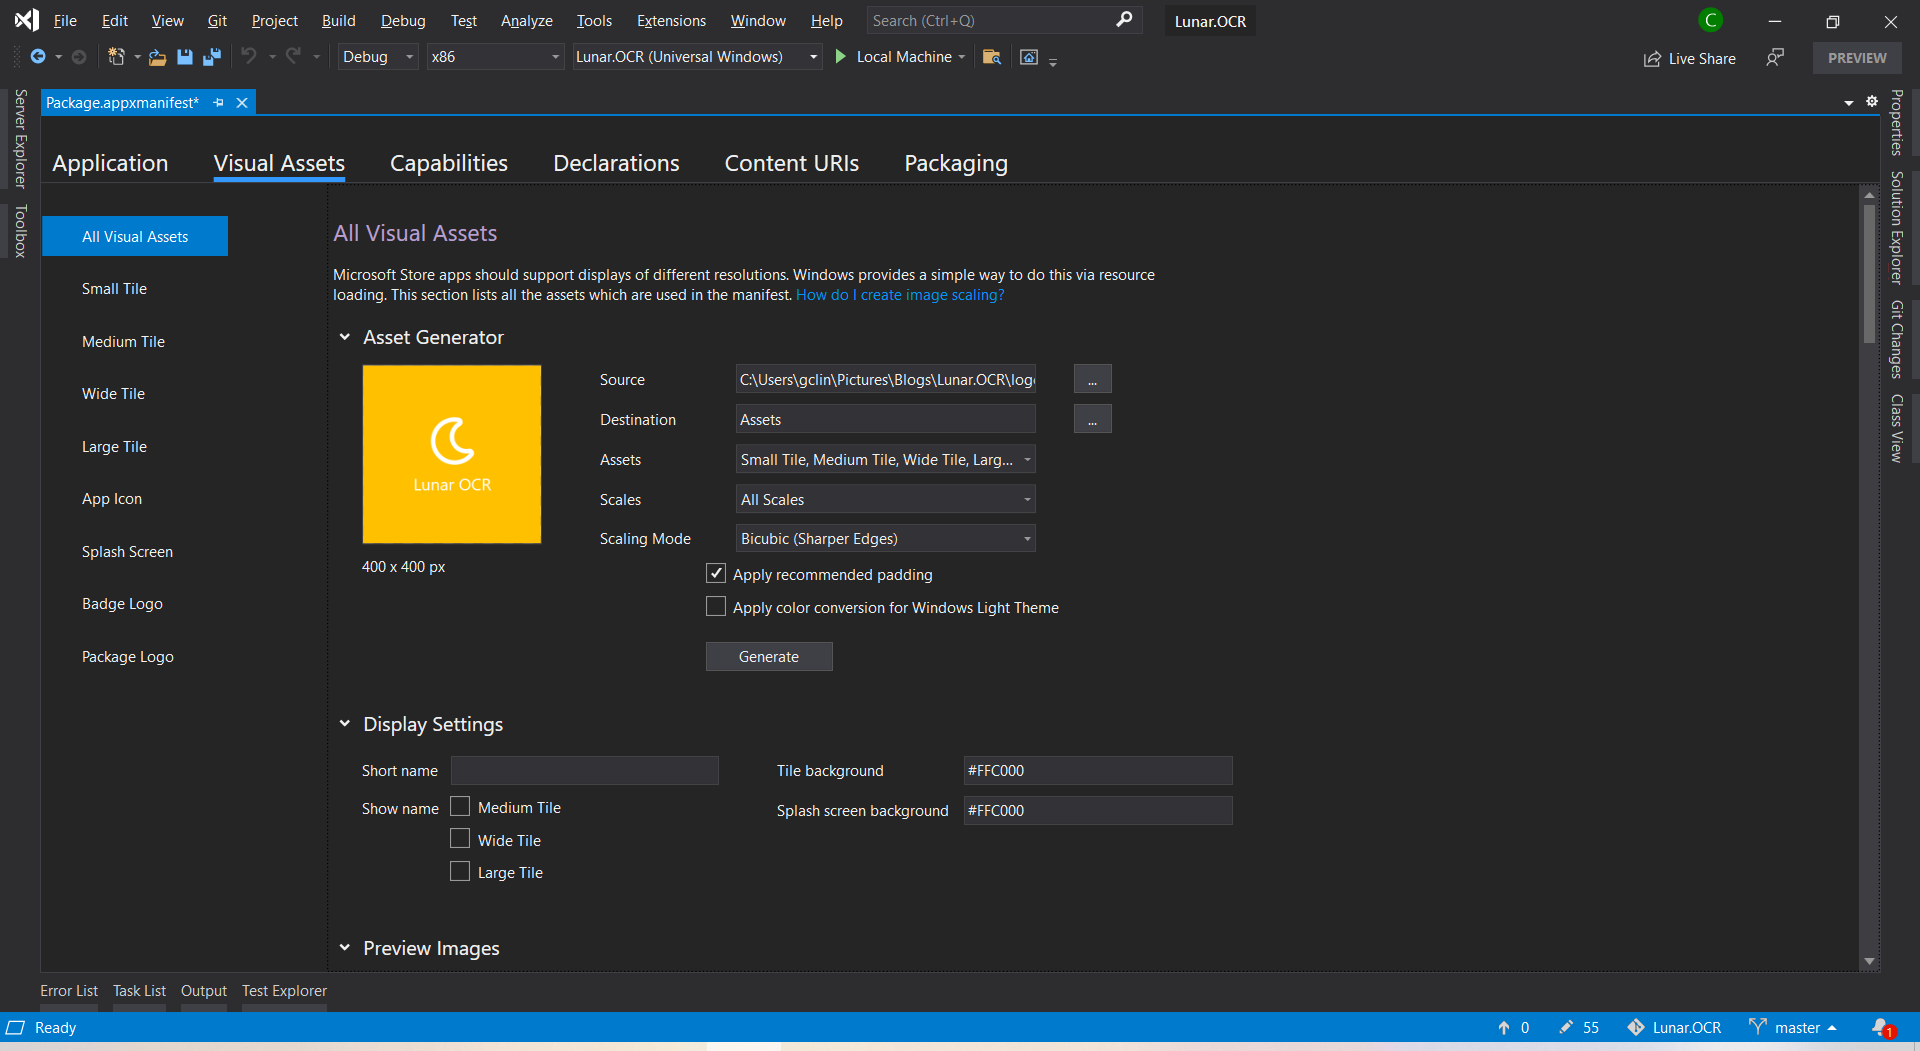
After that, we will need to upload the product logo. Even though there are many visual assets for different sizes of tiles, icons, package logo, and splash screen, what we need to do is simply just upload one logo image which is at least 400×400 pixels. Then Visual Studio will be able to help us to generate the necessary assets.
I set the background of tile and splash screen to be the same colour as the uploaded logo because the logo file comes with a background colour.
I will skip the Capabilities, Declarations, and Content URIs tabs here because they are not relevant to our app for now.
We need to pay a one-time registration fee with no renewal is required. In Singapore, individual account costs SGD 24 and company account is SGD 120.
After we have logged in to the Microsoft Partner Center, we can first reserve our product name first. So we can take our time developing and publishing our apps without worrying the name will be used by other developer or company within the next three months.
Reserving a name for our app before submitting it is similar to the act of placing packets of tissue on empty tables to reserve seats while we go grab our food. (Photo Credit: The Straits Times)
Mission 3: Associate App with the Microsoft Store
After we have successfully created a developer account, we can then associate our app with the Microsoft Store in Visual Studio.
Right click our solution and we can associate our app with the Microsoft Store.
After the association is done, we will see that, in the Packaging tab of our app manifest, the app has already been signed with a trusted certificate. This allows the users to install and run our app without installing the associated app signing certificate.
Mission 4: Create the App Package
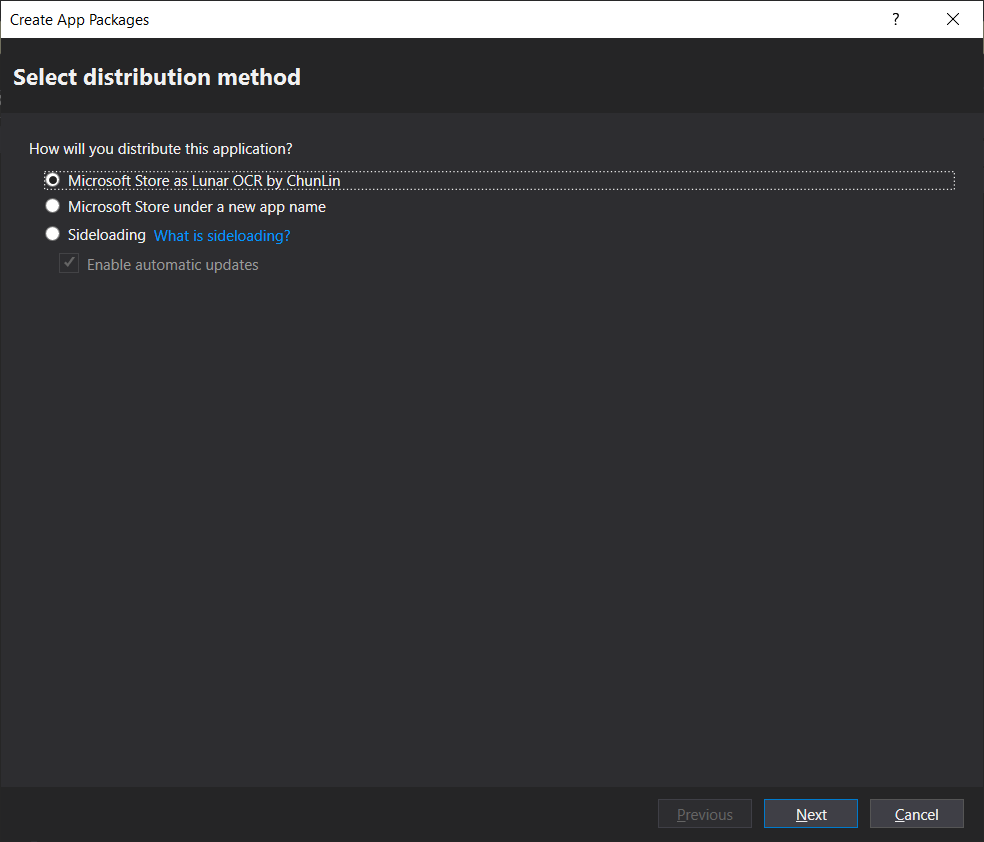
Since we have already associated the app, now when we proceed to create the app package, we will have an option to distribute to the Microsoft Store for the app directly.
Choosing the distribution method.
After that, we will need to select the architectures for our app. In order to make it runnable on most of the platforms, we should choose relevant ones.
Windows 10 devices and architectures. (Image Source: MSIX Docs)
Certification tests for our app on Windows App Certification Kit.
This mission is successfully completed as long as the Overall Result shows “PASSED”.
Mission 5: Publish to Microsoft Store!
Before we can submit our package on the Microsoft Partner Center, there are a few information we need to prepare.
Markets: There are in total 241 markets available. We need to choose to list our app in which markets. Currently, if the app is made available in Singapore, then the app can also be found on the Microsoft Store on Xbox One for Singapore market;
Privacy Policy: We need to provide a privacy policy URL to our app.
Website: A web page showing what our app is about.
Both privacy policy and website of my app are hosted as GitHub Pages.
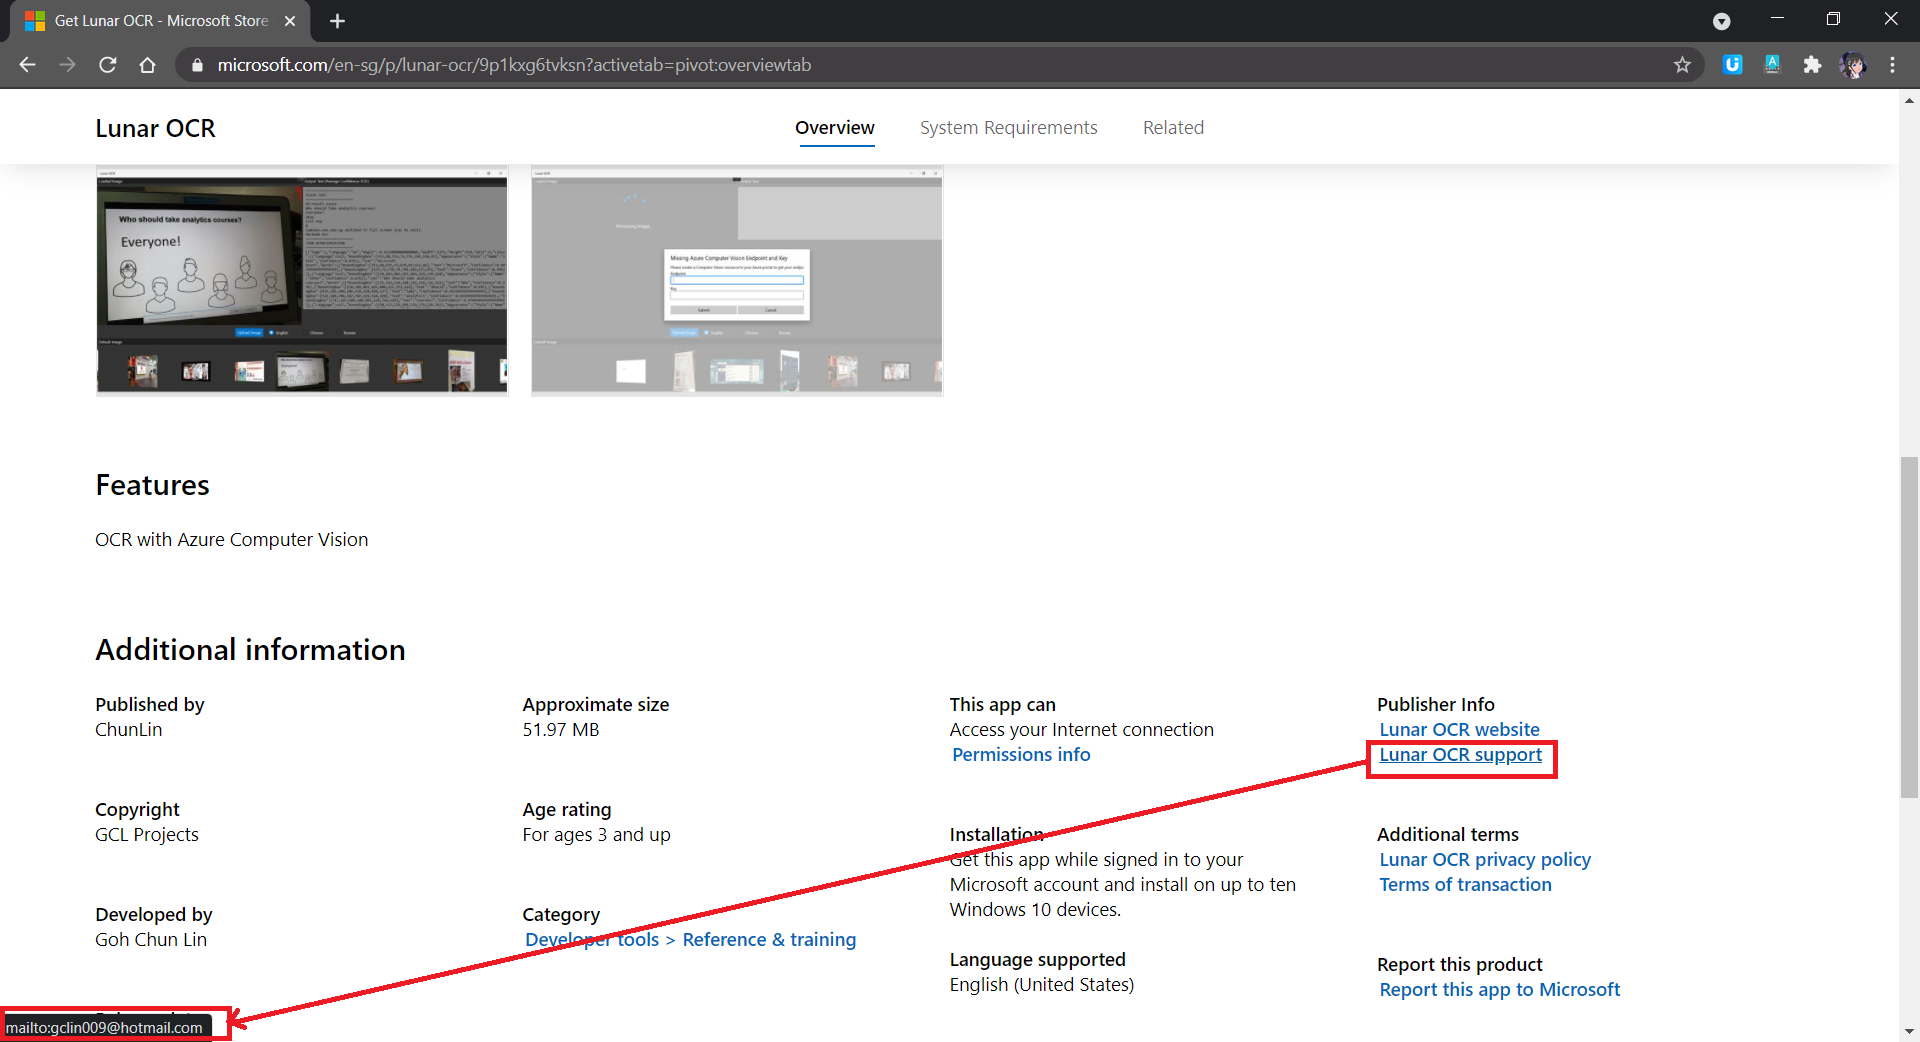
Support Contact Info: Please do not enter email as Support Contact Info, provide URL of a support page of the app instead. I received many spam mails after using my email for this field. Haha.
If email is used as Support Contact Info, web crawlers can easily retrieve our email address and spam us.
System Requirements: If customers are using hardware that doesn’t meet the minimum requirements, they may see a warning before they download our app.
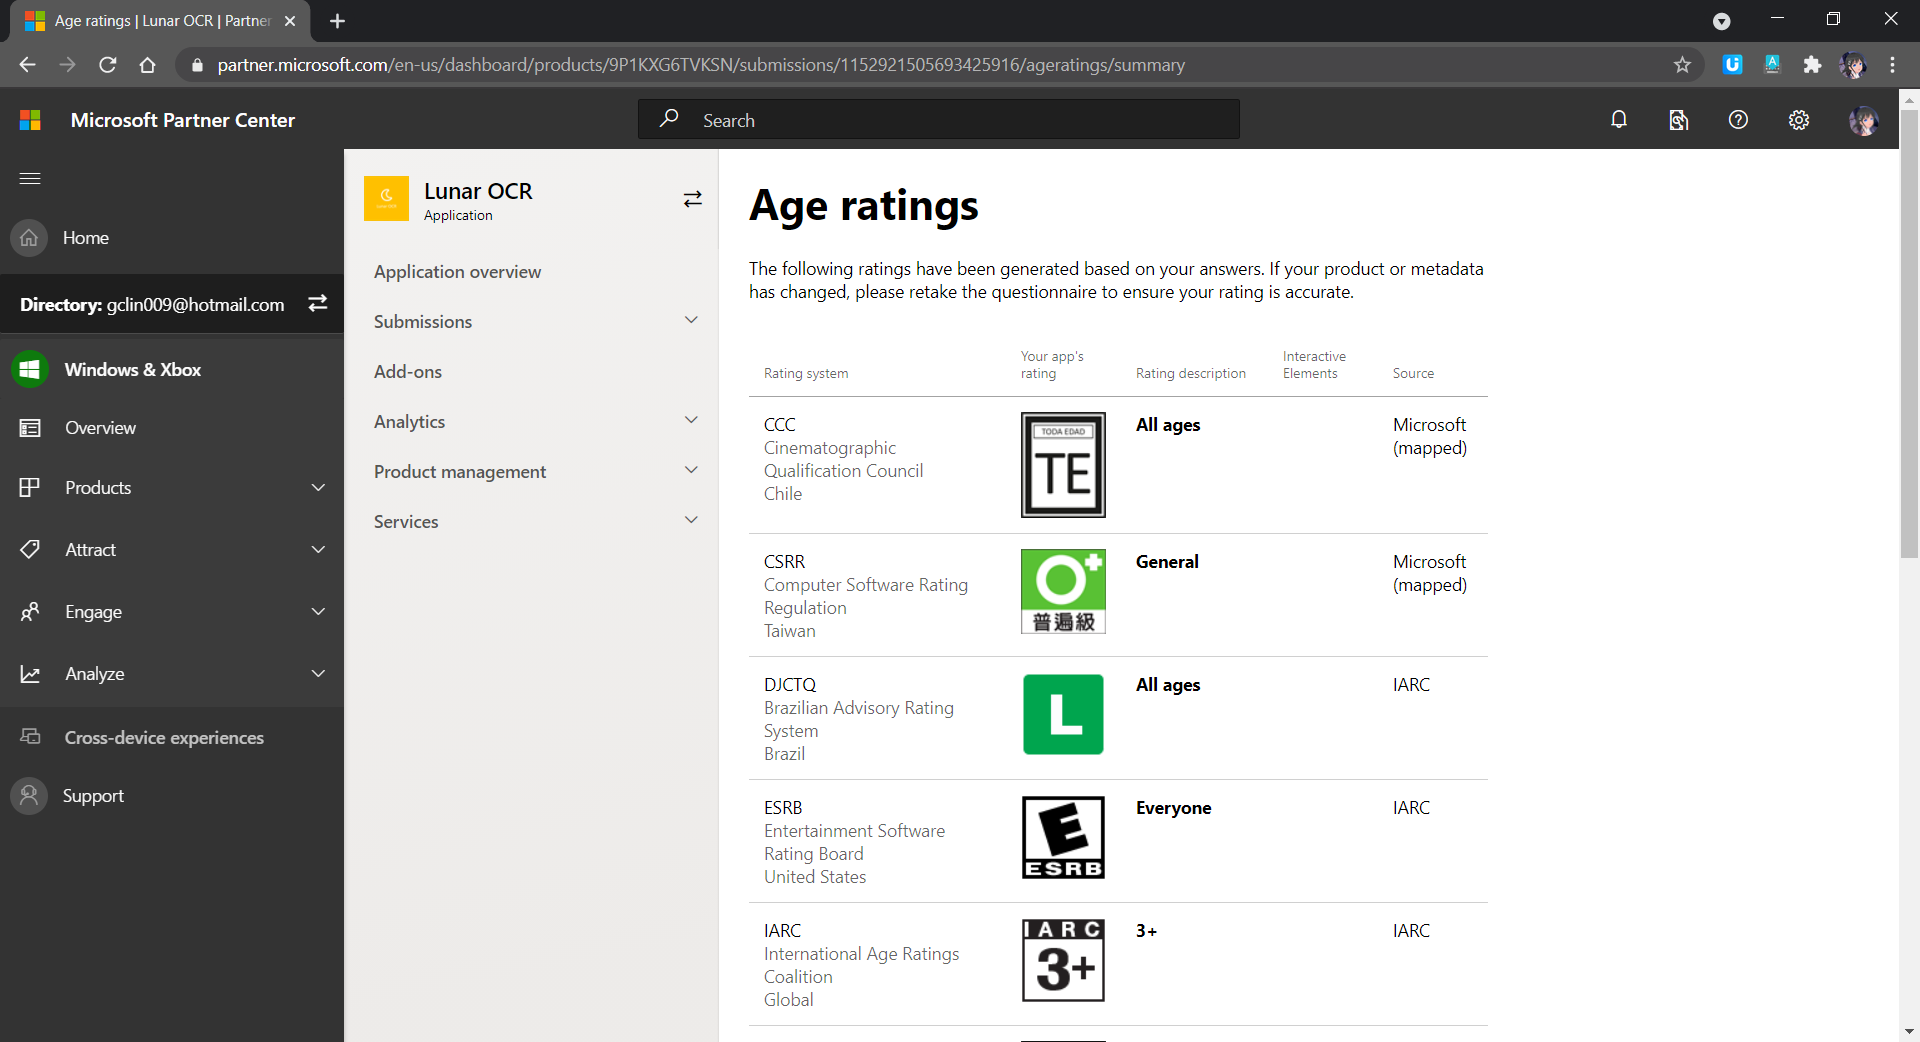
Age Rating: There will be a tool to help us determine the rating of our app in each of the markets.
Age rating of our app.
Publish Date: By default, our app will be published to the Microsoft Store as soon as the submission passes certification. However, we can also manually publish it later or schedule the publish to a later date and time.
Once we have provided all the information above, we can proceed to upload our app package to the Packages section, as shown in the screenshot below.
If the submission is rejected, we simply replace the app package here with a new one and then resubmit the same submission.
After our submission is done, we just need to wait for the Microsoft staff to certify our app.
If our submission is rejected, we will see a report as follows under the Submission where there will be details on action to take.
Oh no, there is an uncaught exception in our app. We gonna fix it fast.
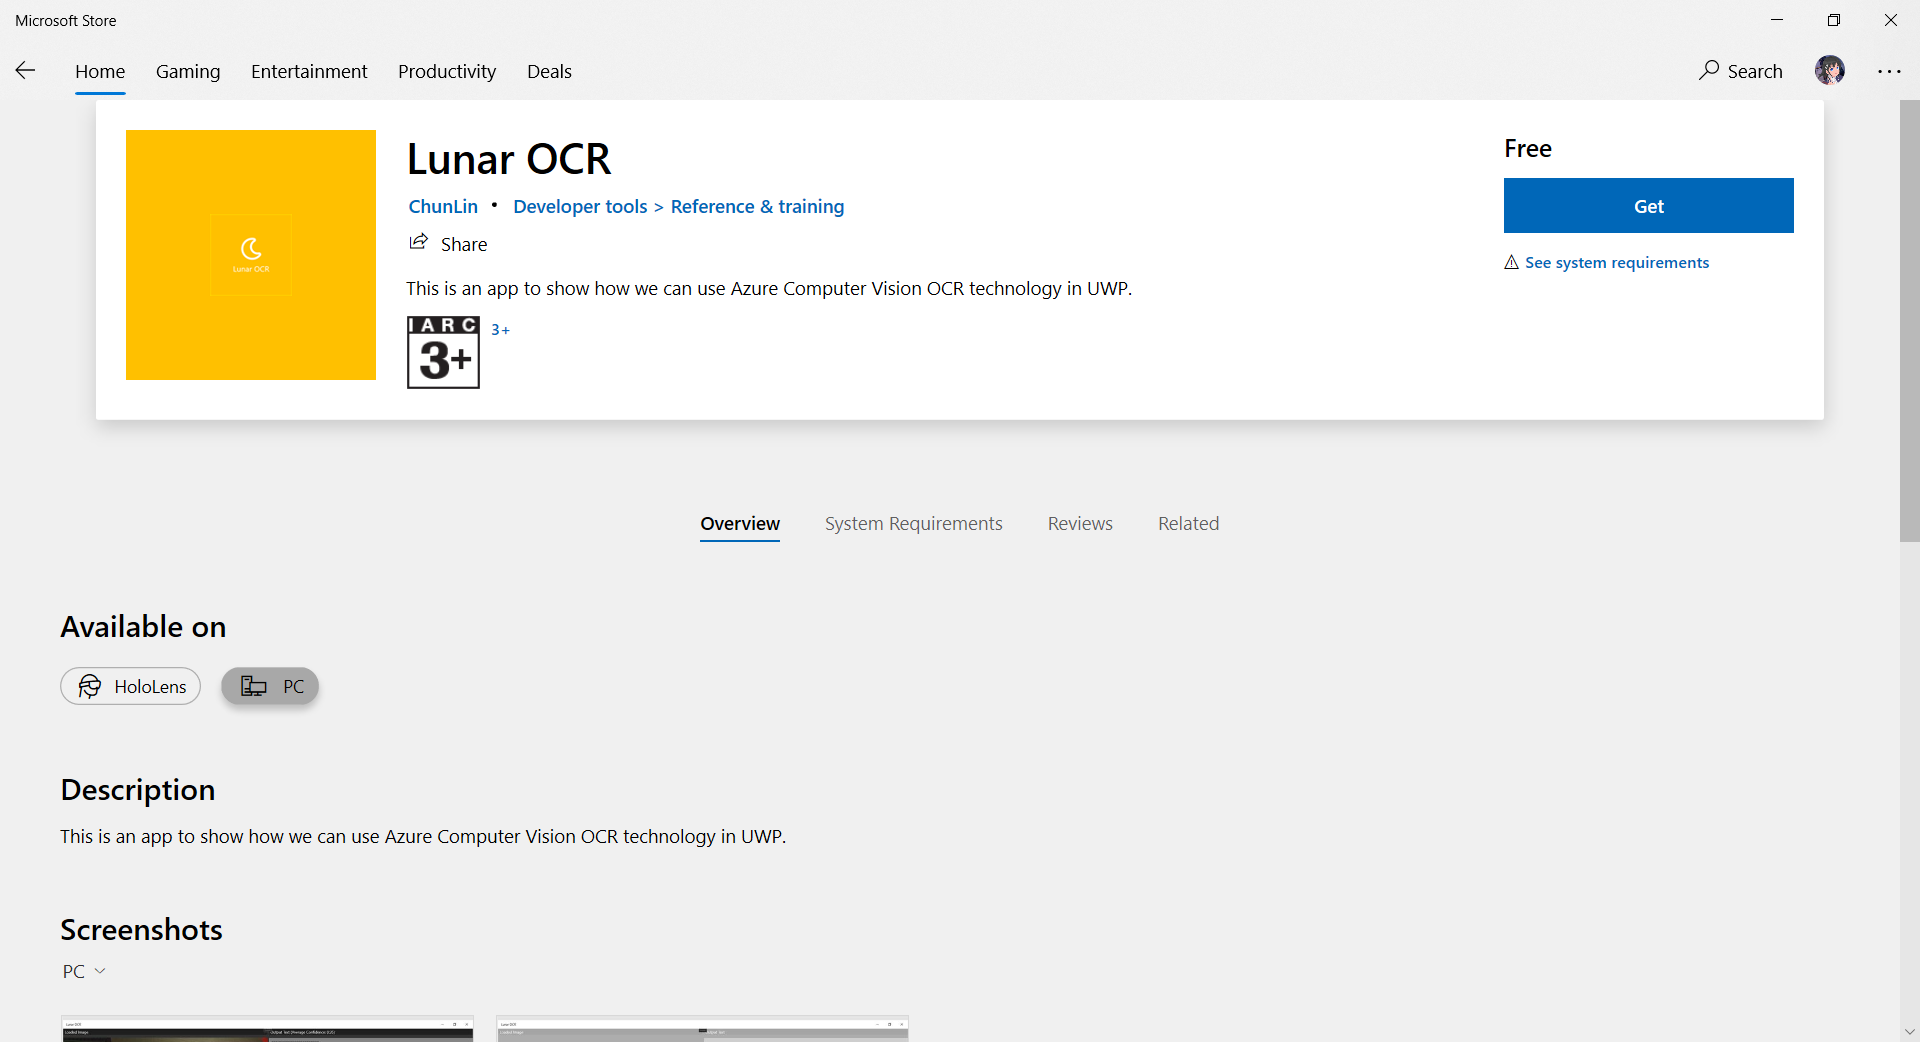
If there is no problem, we will be able to see our app on the Microsoft Store, as demonstrated in the following screenshot. The whole certification and release process is very fast to me.
I submitted the app on Sunday night (SGT) and my app was approved on Monday night (SGT) after fixing the problems reported by Microsoft and re-submitting again for one time on Monday evening (SGT).
Mission 6: Monetise App with In-app Ads
Since I am supporting open-source software, so the apps I publish are all free to the public to download. However, it would still be great if I can get financial supports from users who love my work. Hence, monetisation our app with in-app ads is one of the options.
It is better to get our app approved on Ads Jumbo before uploading our app with in-app ads to the Microsoft Store.
The approval process on Ads Jumbo is fast to me. My app was approved on the day I submitted it on Ads Jumbo. While waiting for approval, we can also first do a test so that we can visualise the ads positioning in our app, as shown below.
We should test to see how the ads would be positioned before publishing it.
Yup, that’s all about my journey of getting my first Windows 10 UWP app on the Microsoft Store. Please download it now and let me know what you think. Thank you!
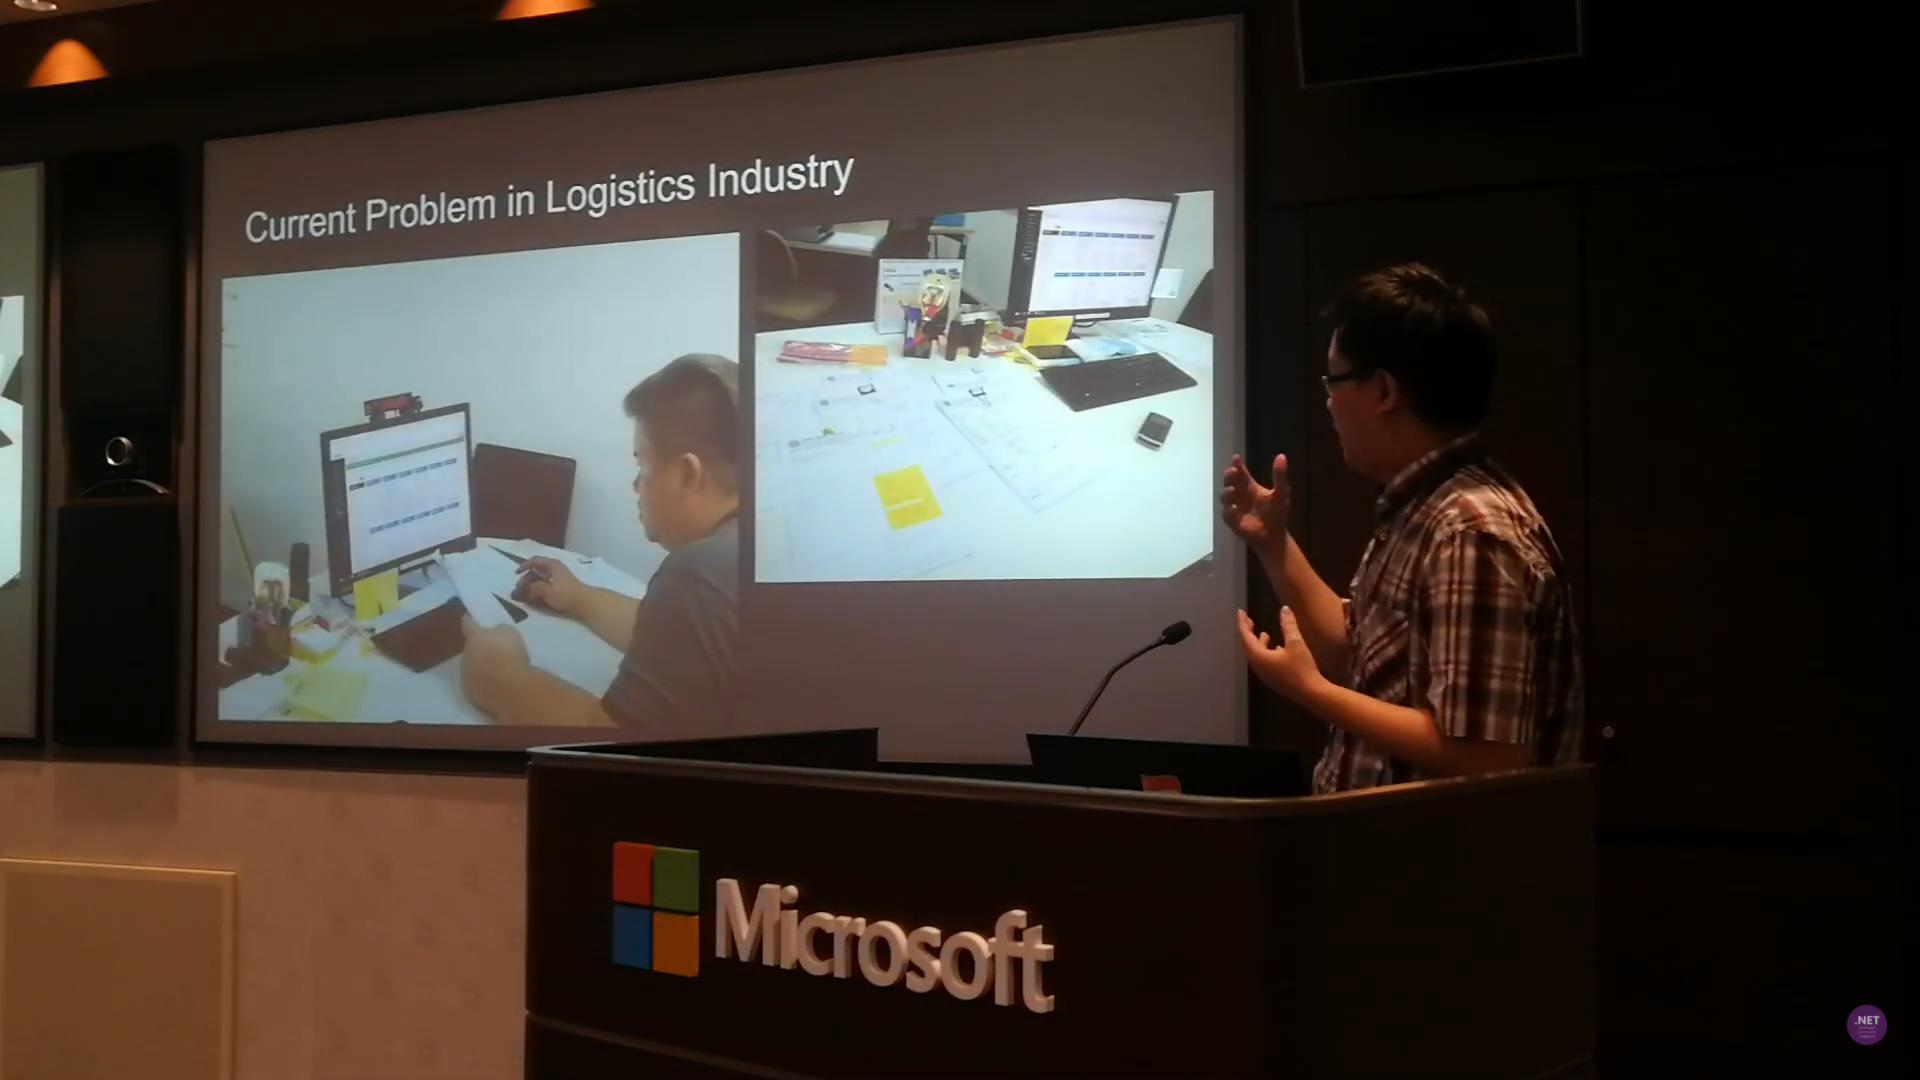
I have been in the logistics and port industry for more than 3 years. I have also been asked by different business owners and managers about implementing OCR in their business solutions for more than 3 years. This is because it’s not only a challenging topic, but also a very crucial feature in their daily jobs.
For example, currently the truck drivers need to manually key in the container numbers into their systems. Sometimes, there will be human errors. Hence, they always have this question about whether there is a feature in their mobile app, for example, that can extract the container number directly from merely a photo of the container.
Tesseract is an open-source OCR engine currently developed and led by Ray Smith from Google. The reason why I choose Tesseract is because there is no Internet connection needed. Hence, OCR can be done quickly without the need to upload images to the cloud to process.
Currently, I have tried out the following two features offered by Tesseract OCR engine.
Reading text from the image with confidence level returned;
Getting the coordinates of the image.
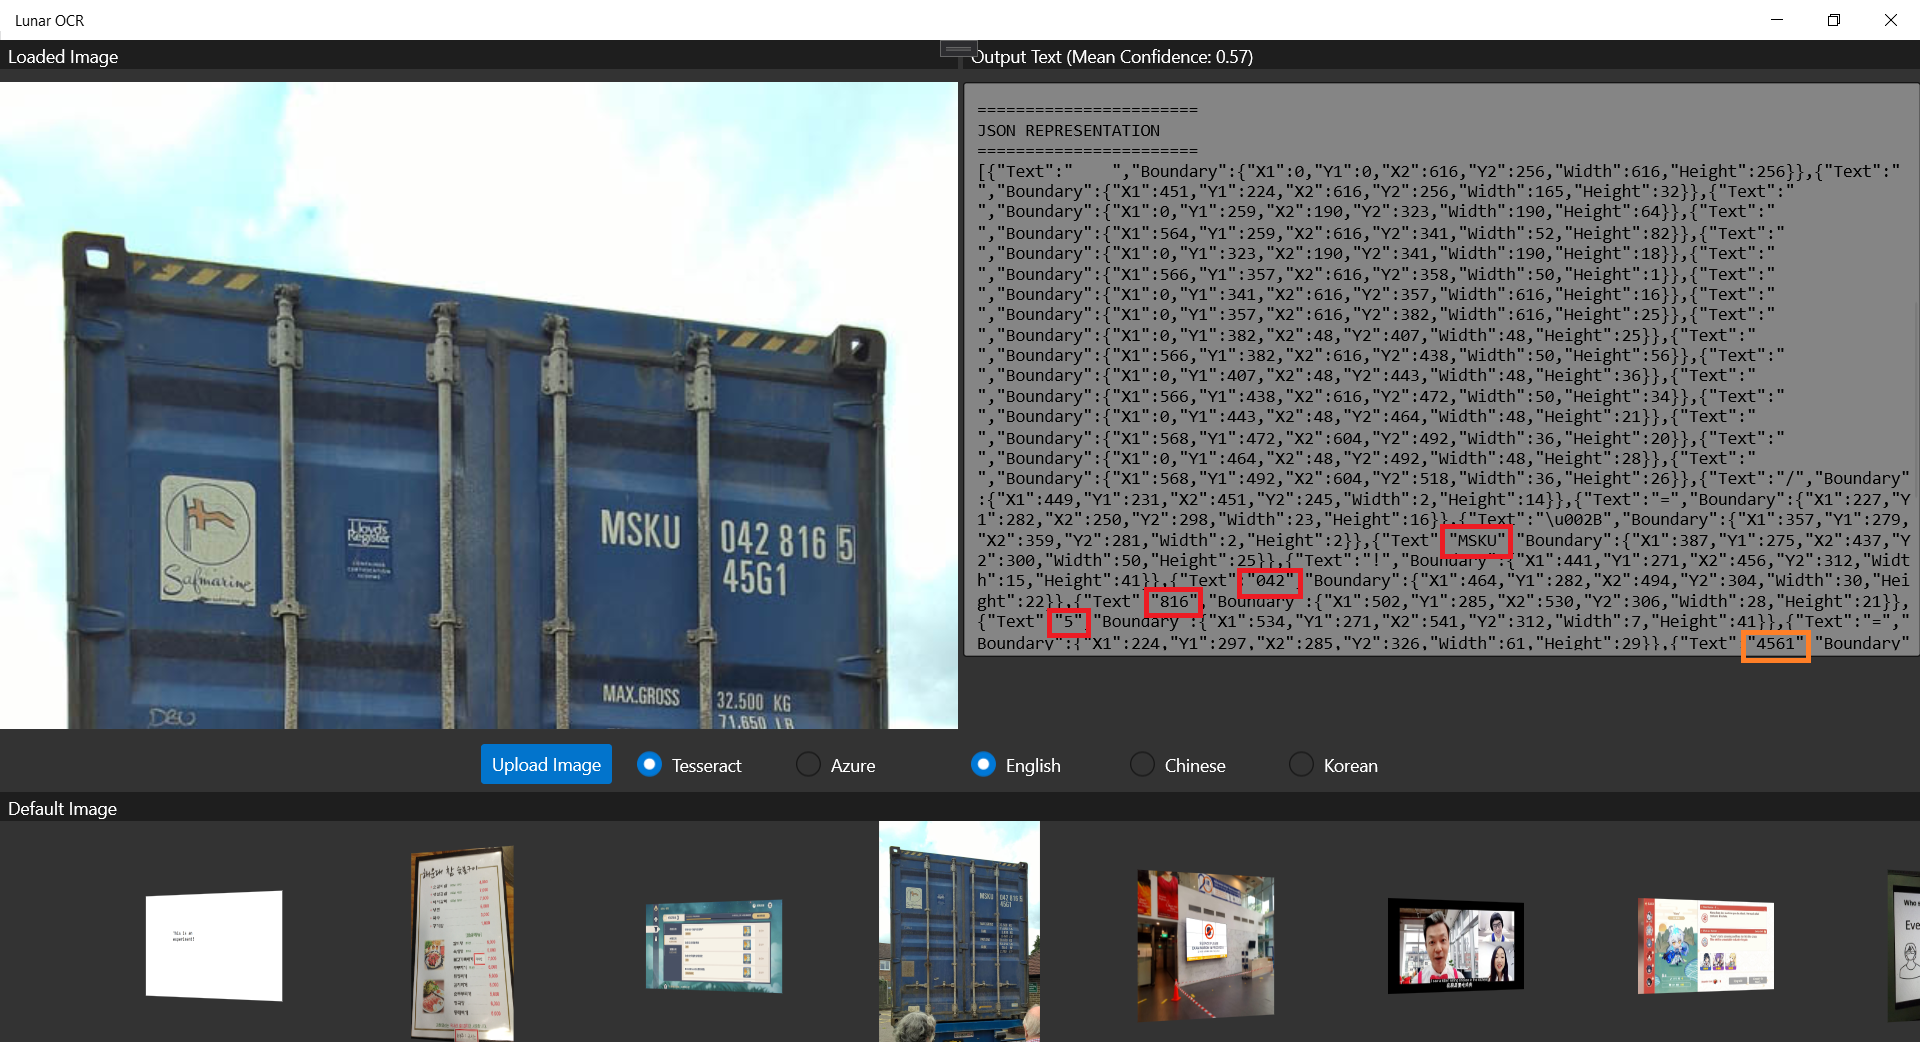
The following screenshot shows that Tesseract is able to retrieve the container number out from a photo of a container.
Only the “45G1” is misread as “4561”m as highlighted by the orange rectangle. The main container number is correctly retrieved from the photo.
Generally, Tesseract is also good at recognizing multiple fonts. However, sometimes we do need to train it based on certain font to improve the accuracy of text recognition. To do so, Bogusław Zaręba has written a very detailed tutorial on how to do it, so I won’t repeat the steps here.
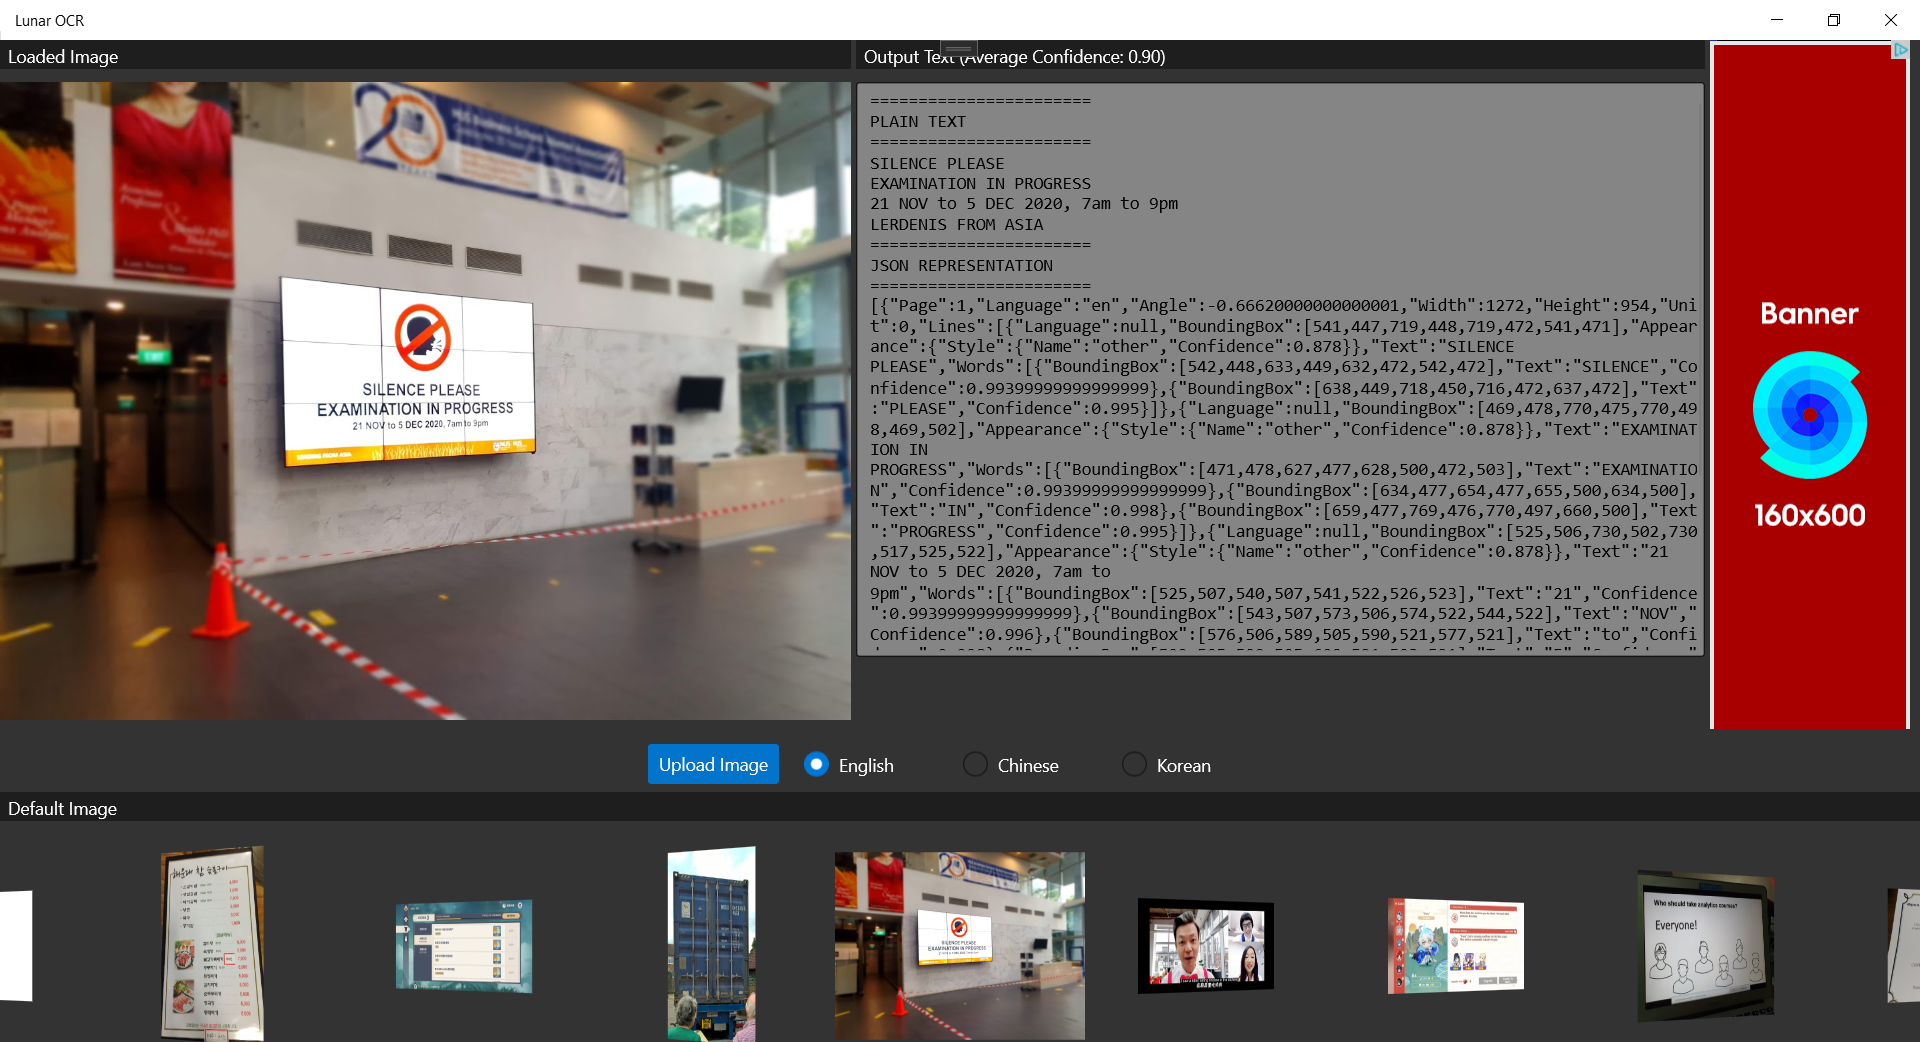
So, let’s see how well Azure OCR engine can recognise the container number shown on the container image above.
Our UWP app can run on the Hololens 2 Emulator.
As shown in the screenshot above, not only the container number, but also the text “45G1” is correctly retrieved by the Computer Vision OCR API. The only downside of the API is that we need to upload the photo to the cloud first and it will then take one to two minutes to process the image.
With Hololens, now I can know what I’m ordering in a Korean restaurant. I want 돼지갈비 (BBQ Pork)~
Conclusion
That’s all for my small little experiment on the two OCR engines, i.e. Tesseract and Azure Computer Vision. Depends on your use cases, you can further update the engine and the UWP app above to make the app works smarter in your business.
Currently I am still having problem of using Tesseract on Hololens 2 Emulator. If you know how to solve this problem, please let me know. Thanks in advance!
This month marks my third year in port and logistics industry.
In April, I attended a talk organised by NUS Business School on the future-ready supply chain. The talk is delivered by Dr Robert Yap, the YCH Group Executive Chairman. During the talk, Dr Yap mentioned that they innovated to survive because innovation was always at the heart of their development and growth. To him and his team, technology is not only an enabler for the growth of their business, but also a competitive advantage of the YCH Group.
In YCH Group, they have a vision of integrating the data flows in the supply chain with their unique analytics capabilities so that they can provide a total end-to-end supply chain enablement and transformation. Hence, today I’d like to share about how, with Microsoft Azure, we can build a data pipeline and modern data warehouse which helps to enable logistics companies to gear towards a future-ready supply chain.
Dr Yap shared about the The 7PL™ Strategy in YCH Group.
Two months ago, I also had the opportunity to join an online workshop to learn from Michelle Xie, Microsoft Azure Technical Trainer, about Azure Data Fundamentals. The workshop consists of four modules. In the workshop, we learnt core data concepts, relational and non-relational data offerings in Azure, modern data warehouses, and Power BI. Hence, I will share with you what I have learned in the workshop in this article as well.
About Data
Data is a collection of facts, figures, descriptions, and objects. Hence, data can be texts written on papers, or it can be in digital form and stored inside the electronic devices, or it could be facts that are in our mind. Data can be classified as follows.
Structured Data: Data stored in predefined schemas. Often structured data is managed using Structured Query Language (SQL). Data needs to be normalised so that no data duplication exists.
Unstructured Data: Data that does not naturally contains field and is stored in its natural format until it’s extracted for analysis, for example image, blob, audio, and video.
Unstructured data like image is frequently used in combination with Machine Learning or Azure Cognitive Services capabilities to extract data.
ETL Data Pipeline
To build an data analytical system, we normally will have the following steps in a data pipeline to perform ETL procedure. ETL stands for Extract, Transform and Load. ETL loads data first into the staging storage server and then into the target storage system, as shown below.
ETL procedure in a data processing pipeline.
Data Ingestion: Data is moved from one or many data sources to a destination where it can be stored and further analysed;
Data Processing: Sometimes the raw data may not in the format suitable for querying. Hence, we need to transform and clean up the data;
Data Storage: Once the raw data has been processed, all the cleaned and transformed data will be stored to different storage systems which serve different purposes;
Data Exploration: A way of analysing performance through graphs and charts with business intelligence tools. This is helpful in making informed business decisions.
A map in the Power BI report showing the location of a prime mover within a time period.
There are two ways of capturing the data in the Data Ingestion stage.
The first method is called the Batch Processing where a set of data is first collected over time and then fed into an analytics system to process them in group. For example, the daily sales data collected is scheduled to be processed every midnight. This is not just because midnight is the end of the day but also because the business normally ends at night and thus midnight is also the time when the servers are most likely to have more computing capacity.
Another method will be Streaming model where data is fed into analytics tools as it arrives and the data is processed in real time. This is suitable for use cases like collecting GPS data sent from the trucks because every piece of new data is generated in continuous manner and needs to be sent in real time.
Modern Data Warehouse
A modern data warehouse allows us to gather all our data at any scale easily, and to get insights through analytics, dashboard, and reports. The following image shows the data warehouse components on Azure.
Azure modern data warehouse architecture. (Image Source: Azure Docs)
For a big data pipeline, the data is ingested into Azure through Azure Data Factory in batches, or streamed near real-time using Apache Kafka, Event Hub, or IoT Hub. This data will then land in Azure Data Lake Storage long term persisted storage.
The Azure Data Lake Storage is an enterprise-wide hyper-scale repository for large volume of raw data. It is a suitable staging storage for our ingested data before the data is converted into a format suitable for data analysis. Thus, it can store any data in its native format, without requiring any prior transformations. Data Lake Storage can be accessed from Hadoop with the WebHDFS-compatible REST APIs.
In the logistics industry, the need to store spatial data is greater than ever.
Let’s say a container trucking company collects data about each container delivery through an IoT device installed on the vehicle. Information such as the location and the speed of the prime mover is constantly sent from the IoT device to Azure Event Hub. We then can use Azure Databricks to correlate of the trip data, and also to enrich the correlated data with neighborhood data stored in the Databricks file system.
Pricing tiers available for Azure Analysis Services.
Relational Database Deployment Options on Azure and HOSTING COST
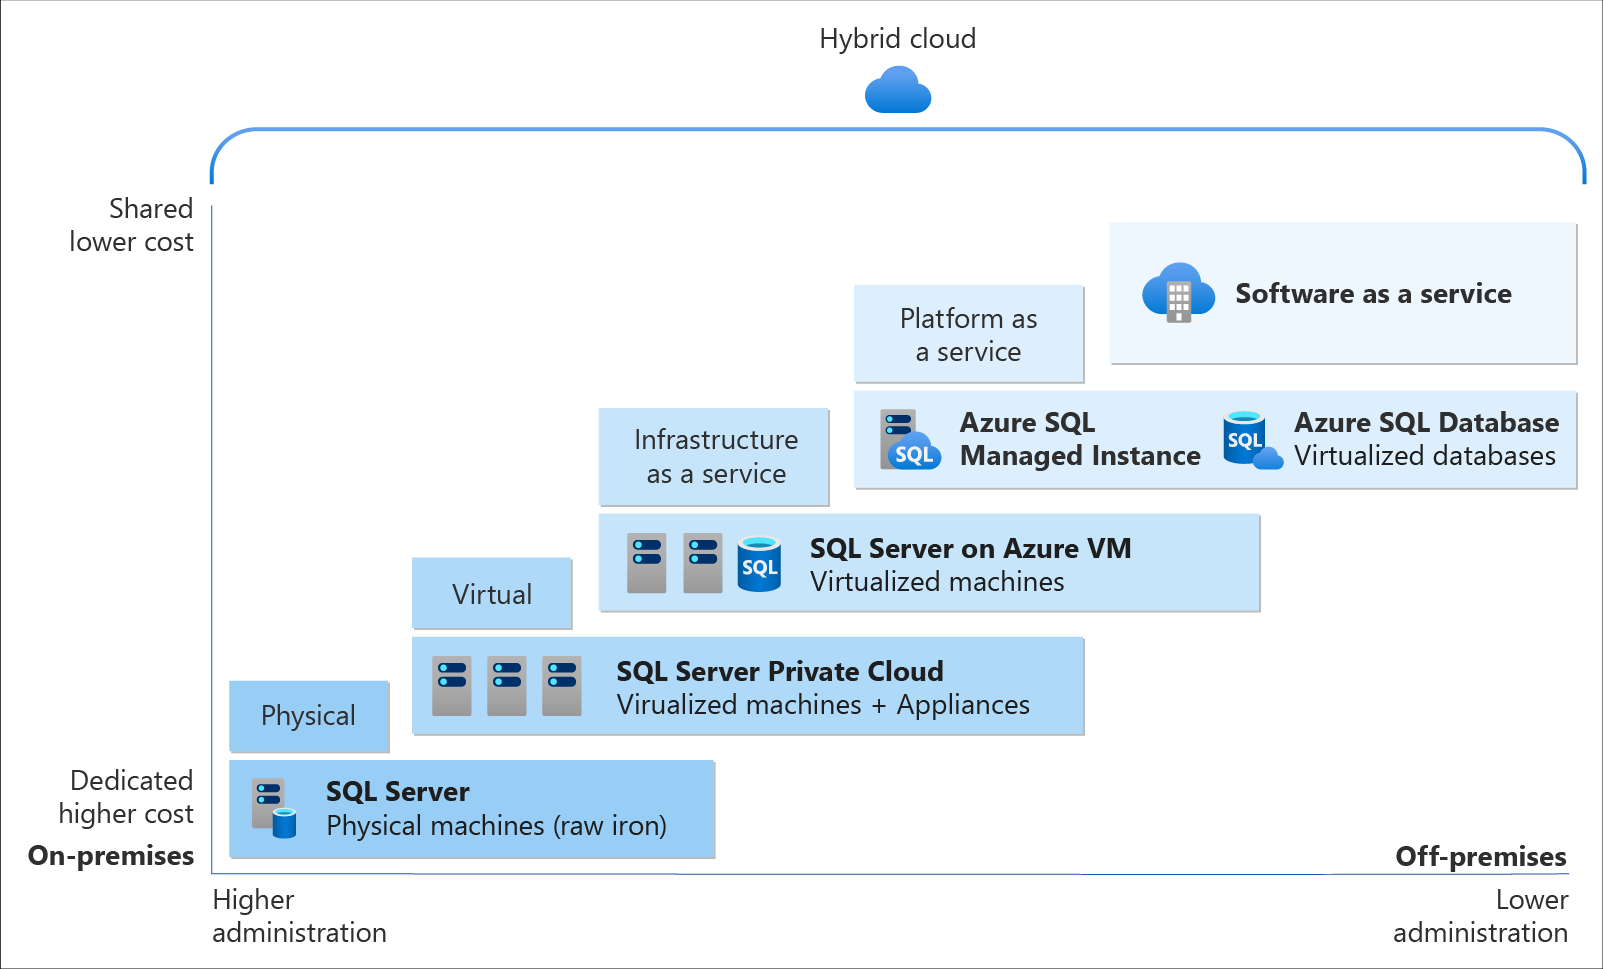
On Azure, there are two database deployment options available, i.e. IaaS and PaaS. IaaS option means that we have to host our SQL server on their virtual machines. For PaaS approach, we are able to either use Azure SQL Database, which is considered as DBaaS, or Azure SQL Managed Instance. Unless there is a need for the team to have OS-level access and control to the SQL servers, PaaS approach is normally the best choice.
Both PaaS and IaaS options include base price that covers underlying infrastructure and licensing. In IaaS, we can reduce the cost by shutting down the resources. However, in PaaS, the resources are always running unless we drop and re-create our resources when they are needed.
The level of administration we have over the infrastructure and by the degree of cost efficiency. (Image Source: Azure Docs)
SQL Managed Instance is the latest deployment option which enables easy migration of most of the on-premises databases to Azure. It’s a fully-fledged SQL instance with nearly complete compatible with on-premise version of SQL server. Also, since SQL Managed Instance is built on the same PaaS service infrastructure, it comes with all PaaS features. Hence, if you would like to migrate from on-premise to Azure without management overhead but at the same time you require instance-scoped features, such as SQL Server Agent, you can try the SQL Managed Instance.
Andreas Wolter, one of the only 7 Microsoft Certified Solutions Masters (MCSM) for the Data Platform worldwide, once came to Singapore .NET Developers Community to talk about the SQL Database Managed Instance. If you’re new to SQL Managed Instance, check out the video below.
Spatial Data Types
Visibility plays a crucial role in the logistics industry because it relates to the ability of supply chain partners to be able to access and share operation information with other parties. Tracking the asset locations with GPS is one of the examples. However, how should we handle the geography data in our database?
In Microsoft SQL Server, native spatial data types are used to represent spatial objects. In addition, it is able to index spatial data, provide cost-based optimizations, and support operations such as the intersection of two spatial objects. This functionality is also available in Azure SQL Database and Azure Managed Instances.
The geometry hierarchy upon which the geometry and geography data types are based. (Image Source: SQL Docs)
Let’s say now we want to find the closest containers to a prime mover as shown in the following map.
The locations of 5 containers (marked as red) and location of the prime mover (marked as blue).
In addition, we have a table of container positions defined with the schema below.
CREATE TABLE ContainerPositions
(
    Id int IDENTITY (1,1),
    ContainerNumber varchar(13) UNIQUE,
    Position GEOGRAPHY
);
Azure Table Storage is one of the Azure services storing non-relational structured data. It provides a key/attribute store with a schema-less design. Since it’s a NoSQL datastore, it is suitable for datasets which do not require complex joins and can be denormalised for fast access.
Globally, supply chain with Industry 4.0 is transformed into a smart and effective procedure to produce new outlines of income. Hence, the key impression motivating Industry 4.0 is to guide companies by transforming current manual processes with digital technologies.
Hard-copy of container proof of delivery (POD), for example, is still necessary in today’s container trucking industry. Hence, storing images and files for document generation and printing later is still a key feature in the digitalised supply chain workflow.
Proof of Delivery is now still mostly recorded on paper and sent via email or instant messaging services like Whatsapp. There is also no acceptable standard for what a proof of delivery form should specify. Each company more or less makes up their own rules.
On Azure, we can make use of Blob Storage to store large, discrete, binary objects that change infrequently, such as the documents like Proof of Delivery mentioned earlier.
Hence, as shown in the screenshot below, we can upload files from a computer to the Azure File Share directly. Then the files will be accessible in another computer which is also connected to the Azure File Share, as shown below.
We can mount Azure File Share on macOS, Windows, and even Linux.
The Data Team
Setting up a new data team, especially in a startup, is a challenging problem. We need to explore roles and responsibilities in the world of data.
There are basically three roles that we need to have in a data team.
Database Administrator: In charge of operations such as managing the databases, creating database backups, restoring backups, monitoring database server performance, and implementing data security and access rights policy.
Tools: SQL Server Management Studio, Azure Portal, Azure Data Studio, etc.
Data Engineer: Works with the data to build up data pipeline and processes as well as apply data cleaning routine and transformations. This role is important to turn the raw data into useful information for the data analysis.
Tools: SQL Server Management Studio, Azure Portal, Azure Synapse Studio.
Data Analysis: Explores and analyses data by creating data visualisation and reporting which transforms data into insights to help in business decision making.
Tools: Excel, Power BI, Power BI Report Builder
In 2016, Gartner, a global research and advisory firm, shared a Venn Diagram on how data science is multi-disciplinary as shown below. Hence, there are some crucial technical skills needed, such as statistics, querying, modelling, R, Python, SQL, and data visualisation. Besides the technical skill, the team also needs to be equipped with business domain knowledge and soft skills.
The data science Venn Diagram. (Image source: Gartner)