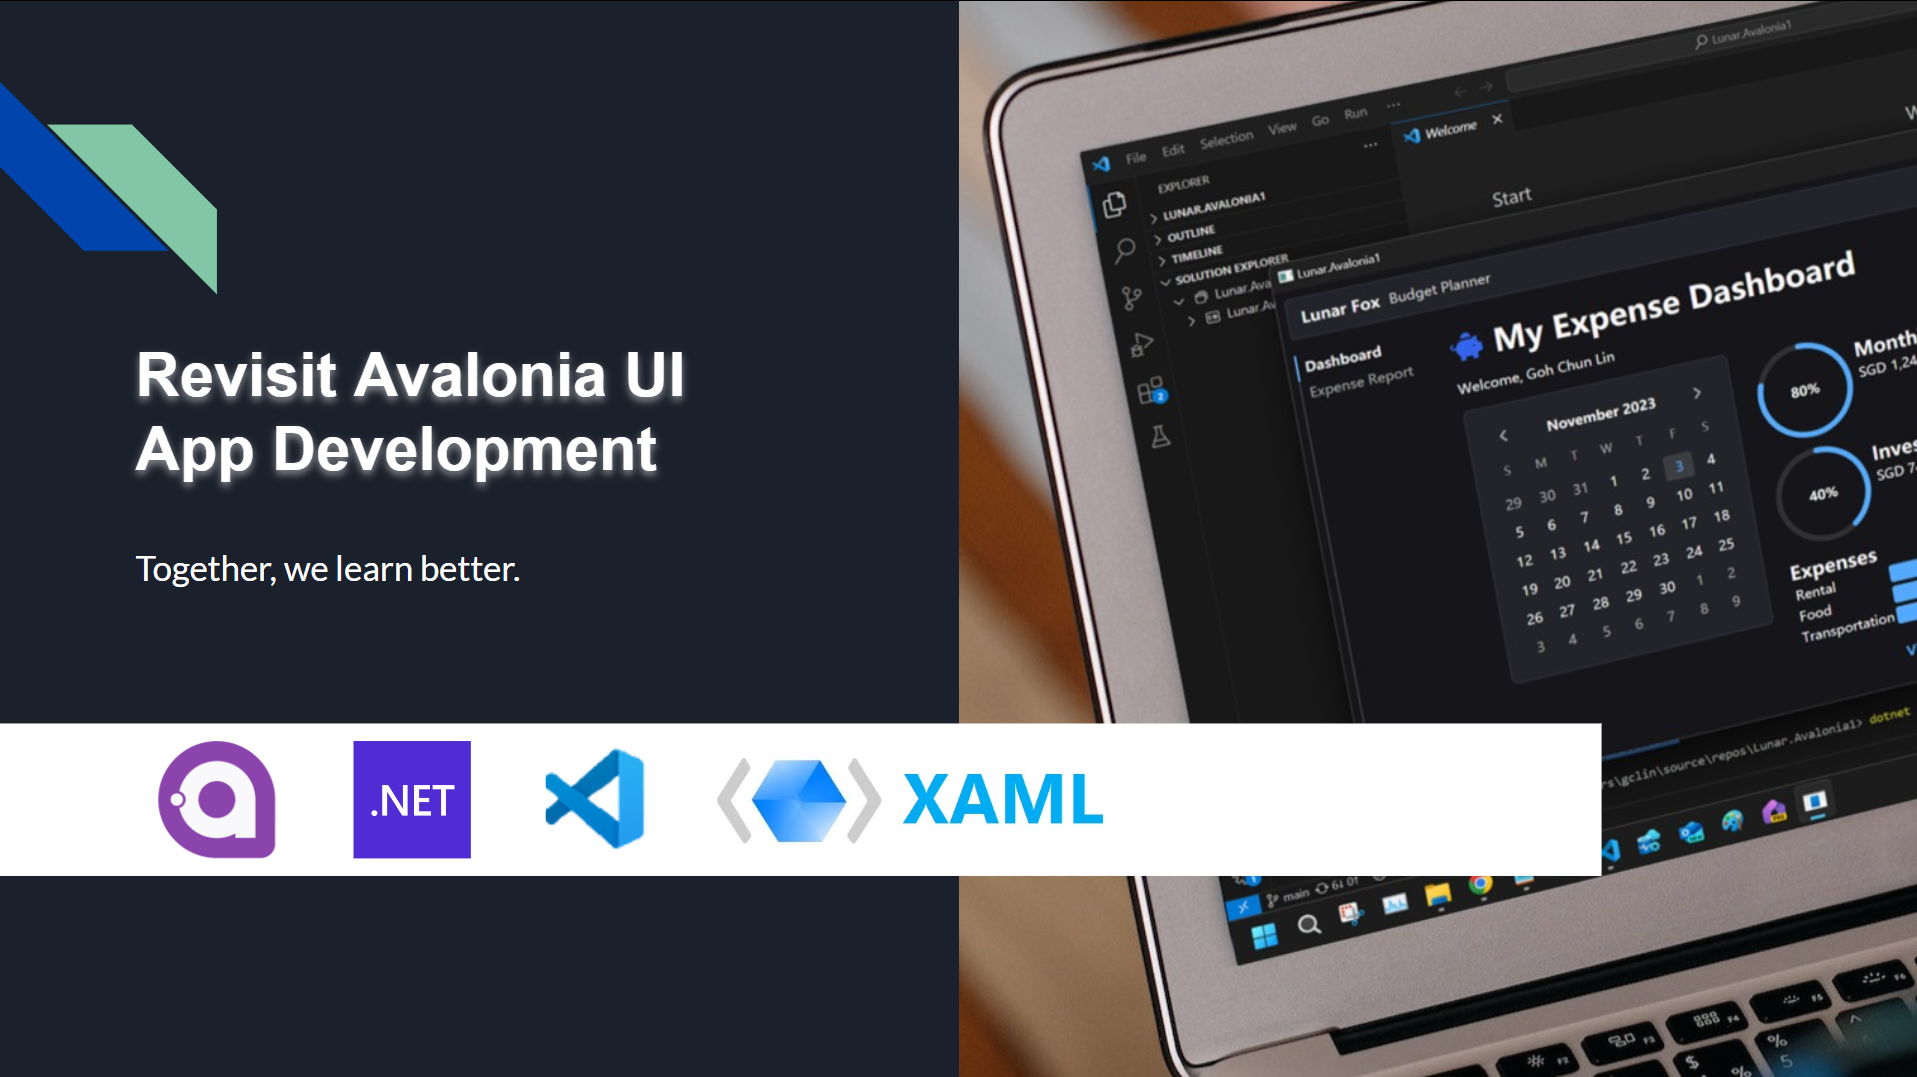
Back in April 2018, I had the priviledge of sharing about Avalonia UI app development with the Singapore .NET Developers Community. At the time, Avalonia was still in its early stages, exclusively tailored for the creation of cross-platform desktop applications. Fast forward to the present, five years since my initial adventure to Avalonia, there is a remarkable transformation in this technology landscape.
In this artlcle, I will share about my new development experience with Avalonia UI.
About Avalonia UI
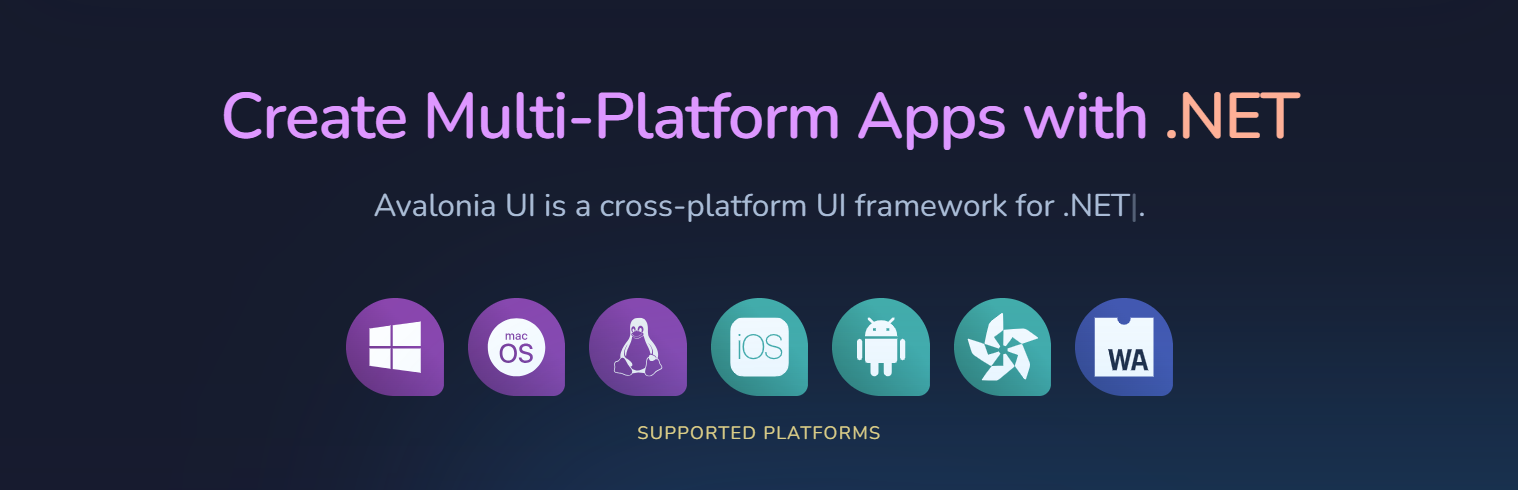
Avalonia UI, one of the .NET Foundations projects, is an open-source, cross-platform UI framework designed for building native desktop apps. It has been described as the spiritual successor to WPF (Windows Presentation Foundation), enabling our existing WPF apps to run on macOS and Linux without expensive and risky rewrites.
Hence, for WPF developers, they will find the transition to Avalonia relatively smooth because they can apply their knowledge of XAML and WPF design patterns to create UI layouts in Avalonia easily. With Avalonia, they can reuse a significant portion of their existing WPF code when developing cross-platform apps. This reusability can save time and effort in the development process.
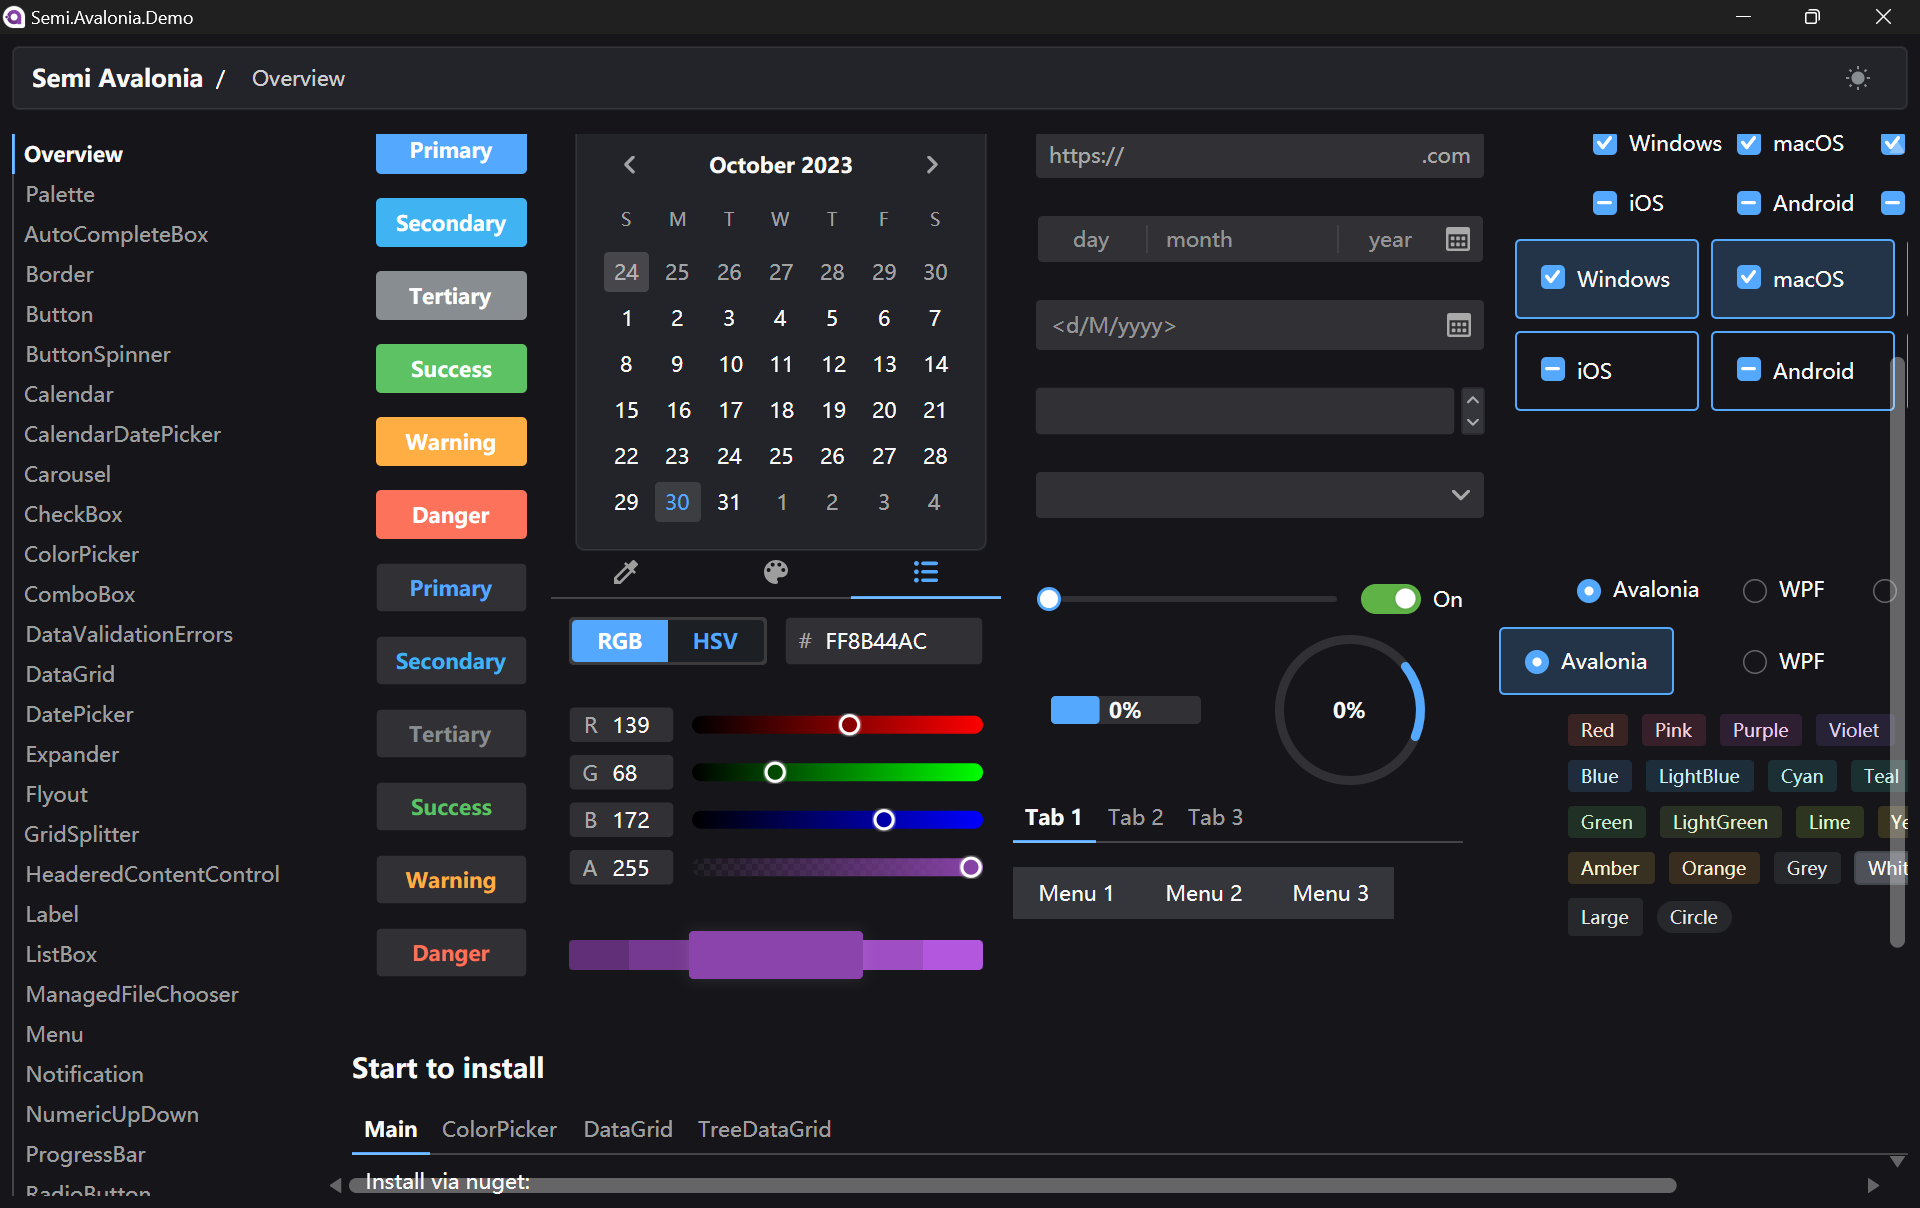
Semi.Avalonia is a theme inspired by Semi Design, a design system designed and currently maintained by Douyin. The reason why I chose Semi.Avalonia is because there is a demo app which demonstrating all of the general controls and styles available to develop Avalonia apps.
There is a demo executable available for us to play around with Semi Avalonia Themes.
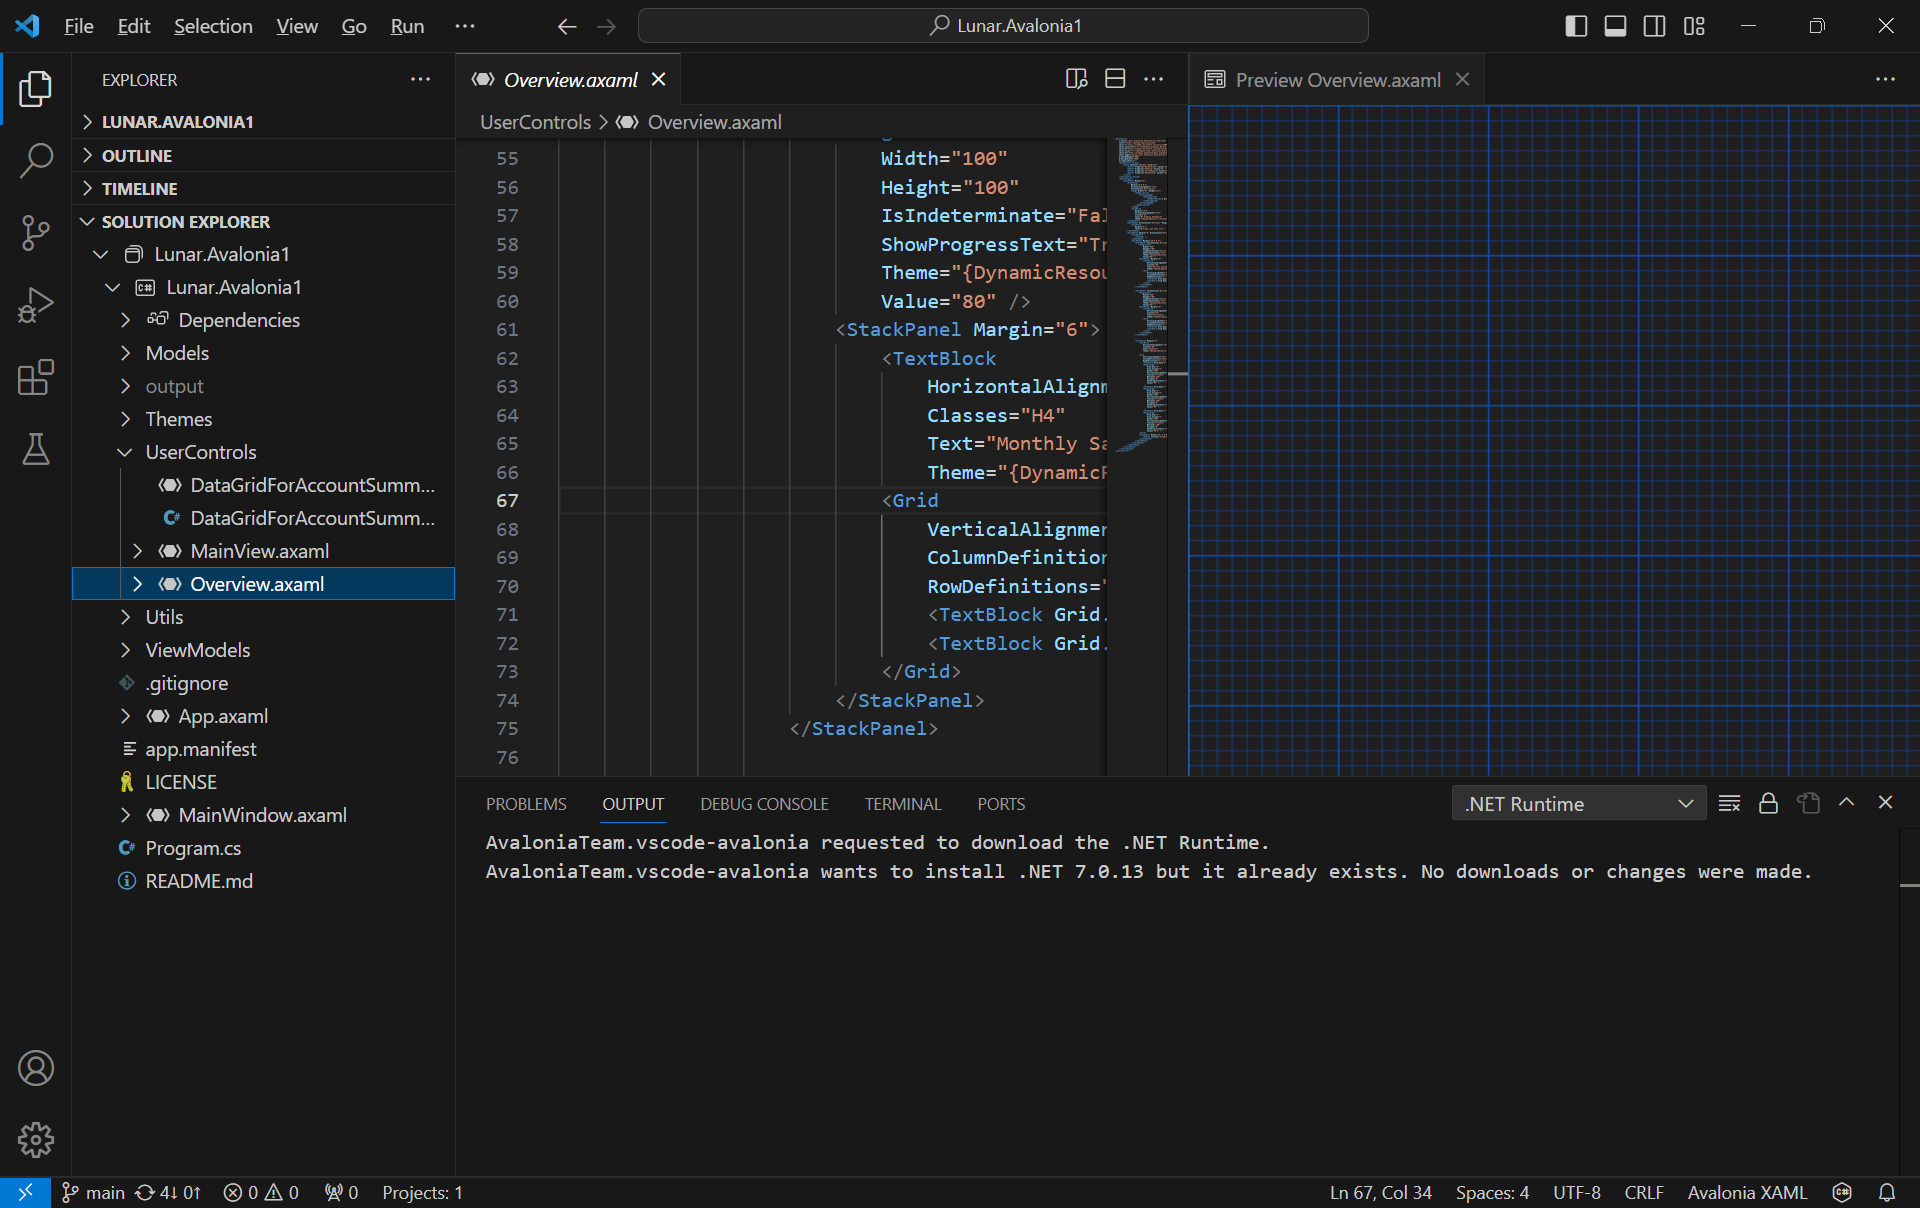
The Avalonia XAML Previewer offers real-time visualisation of XAML code. With this capability, developers can deftly craft and refine user interfaces, swiftly pinpoint potential issues, and witness the immediate effects of their alterations.
Unlike Visual Studio, VS Code will reuse the single preview window. Hence, the previewer will refresh everytime when we switch between multiple XAML files.
With C# Dev Kit, we can now manage our projects with the Solution Explorer that we have been very familiar with on the Visual Studio.
Besides the normal file explorer, we now can have the Solution Explorer in VS Code too.
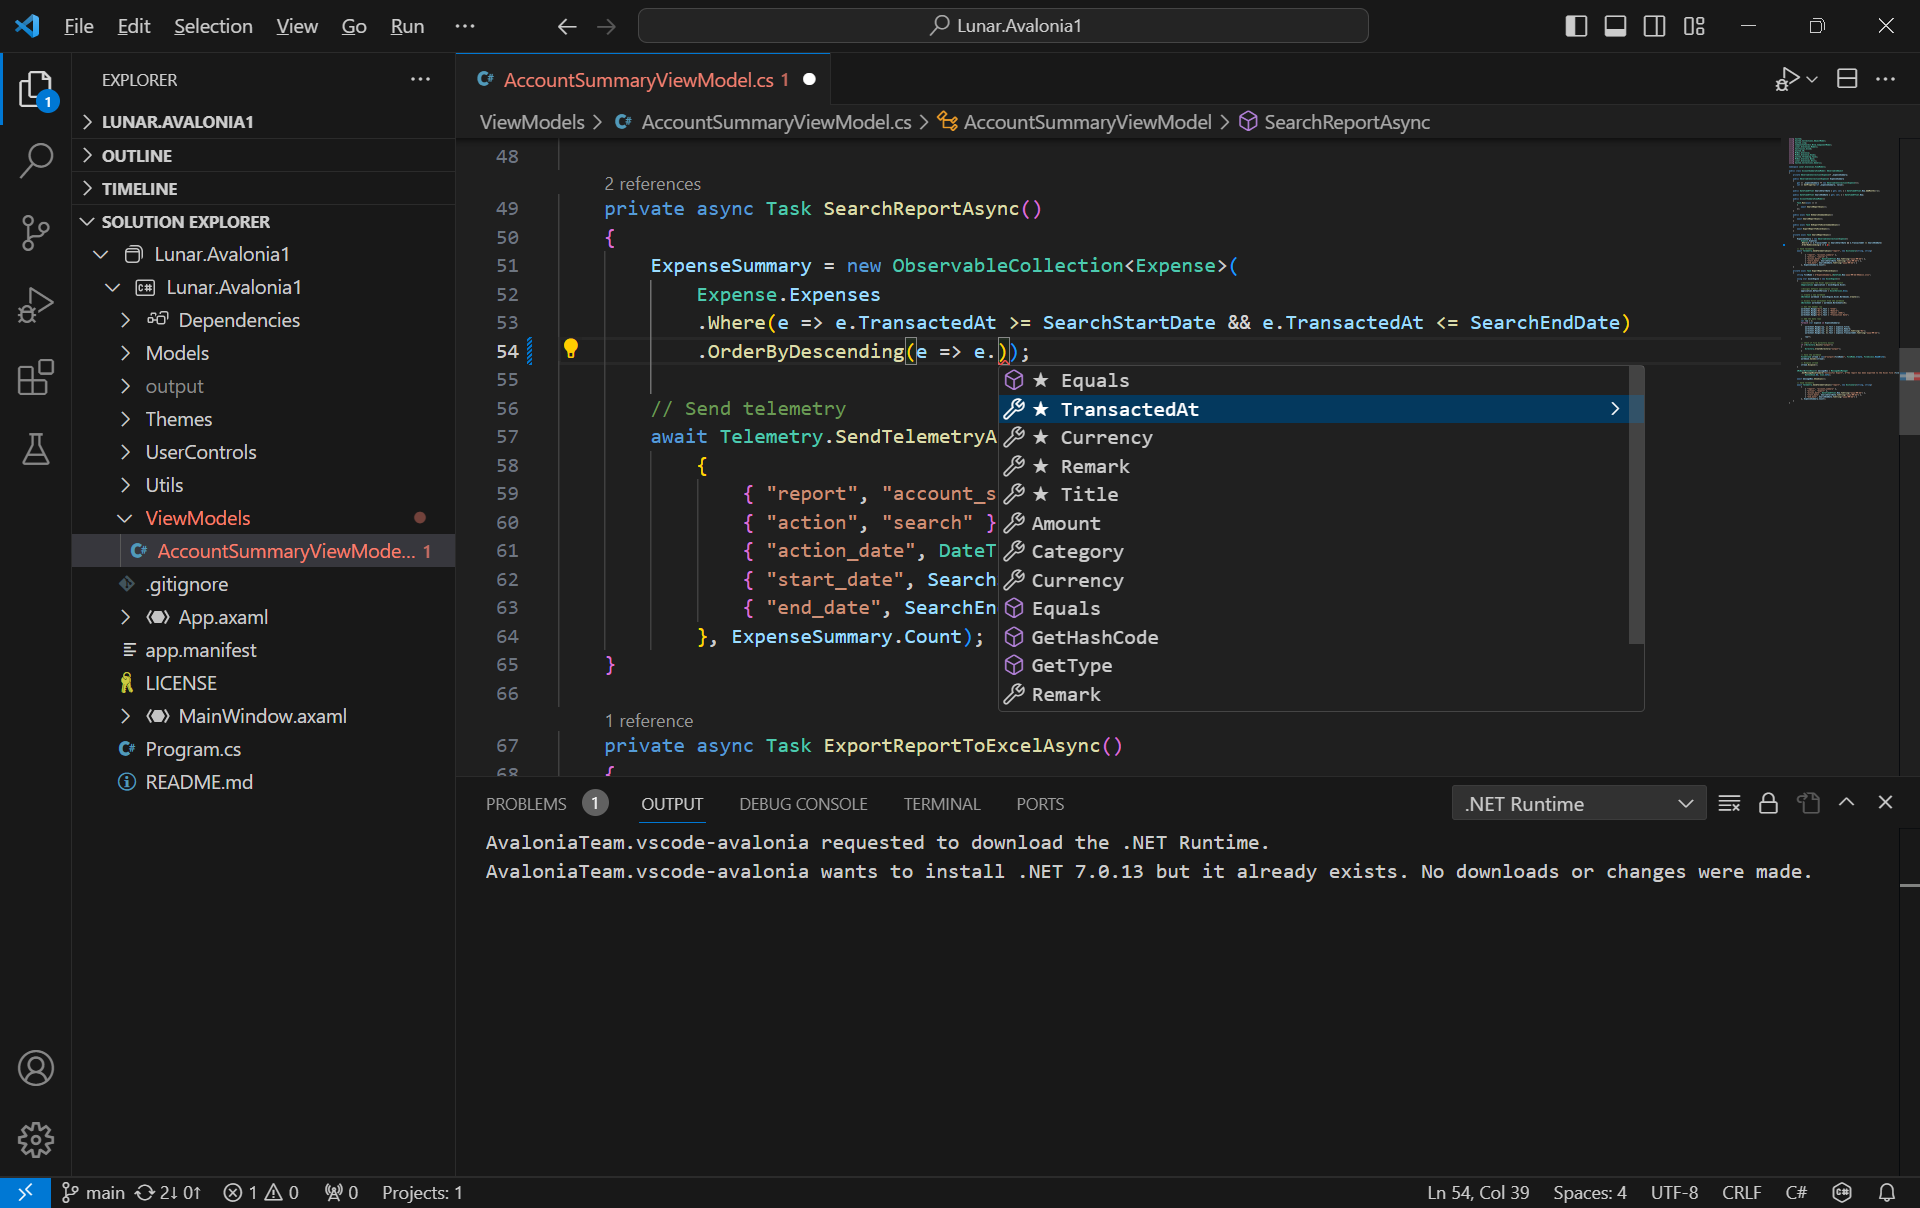
Since the IntelliCode for C# Dev Kit extension is installed together, on top of the basic IntelliSense code-completion found in the existing C# extension, we can also get powerful IntelliCode features such as whole-line completions and starred suggestions based on our personal codebase.
AI-assisted IntelliCode predicts the most likely correct method to use in VSCode.
Grafana Dashboard
Next, I would like to talk about the observability of an app.
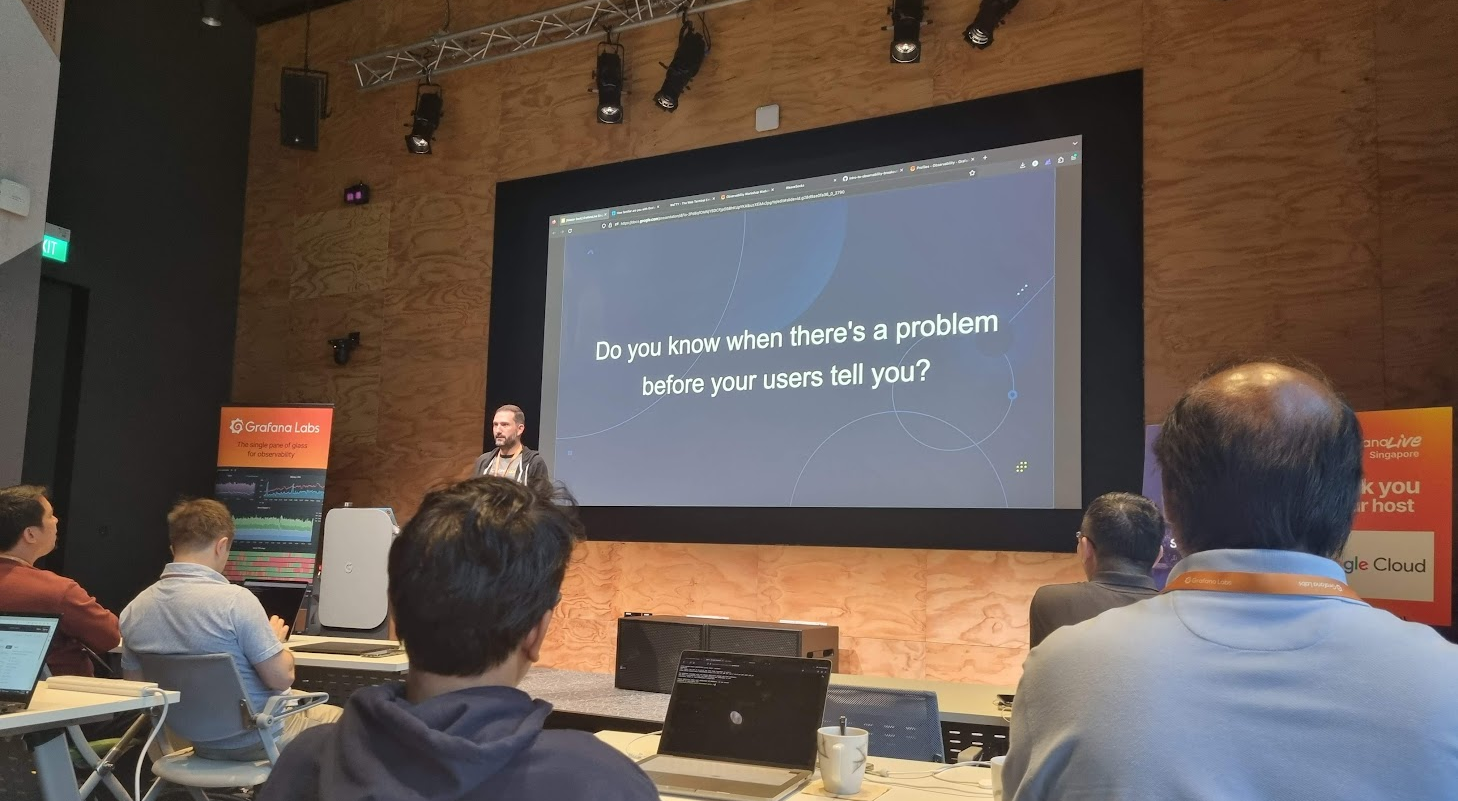
Observability plays a crucial role in system and app management, allowing us to gain insights into the inner workings of the system, understand its functions, and leverage the data it produces effectively.
In the realm of observability, our first concern is to assess how well the system can gauge its internal status merely by examining its external output. This aspect of observability is crucial for proactive issue detection and troubleshooting, as it allows us to gain a deeper insight into performance and potential problems of the system without relying on manual methods.
Effective observability not only aids in diagnosing problems but also in understanding the system behavior in various scenarios, contributing to better decision-making and system optimisation.
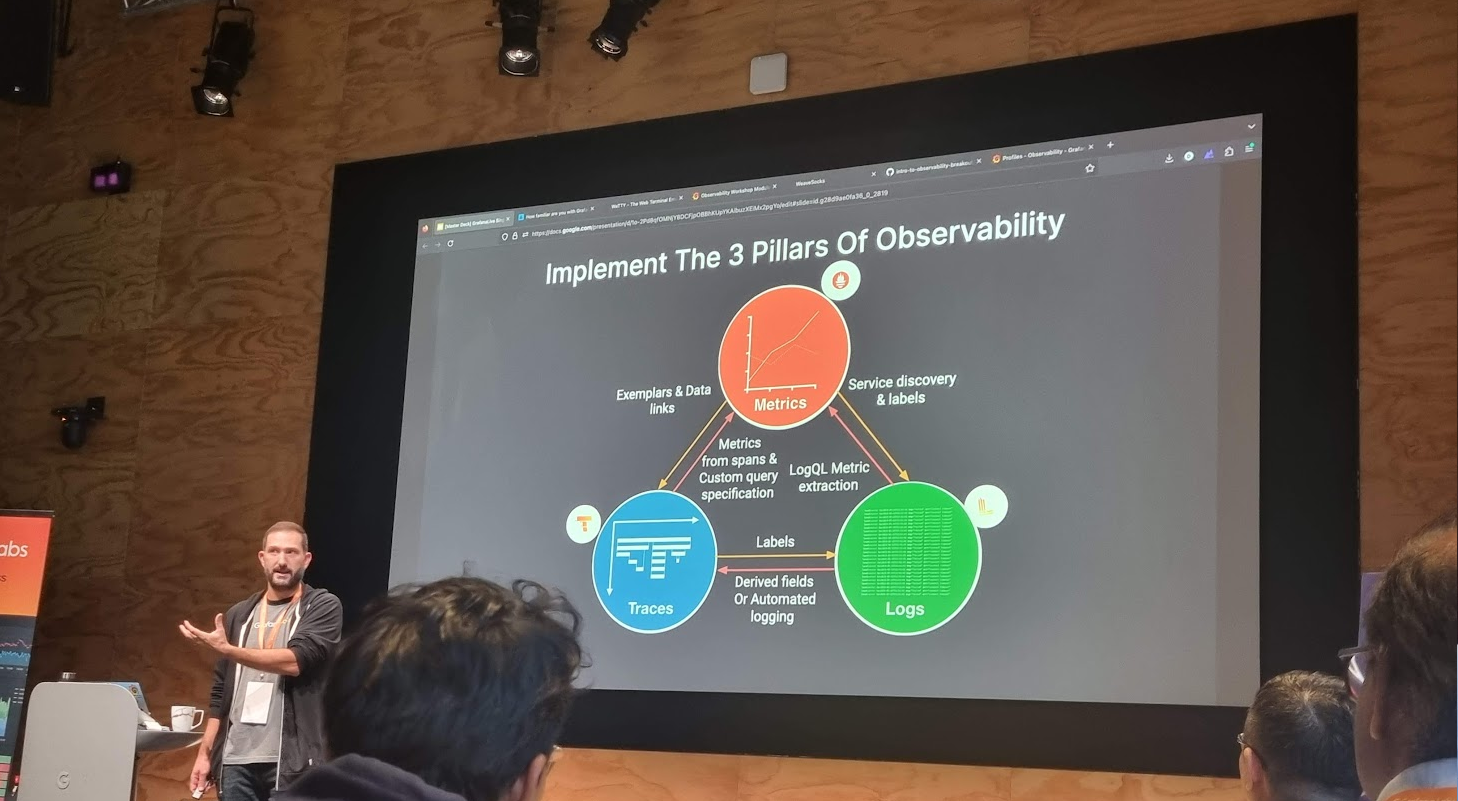
Grafana engineer shared about the 3 pillars of observability.
There are three fundamental components of observability, i.e. monitoring, logging, and tracing. Monitoring enhances the understanding of system actions by collecting, storing, searching, and analysing monitoring metrics from the system.
Prometheus and Grafana are two widely used open-source monitoring tools that, when used together, provide a powerful solution for monitoring and observability. Often, Prometheus collects metrics from various systems and services. Grafana then connects to Prometheus as a data source to fetch these metrics. Finally, we design customised dashboards in Grafana, incorporating the collected metrics.
A simple dashboard collecting metrics from the Avalonia app though HTTP metrics.
We can get started quickly with Grafana Cloud, a hosted version of Grafana, without the need to set up and manage infrastructure components.
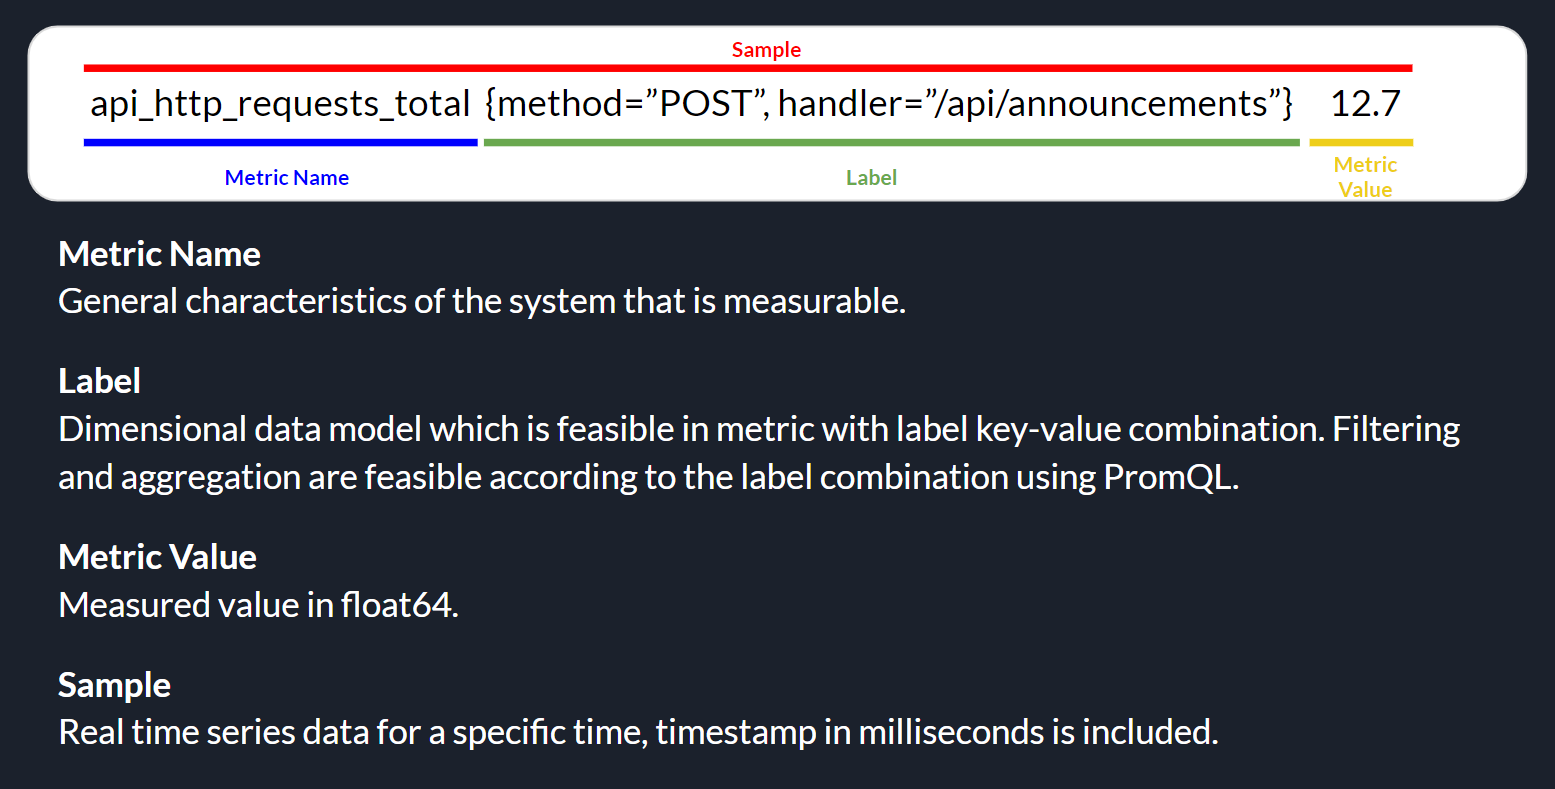
On Grafana Cloud, using the “HTTP Metrics”, we are able to easily send metrics directly from our app over HTTP for storage in the Grafana Cloud using Prometheus. Prometheus uses a specific data model for organising and querying metrics, which includes the components as highlighted in the following image.
Prometheus metrics basic structure.
Thus, in our Avalonia project, we can easily send metrics to Grafana Cloud with the codes below, where apiUrl, userId, and apiKey are given by the Grafana Cloud.
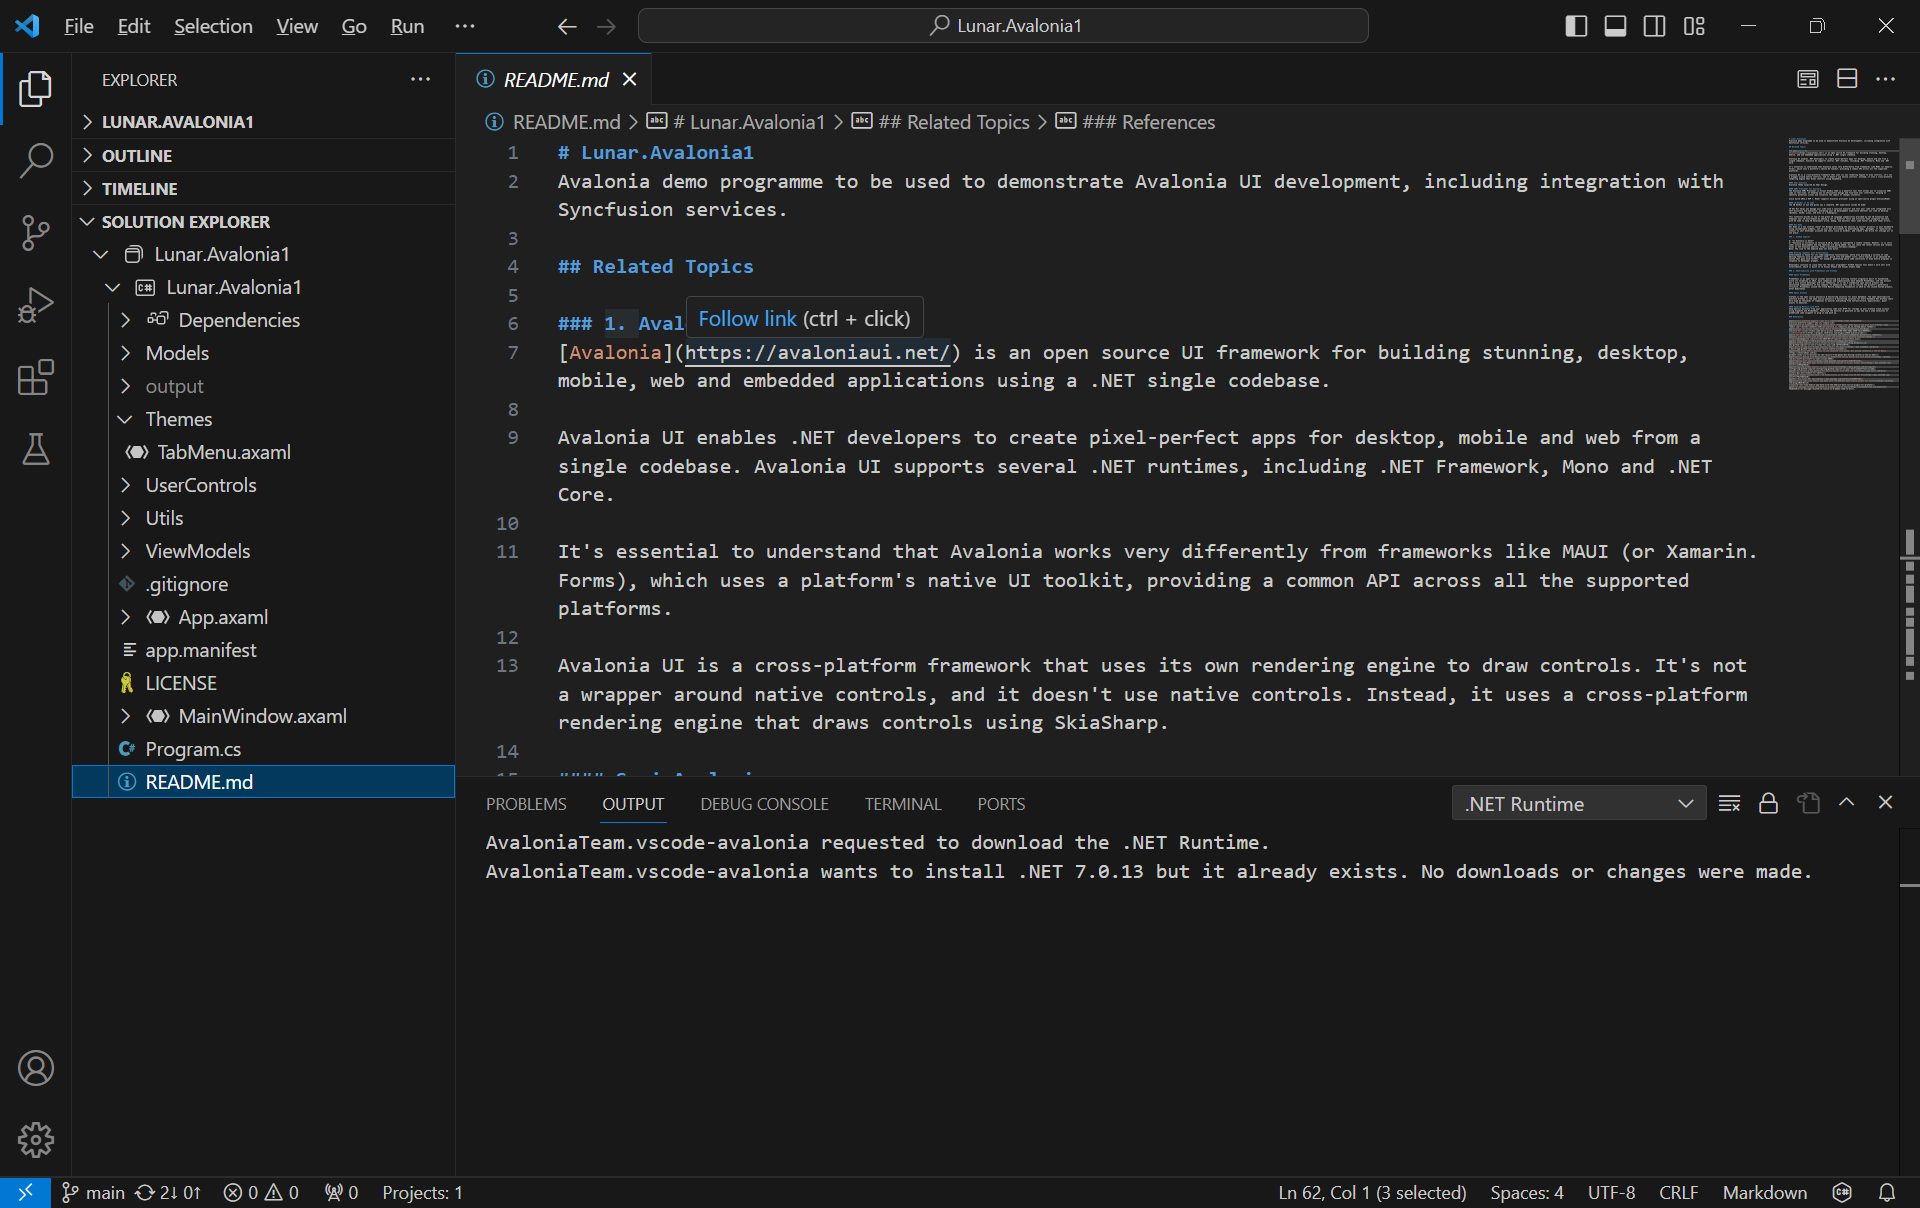
The complete source code of this project can be found at https://github.com/goh-chunlin/Lunar.Avalonia1. In the Readme file, I have also included both the presentation slide and recording for my presentation in the Singapore .NET Developers Community meetup in October 2023.
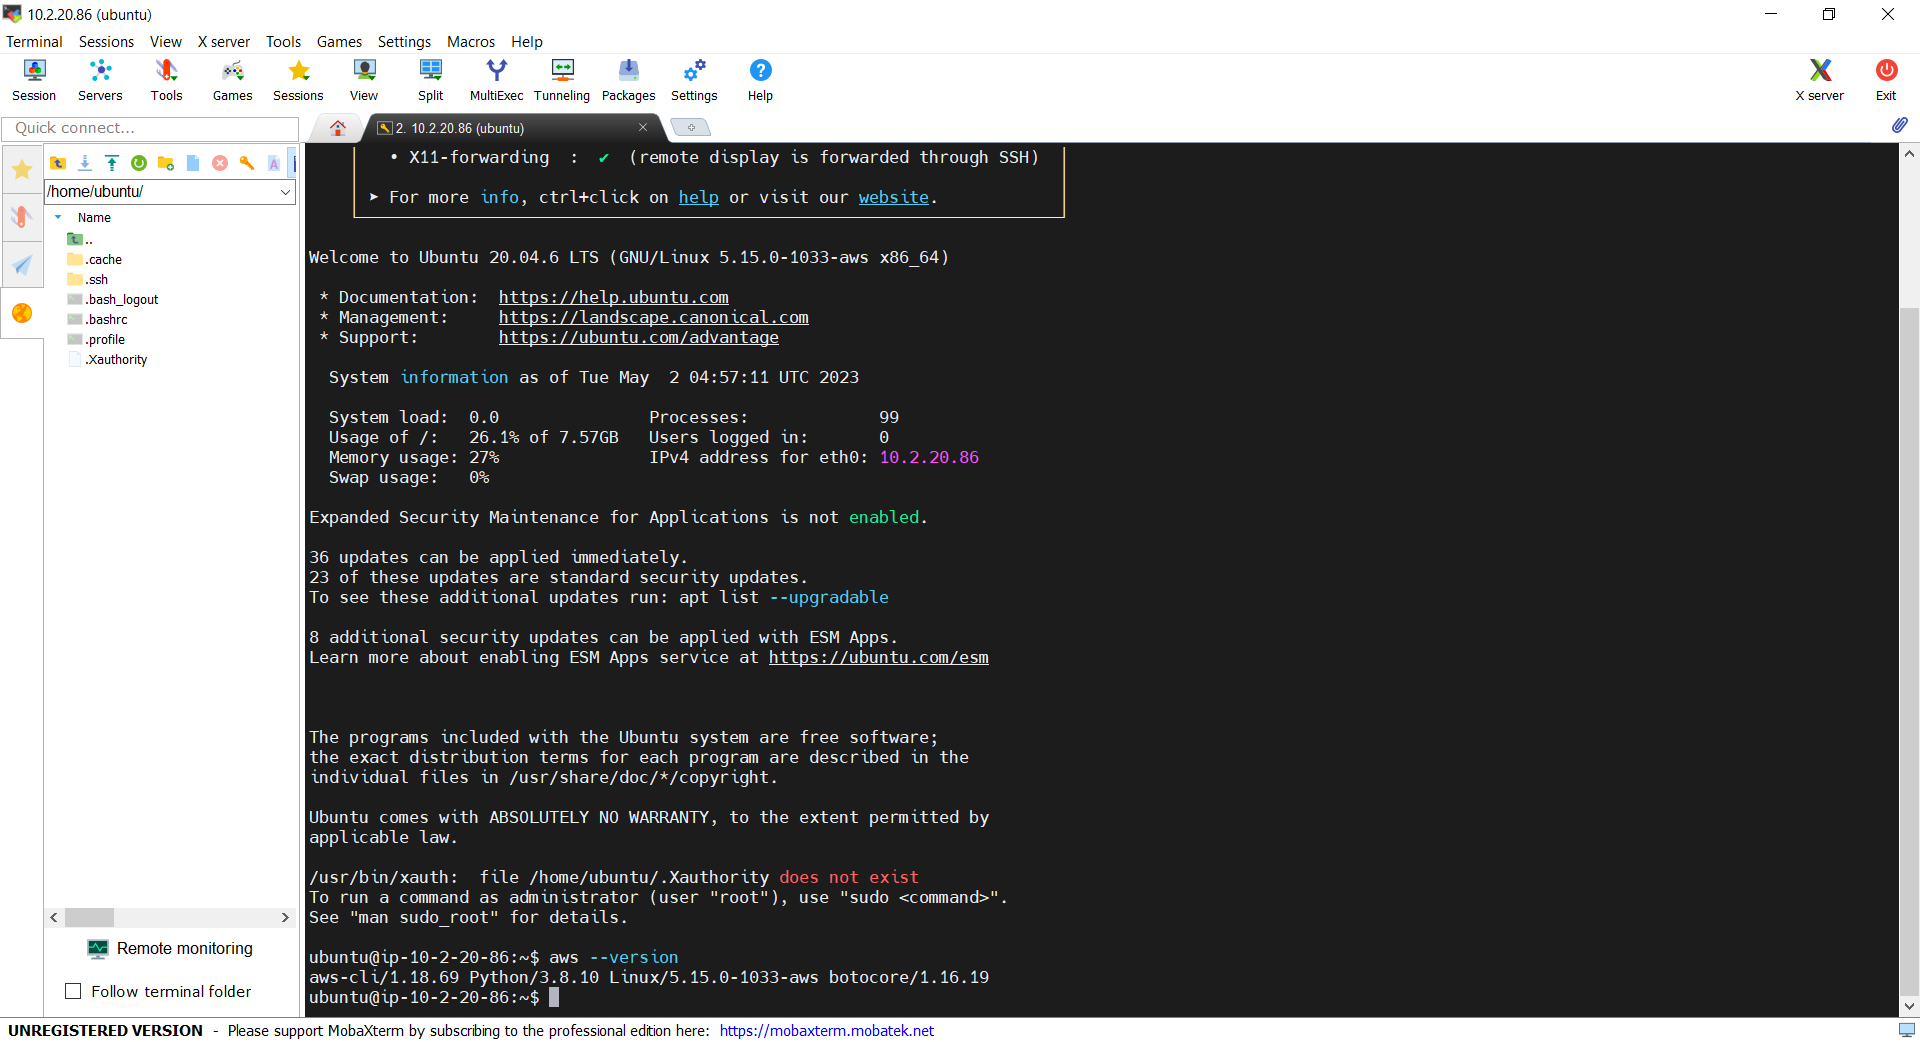
My Avalonia app can run on WSLg without any major issues.
Docker Desktop also includes a standalone Kubernetes server running locally within our Docker instance. It is thus very convenient for the developers to perform local testing easily using Docker Desktop.
Despite Docker Desktop remaining free for small businesses, personal use, education, and non-commercial open source projects, it now requires a paid subscription for professional use in larger businesses. Consequently, my friend expressed a desire for me to suggest a fast and free alternative for development without relying on Docker Desktop.
Install Docker Engine on WSL
Before we continue, we need to understand that Docker Engine is the fundamental runtime that powers Docker containers, while Docker Desktop is a higher-level application that includes Docker Engine. Hence, Docker Engine can also be used independently without Docker Desktop on local machine.
In order to install Docker Engine on Windows without using Docker Desktop, we need to utilise the WSL (Windows Subsystem for Linux) to run it.
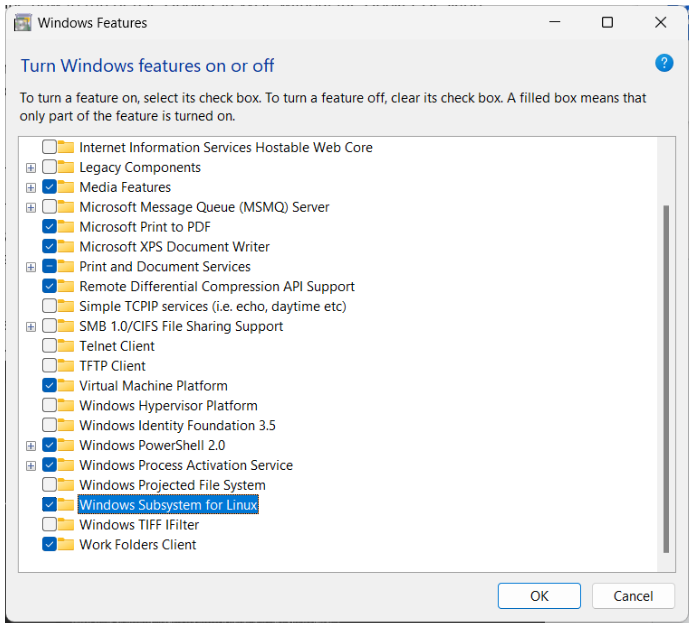
Step 1: Enable WSL
We have to enable WSL from the Windows Features by checking the option “Windows Subsystem for Linux”, as shown in the screenshot below.
After that, we can press “OK” and wait for the operation to be completed. We will then be asked to restart our computer.
If we already have WSL installed earlier, we can update the built-in WSL to the Microsoft latest version of WSL using the “wsl –update” command in Command Prompt.
Later, if we want to shutdown WSL, we can run the command “wsl –shutdown”.
Step 2: Install Linux Distribution
After we restarted our machine, we can use the Microsoft Store app and look for the Linux distribution we want to use, for example Ubuntu 20.04 LTS, as shown below.
We then can launch Ubuntu 20.04 LTS from our Start Menu. To find out the version of Linux you are using, you can run the command “wslfetch”, as shown below.
For the first timer, we need to set the Linux username and password.
Step 3: Install Docker
Firstly, we need to update the Ubuntu APT repository using the “sudo apt update” command.
After we see the message saying that we have successfully updated the apt repository, we can proceed to install Docker. Here, the “-y” option is used to grant the permission to install required packages automatically.
When Docker is installed, we need to make a new user group with the name “docker” by utilising the below-mentioned command.
Docker Engine acts as a client-server application with a server that has a long-running daemon process dockerd. dockerd is the command used to start the Docker daemon on Linux systems. The Docker daemon is a background process that manages the Docker environment and is responsible for creating, starting, stopping, and managing Docker containers.
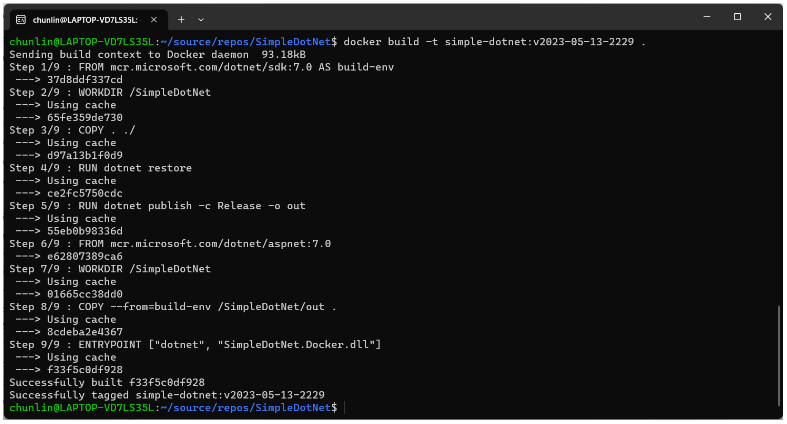
Before we can build images using Docker, we need to use dockerd, as shown in the screenshot below.
Step 4: Using Docker on WSL
Now, we simply need to open another WSL terminal and execute docker commands, such as docker ps, docker build, etc.
With this, we can now push our image to Docker Hub from our local Windows machine.
Configure a local Kubernetes
Now if we try to run the command line tool, kubectl, we will find out that the command is still not yet available.
We can use the following commands to install kubectl.
The following screenshot shows what we can see after running the commands above.
After we have kubectl, we need to make Kubernetes available on our local machine. To do so, we need to install minikube, a local Kubernetes. minikube can setup a local Kubernetes cluster on macOS, Linux, and Windows.
To install the latest minikube stable release on x86-64 Linux using binary download:
Last week, my friend working in the field of infrastructure management gave me an overview of Infrastructure as Code (IaC).
He came across a tool called Terraform which can automate the deployment and management of cloud resources. Hence, together, we researched on ways to build a simple demo in order to demonstrate how Terraform can help in the cloud infrastructure management.
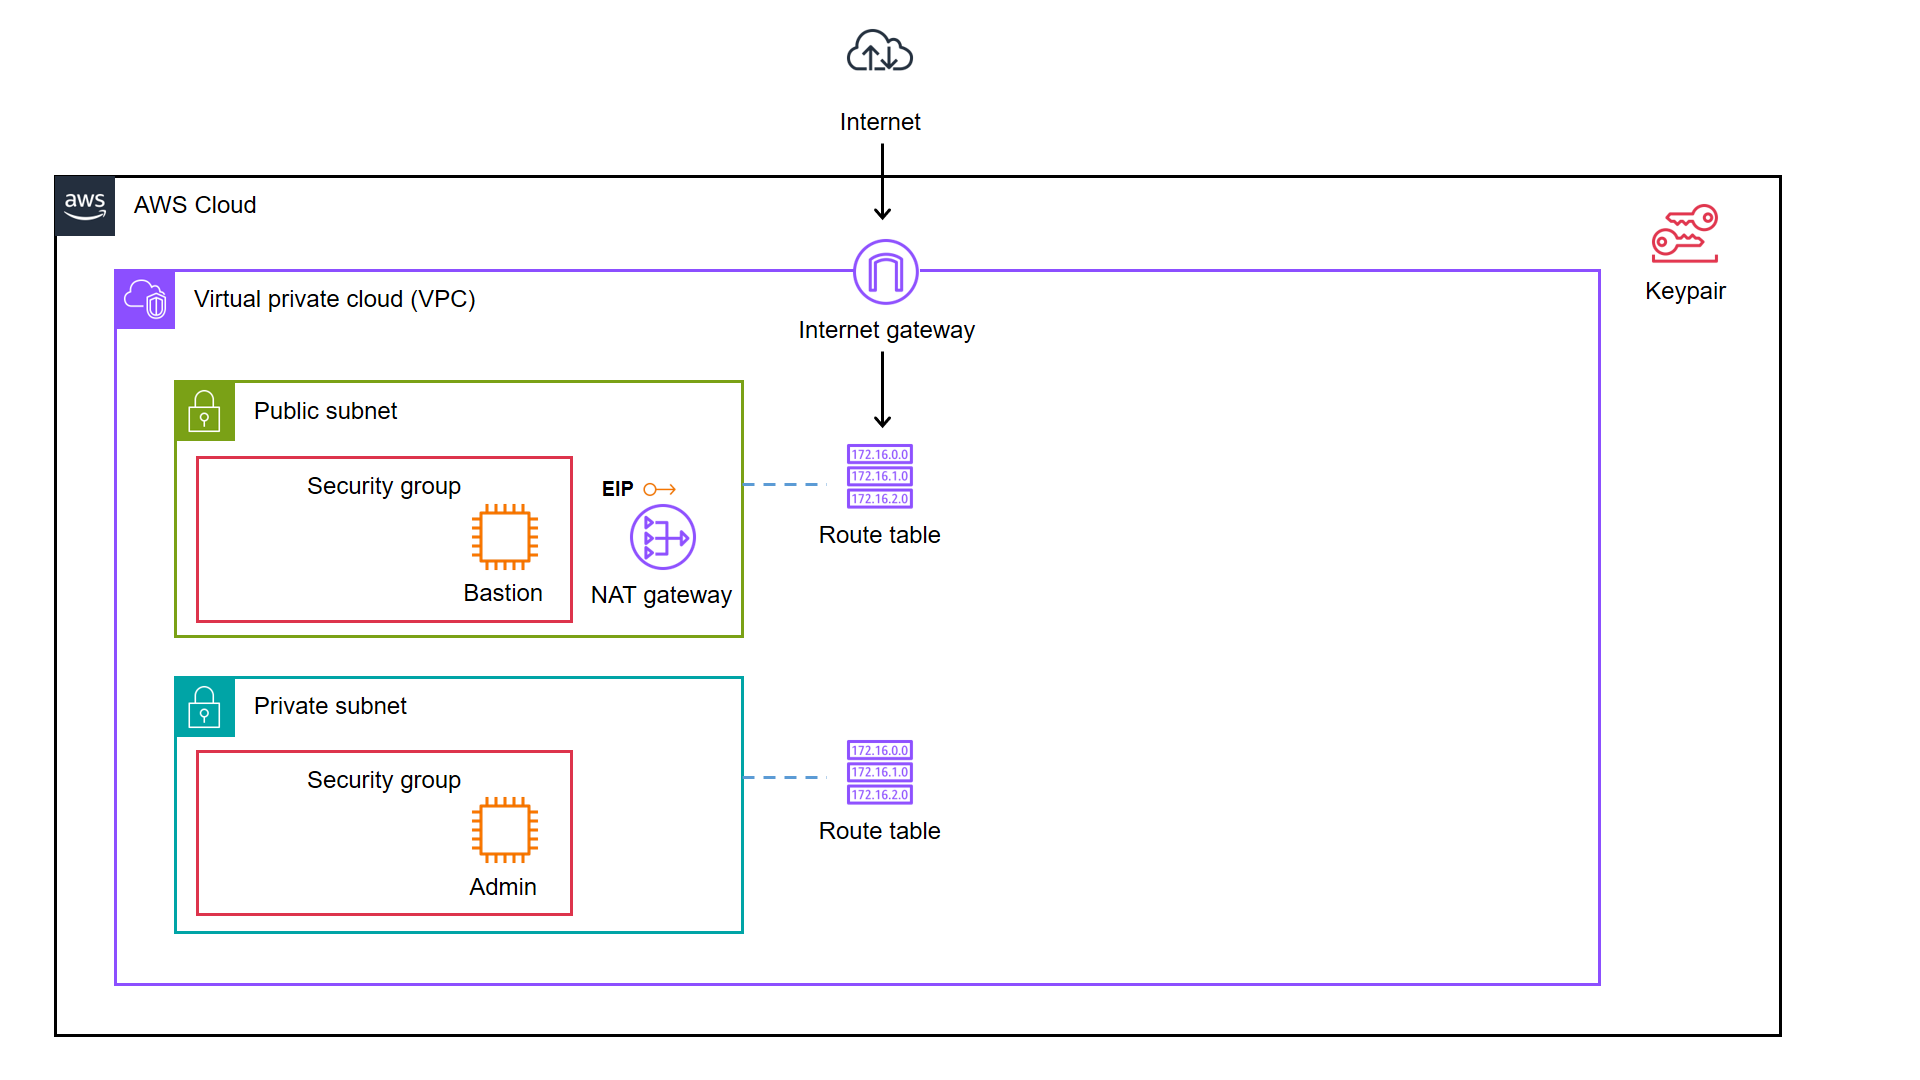
We decided to start from a simple AWS cloud architecture as demonstrated below.
As illustrated in the diagram, we have a bastion server and an admin server.
A bastion server, aka a jump host, is a server that sits between internet network of a company and the external network, such as the Internet. It is to provide an additional layer of security by limiting the number of entry points to the internet network and allowing for strict access controls and monitoring.
An admin server, on the other hand, is a server used by system admins to manage the cloud resources. Hence the admin server typically includes tools for managing cloud resources, monitoring system performance, deploying apps, and configuring security settings. It’s generally recommended to place an admin server in a private subnet to enhance security and reduce the attack surface of our cloud infrastructure.
In combination, the two servers help to ensure that the cloud infrastructure is secure, well-managed, and highly available.
As we can see in the architecture diagram above, the cloud resources are all available on AWS. We can set them up by creating the resources one by one through the AWS Console. However, doing it manually is not efficient and it is also not easy to be repeatedly done. In fact, there will be other problems arising from doing it with AWS Console manually.
Manual cloud resource setup leads to higher possibility of human errors and it takes longer time relatively;
Difficult to identify cloud resource in use;
Difficult to track modifications in infrastructure;
Burden on infrastructure setup and configuration;
Redundant work is inevitable for various development environments;
Restriction is how only the infrastructure PIC can setup the infrastructure.
A concept known as IaC is thus introduced to solve these problems.
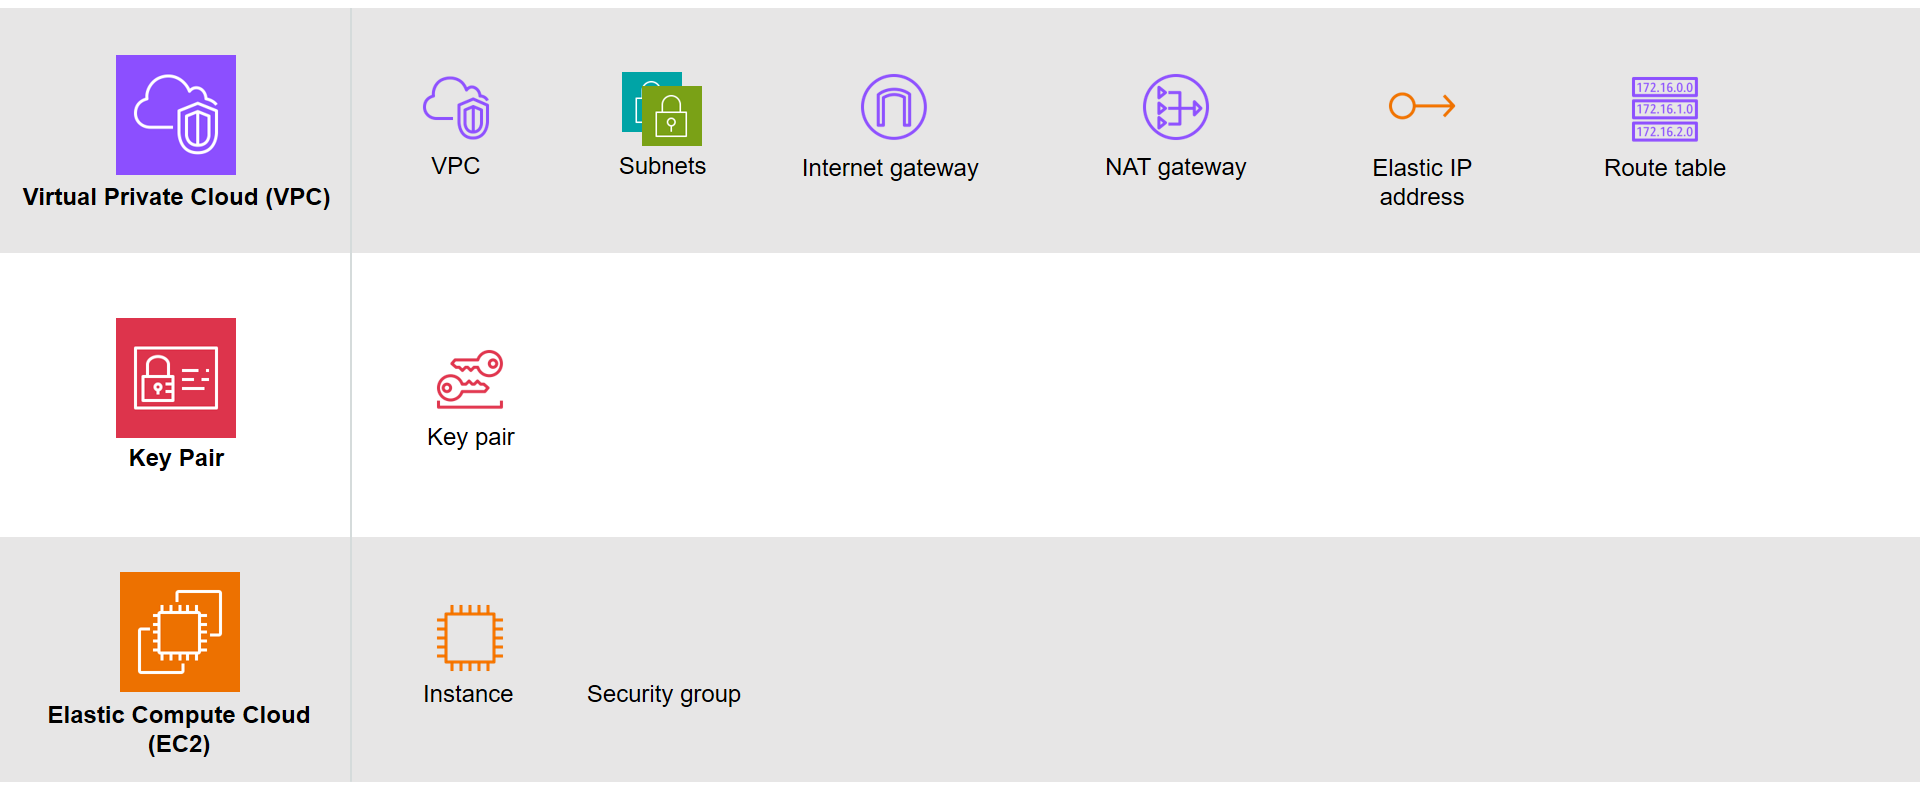
Based on the architecture diagram, the services and resources necessary for configuring with IaC can be categorised into three parts, i.e. Virtual Private Cloud (VPC), Key Pair, and Elastic Compute Cloud (EC2).
The resources necessary to be created.
There are currently many IaC tools available. The tools are categorised into two major groups, i.e. those using declarative language and those using imperative language. Terraform is one of them and it is using Hashicorp Configuration Language (HCL), a declarative language.
The workflow for infrastructure provisioning using Terraform can be summarised as shown in the following diagram.
We first write the HCL code. Then Terraform will verify the status of the code and apply it to the infrastructure if there is no issue in verification. Since Terraform is using a declarative language, it will do the identification of resources itself without the need of us to manually specify the dependency of resources, sometimes.
After command apply is executed successfully, we can check the applied infrastructure list through the command terraform state list. We can also check records of output variable we defined through the command terraform output.
When the command terraform apply is executed, a status information file called terraform.tfstate will be automatically created.
After understanding the basic process of Terraform, we proceed to write the HCL for different modules of the infrastructure.
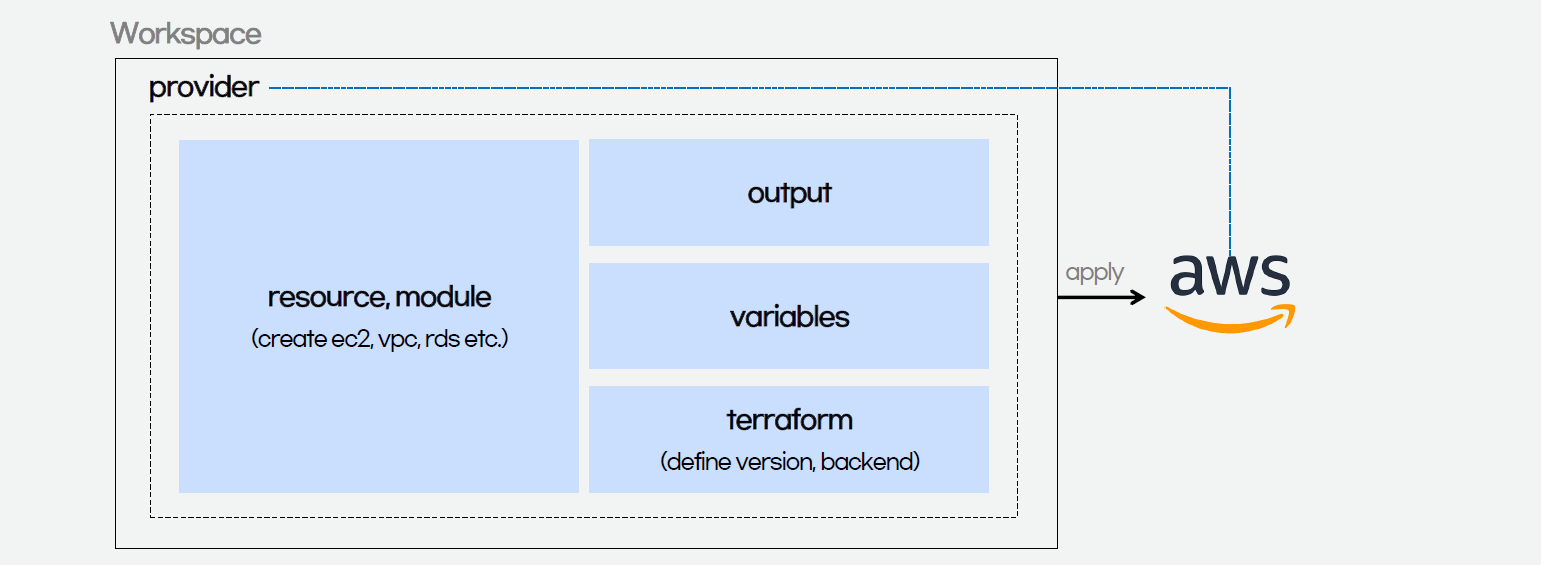
Terraform
The components of a Terraform code written with the HCL are as follows.
Terraform code.
In Terraform, there are three files, i.e. main.tf, variables.tf, and outputs.tf recommended to have for a minimal module, even if they’re empty. The file main.tf should be the primary entry point. The other two files, variables.tf and outputs.tf, should contain the declarations for variables and outputs, respectively.
For variables, we have vars.tf file which defines the necessary variables and terraform.tfvars file which allocated value to the defined variables.
In the diagram above, we also see that there is a terraform block. It is to declare status info, version info, action, etc. of Terraform. For example, we use the following HCL code to set the Terraform version to use and also specify the location for storing the status info file generated by Terraform.
This is a S3 bucket we use for storing our Terraform state file.
The reason why we keep our terraform.tfstat file on the cloud, i.e. the S3 bucket, is because state is a necessary requirement for Terraform to function and thus we must make sure that it is stored in a centralised repo which cannot be easily deleted. Doing this also good for everyone in the team because they will be working with the same state so that operations will be applied to the same remote objects.
Finally, we have a provider block which declares cloud environment or provider to be created with Terraform, as shown below. Here, we will be creating our resources on AWS Singapore region.
provider "aws" {
  region = "ap-southeast-1"
}
Module 1: VPC
Firstly, in Terraform, we will have a VPC module created with resources listed below.
The resource_prefix is a string to make sure all the resources created with the Terraform getting the same prefix. If your organisation has different naming rules, then feel free to change the format accordingly.
1.2 Subnets
The public subnet for the bastion server is defined as follows. The private IP of the bastion server will be in the format of 10.2.10.X. We also set the map_public_ip_on_launch to true so that instances launched into the subnet should be assigned a public IP address.
The aws_availability_zones data source is part of the AWS provider and retrieves a list of availability zones based on the arguments supplied. Here, we make the public subnet and private subnet to be in the same first availability zones.
1.3 Internet Gateway
Normally, if we create an internet gateway via AWS console, for example, we will sometimes forget to associate it with the VPC. With Terraform, we can do the association in the code and thus reduce the chance of setting up the internet gateway wrongly.
If you have noticed, in the NAT gateway definition above, we have assigned a public IP to it using EIP. Since Terraform is declarative, the ordering of blocks is generally not significant. So we can define the EIP after the NAT gateway.
Once we have the key pair, we can finally move on to define how the bastion and admin servers can be created. We can define a module for the servers as follows.
The output.tf of EC2 instance module is defined as follows.
output "instance_public_ip" {
  description = "Public IP address of the EC2 instance."
  value       = aws_instance.linux_server.public_ip
}

output "instance_private_ip" {
  description = "Private IP address of the EC2 instance in the VPC."
  value       = aws_instance.linux_server.private_ip
}
With this definition, once the Terraform workflow is completed, the public IP of our bastion server and the private IP of our admin server will be displayed. We can then easily use these two IPs to connect to the servers.
Main Configuration
With all the above modules, we can finally define our AWS infrastructure using the following main.tf.
Here, we will pre-install the AWS Command Line Interface (AWS CLI) in the admin server. Hence, we have the following script in the admin_server_init.sh file. The script will be run when the admin server is launched.
Thus, I made the change accordingly with expression references. In the change, I forced the description of security group which the admin server depends on to use the the private route table association ID returned from the VPC module. Doing so will make sure that the admin server is created only after the private route table is setup properly.
With expression references, we force the admin server to be created at a later time, as compared to the bastion server.
If we don’t force the admin_server to be created after the private route table is completed, the script may fail and we can find the error logs at /var/log/cloud-init-output.log on the admin server. In addition, please remember that even though terraform apply runs just fine without any error, it does not mean user_data script is run successfully without any error as well. This is because Terraform knows nothing about the status of user_data script.
We can find the error in the log file cloud-init-output.log in the admin server.
Demo
With the Terraform files ready, now we can move on to go through the Terraform workflow using the commands.
Before we begin, besides installing Terraform, since we will deploy the infrastructure on AWS, we also shall configure the AWS CLI using the following command on the machine where we will run the Terraform commands.
aws configure
Once it is done then only we can move on to the following steps.
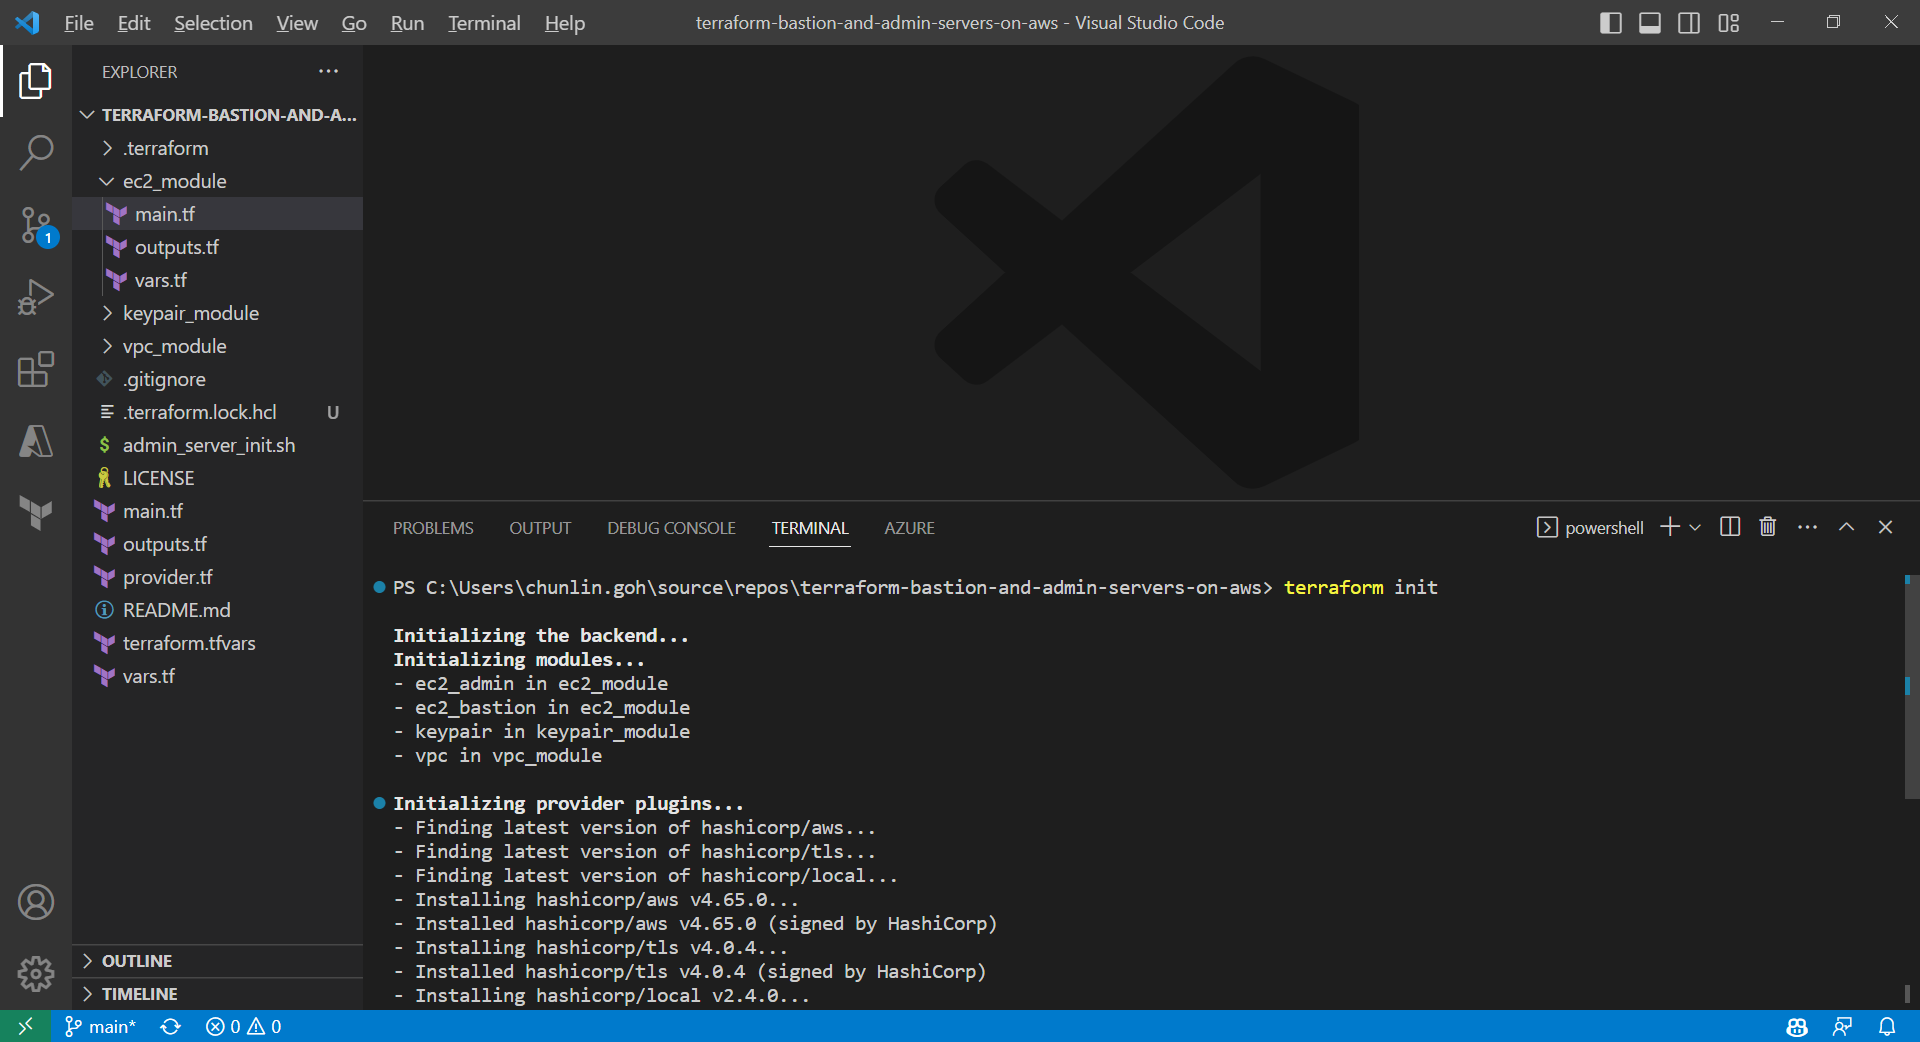
Firstly, we need to download plug-in necessary for the defined provider, backend, etc.
Initialising Terraform with the command terraform init.
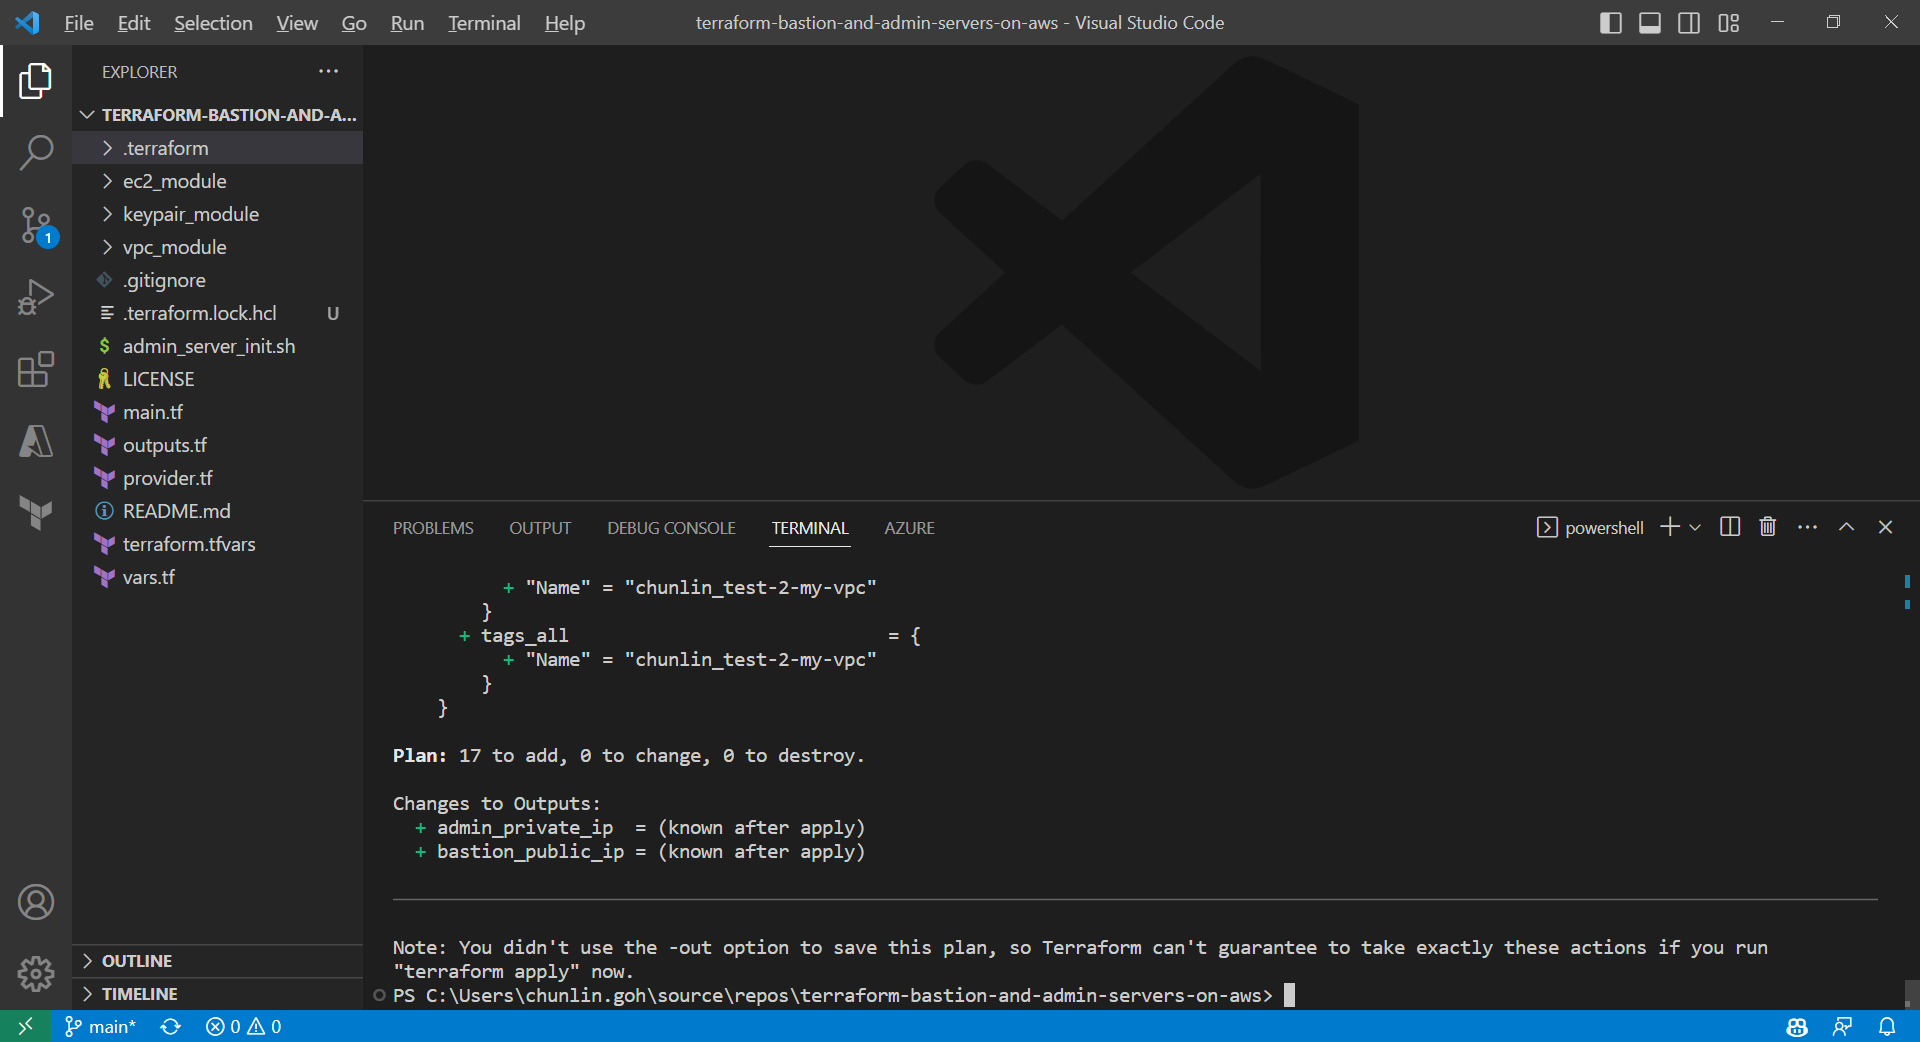
Only after initialisation is completed, we can execute other commands, like terraform plan.
Result of executing the command terraform plan.
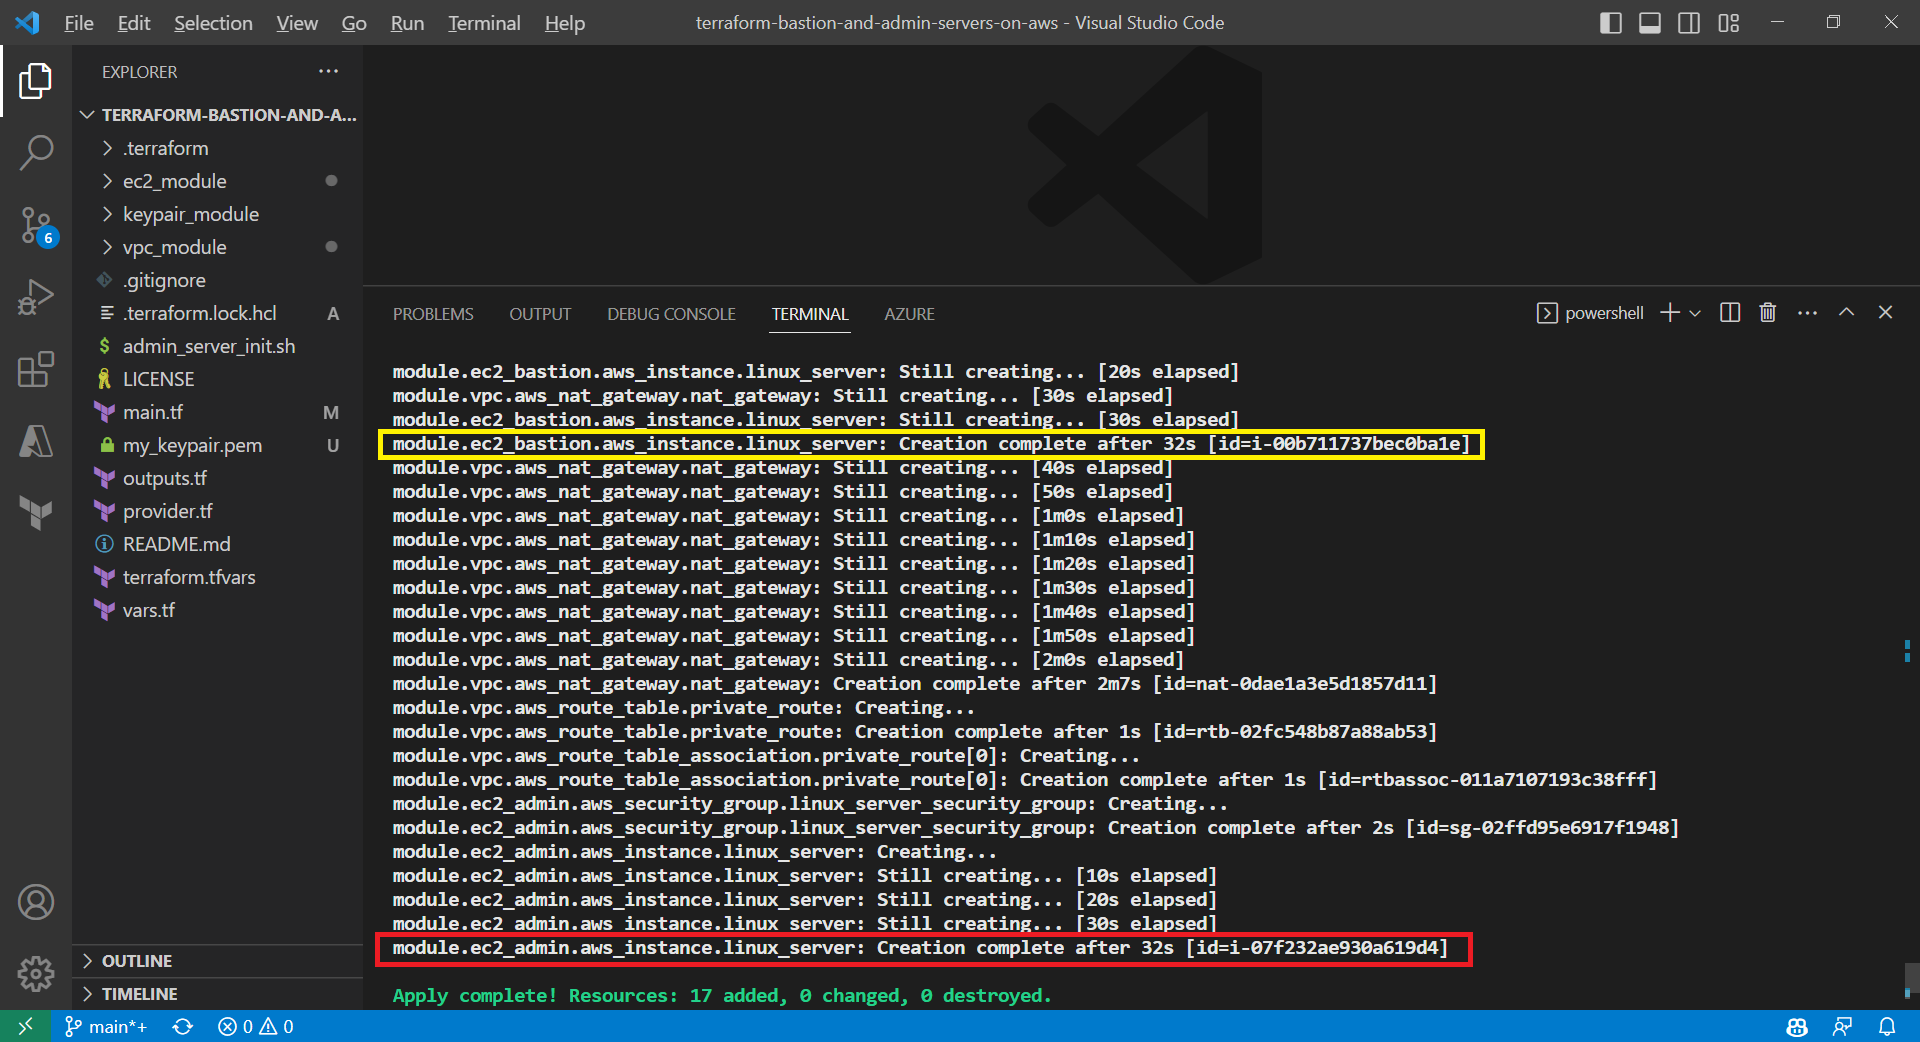
After running the command terraform plan, as shown in the screenshot above, we know that there are in total 17 resources to be added and two outputs, i.e. the two IPs of the two servers, will be generated.
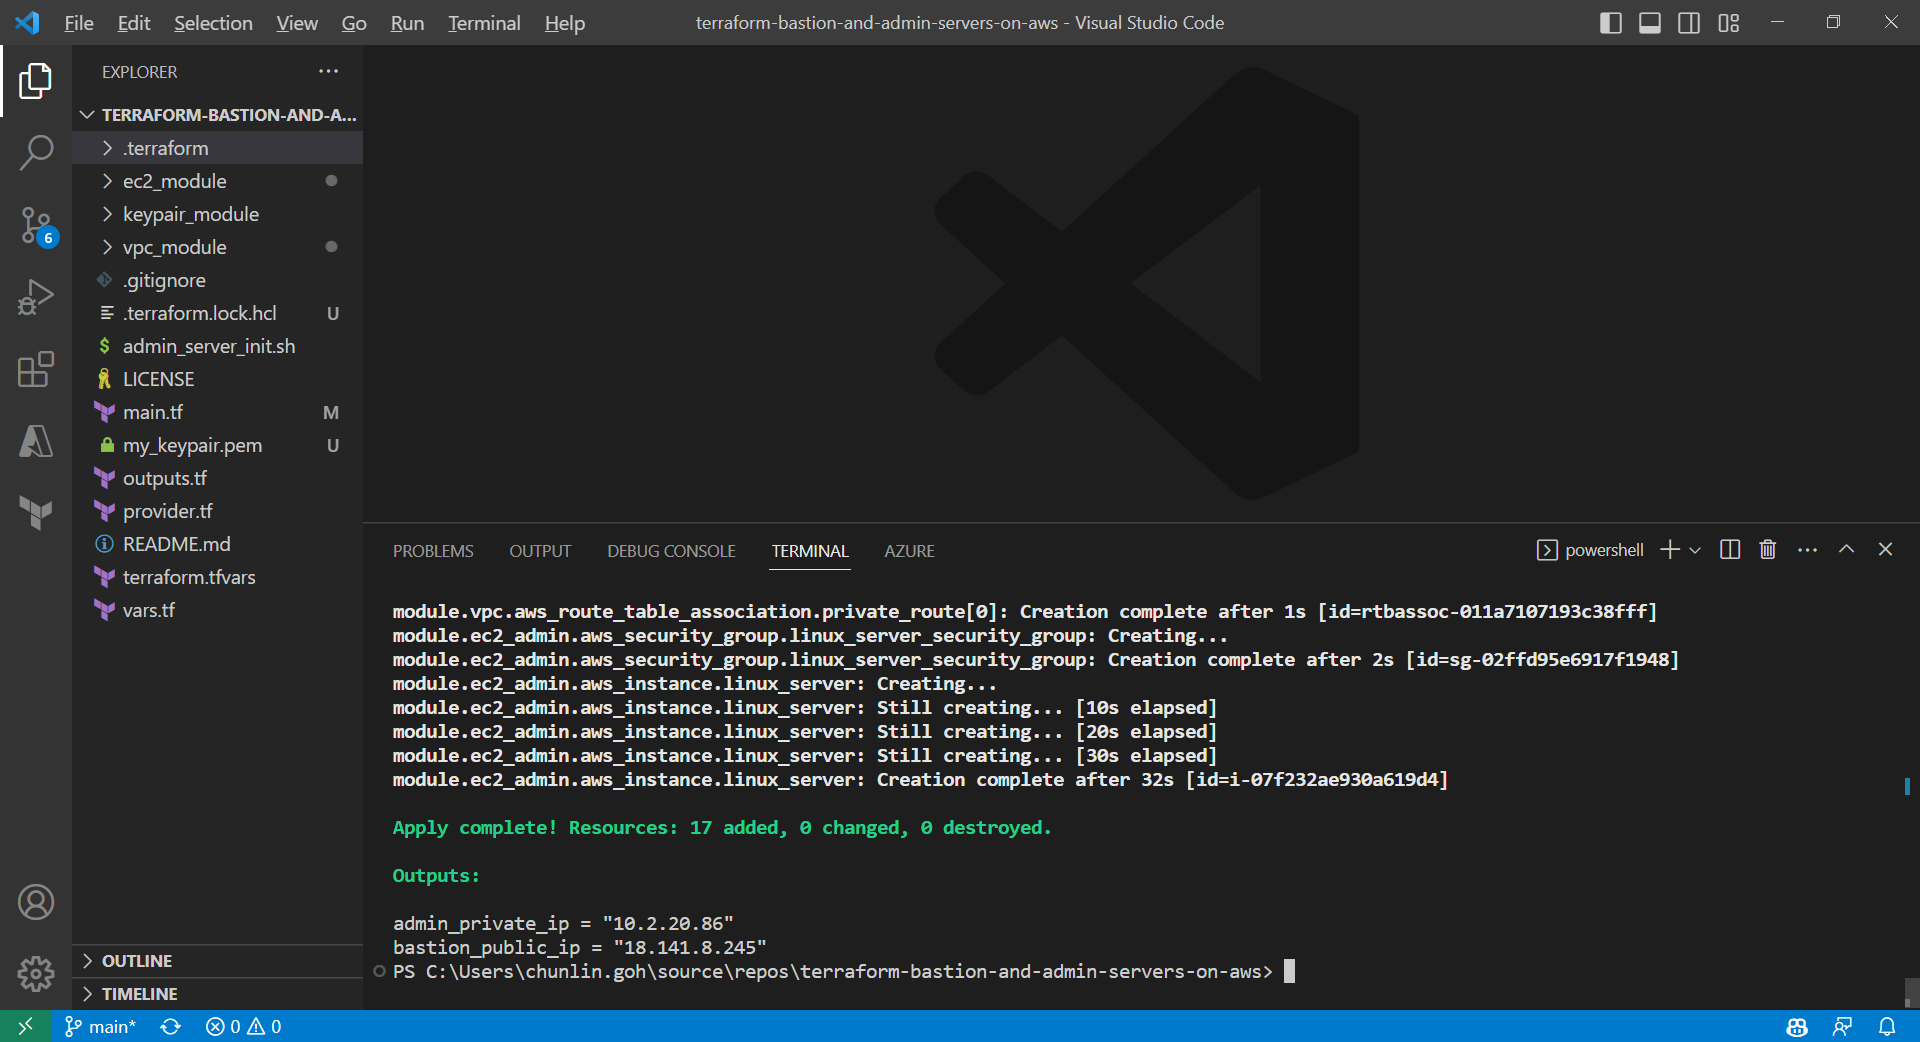
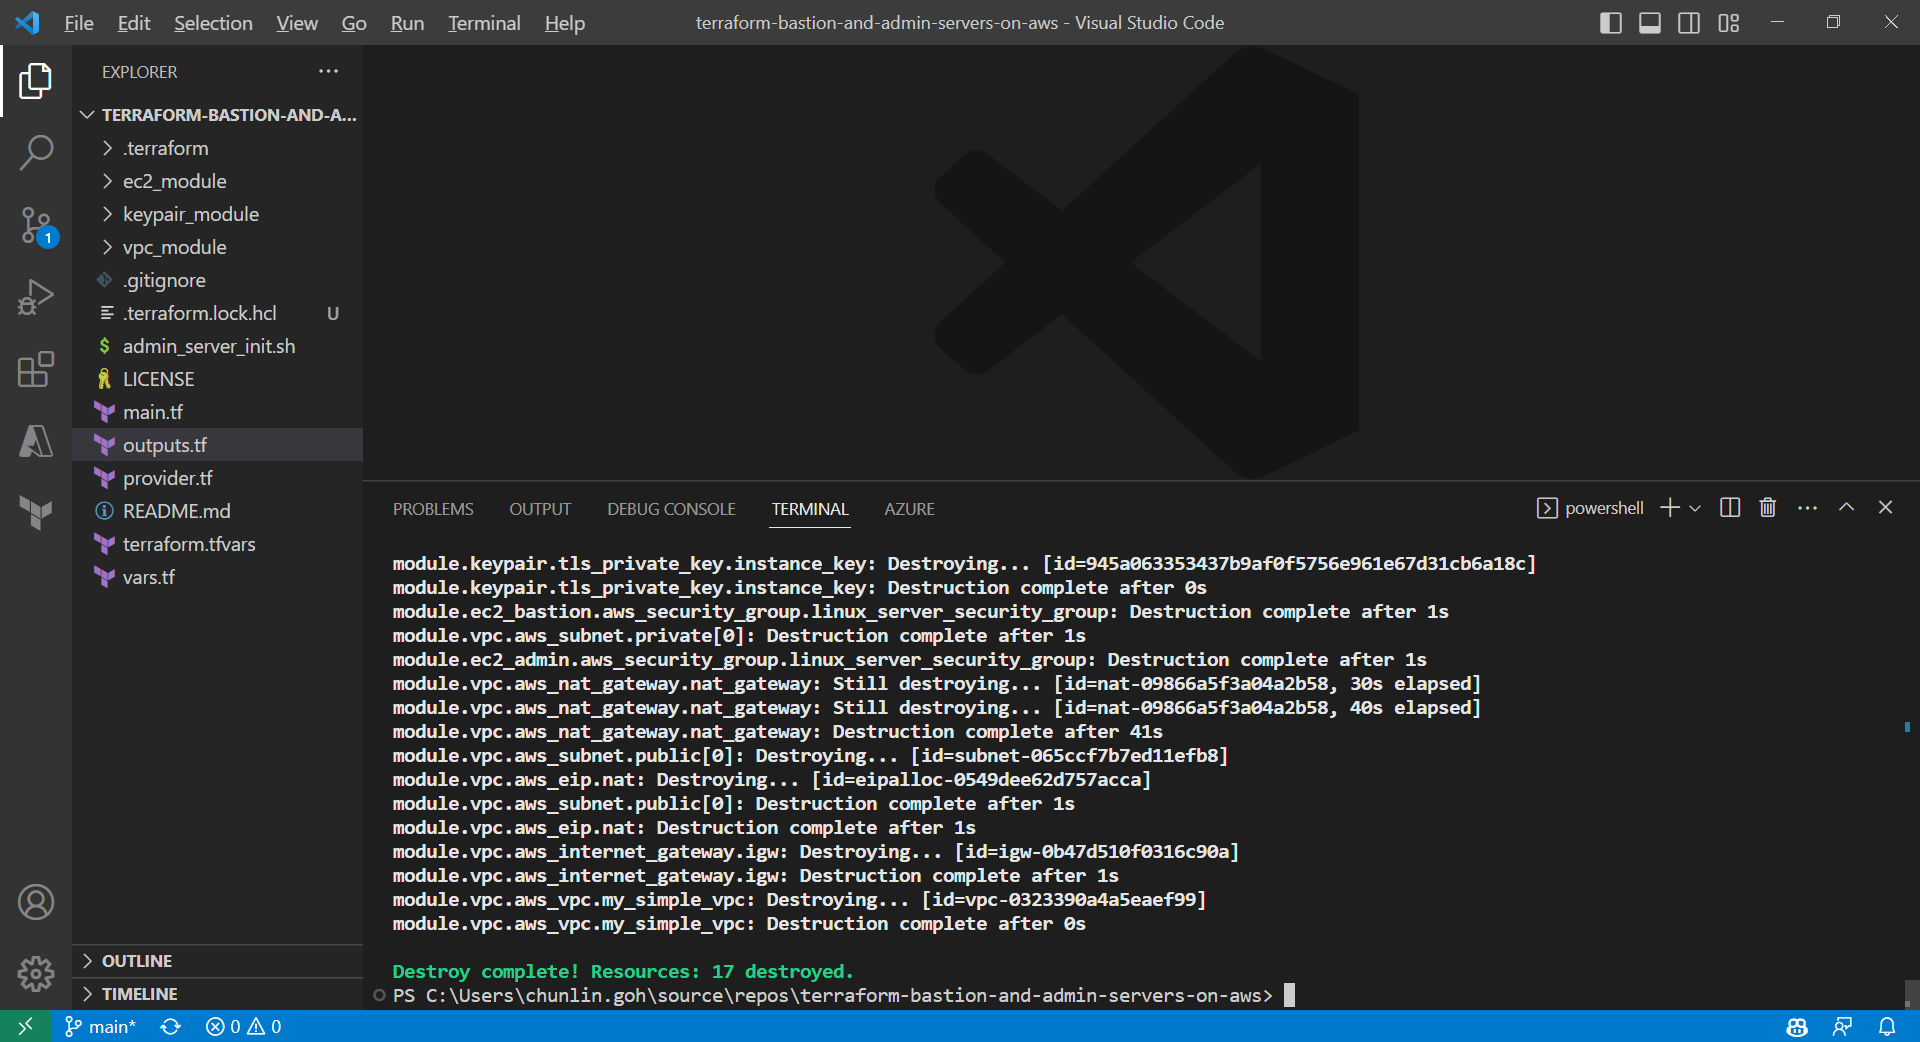
Apply is successfully completed. All 17 resources added to AWS.
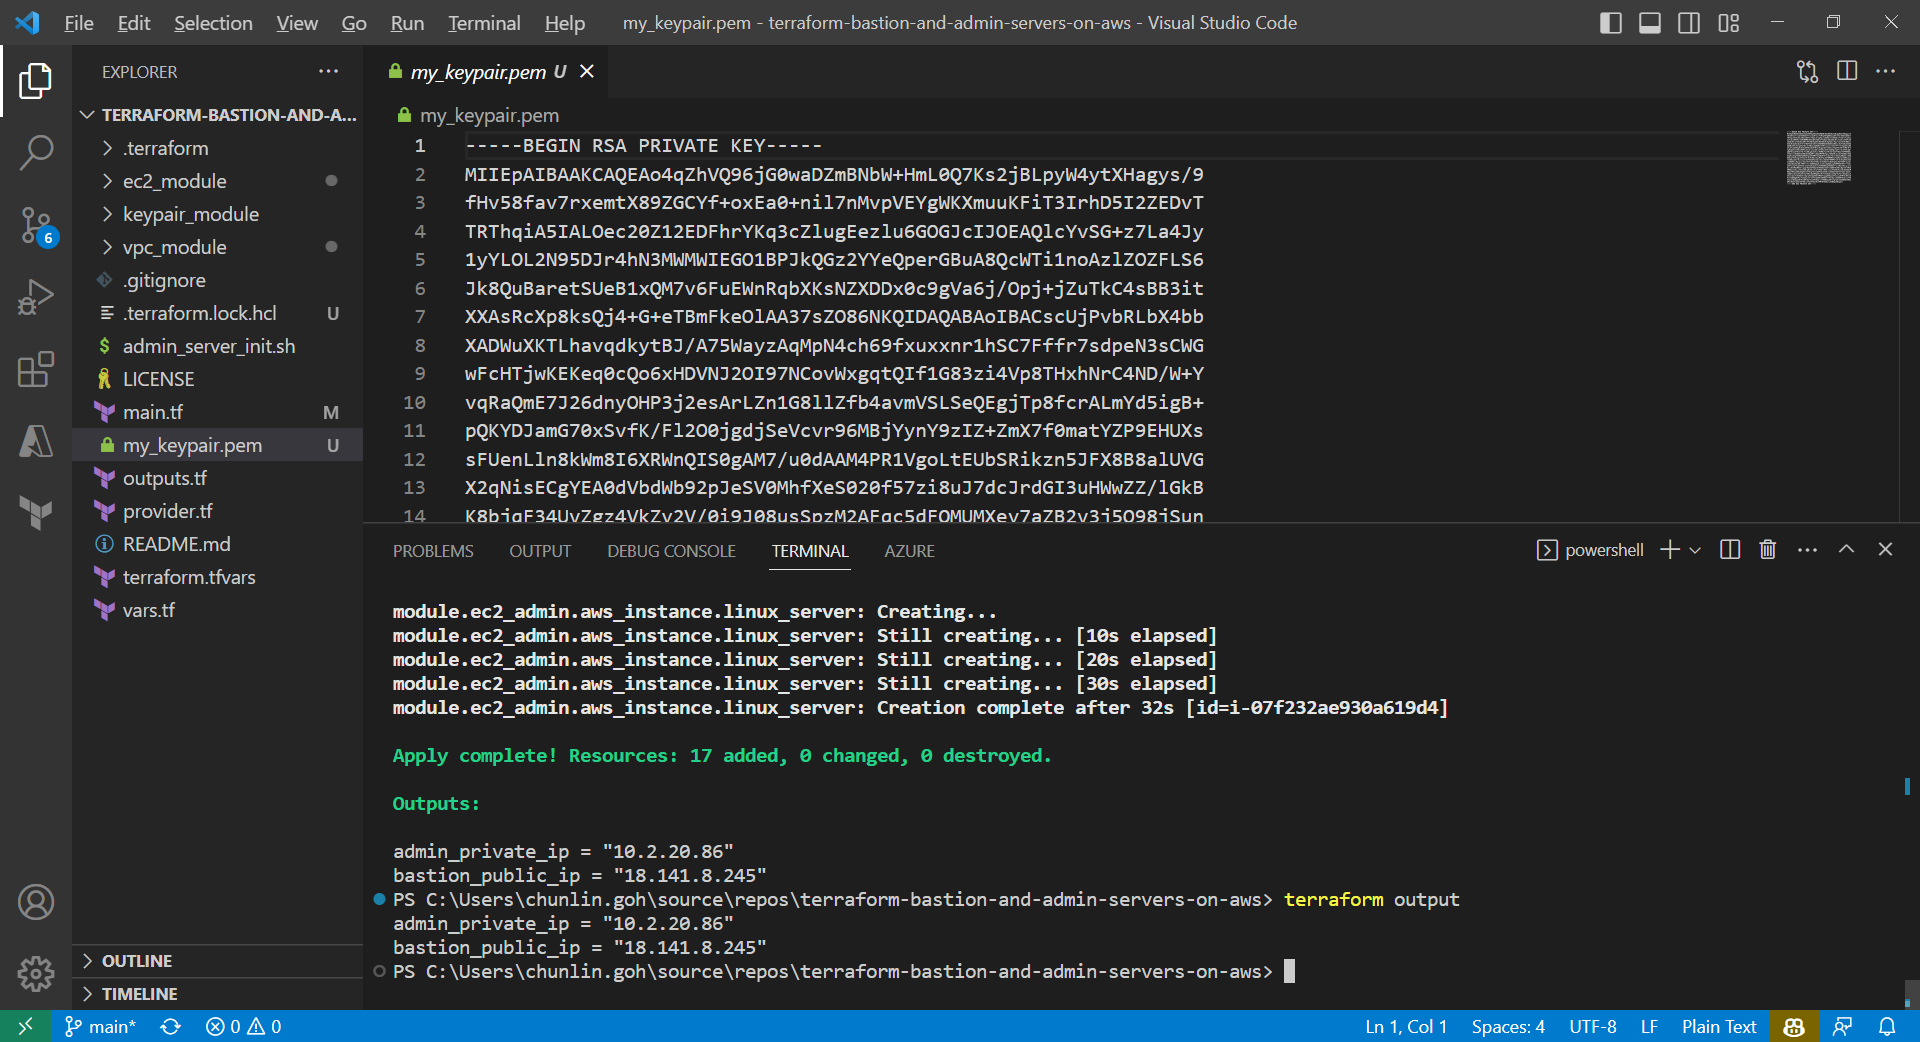
We can also run the command terraform output to get the two IPs. Meanwhile, we can also find the my_keypair.pem file which is generated by the tls_private_key we defined earlier.
The PEM file is generated by Terraform.
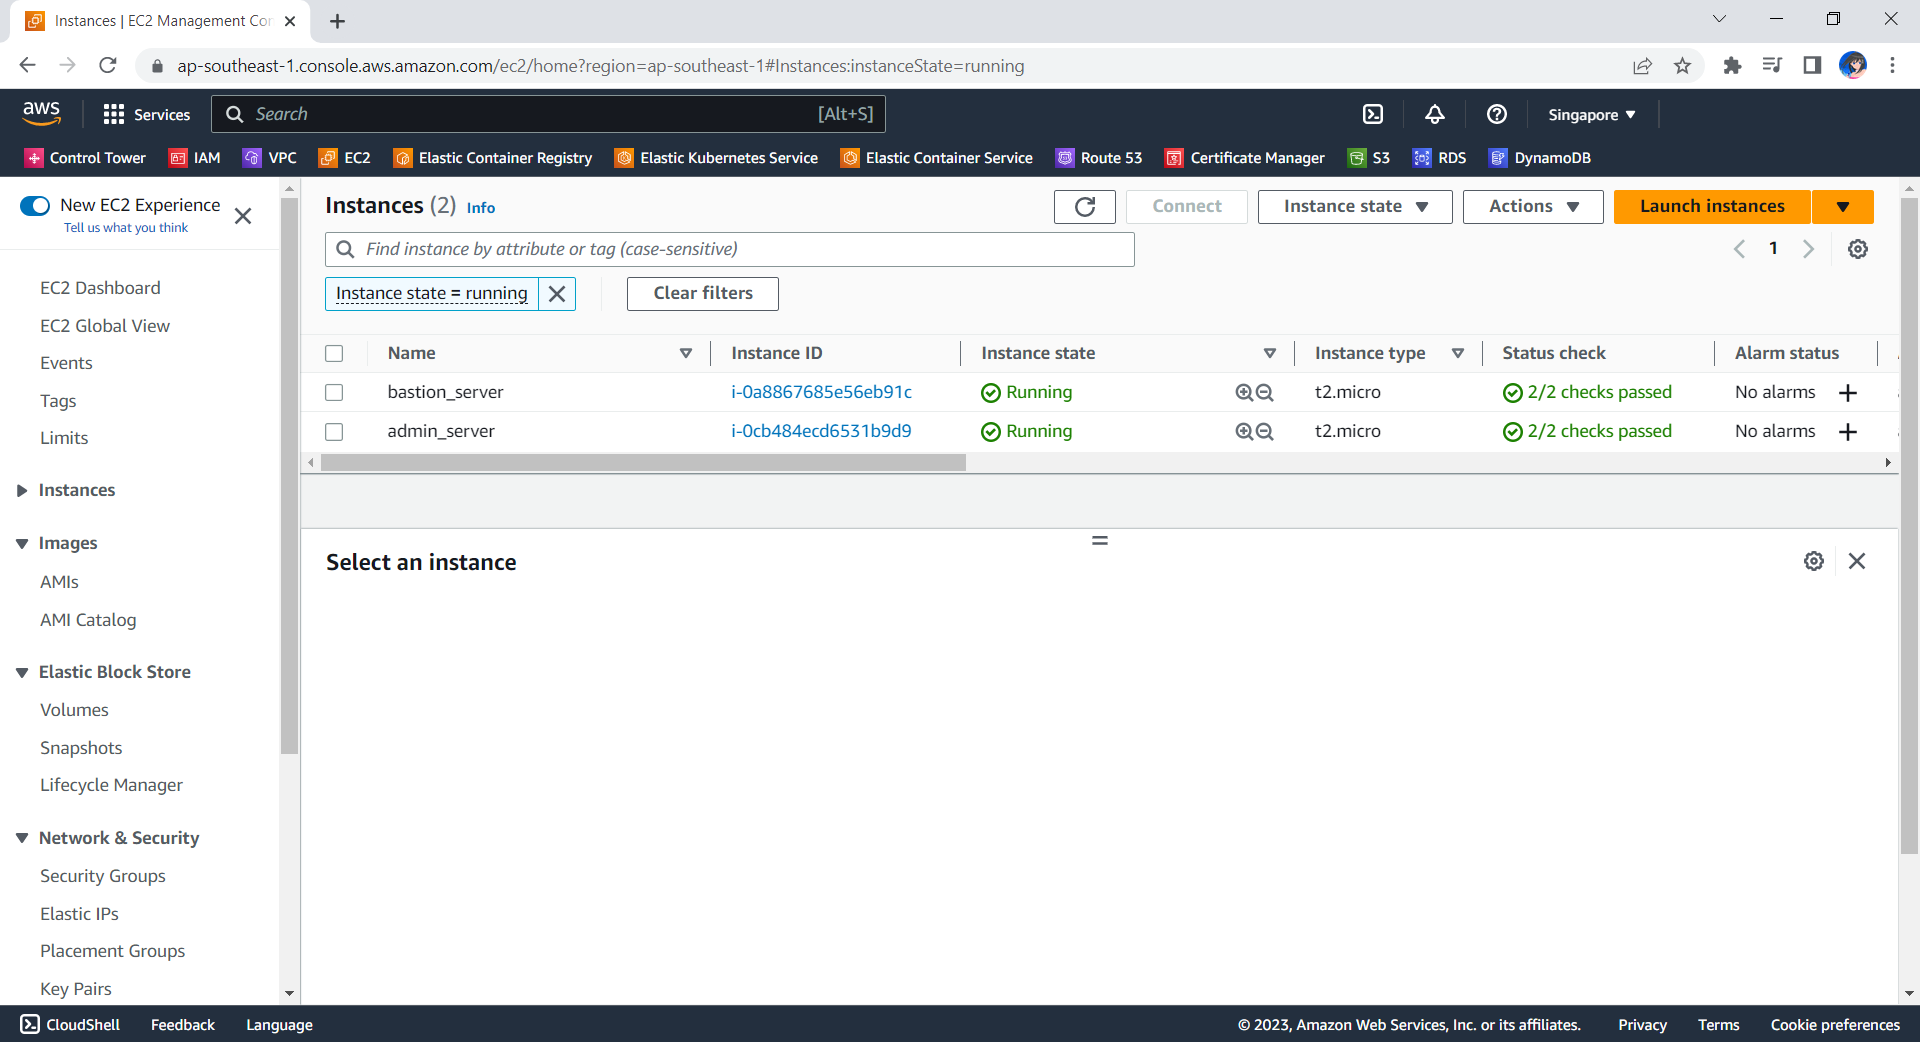
Now, if we check the resources, such as the two EC2 instances, on AWS Console, we should see they are all there up and running.
The bastion server and admin server are created automatically with Terraform.
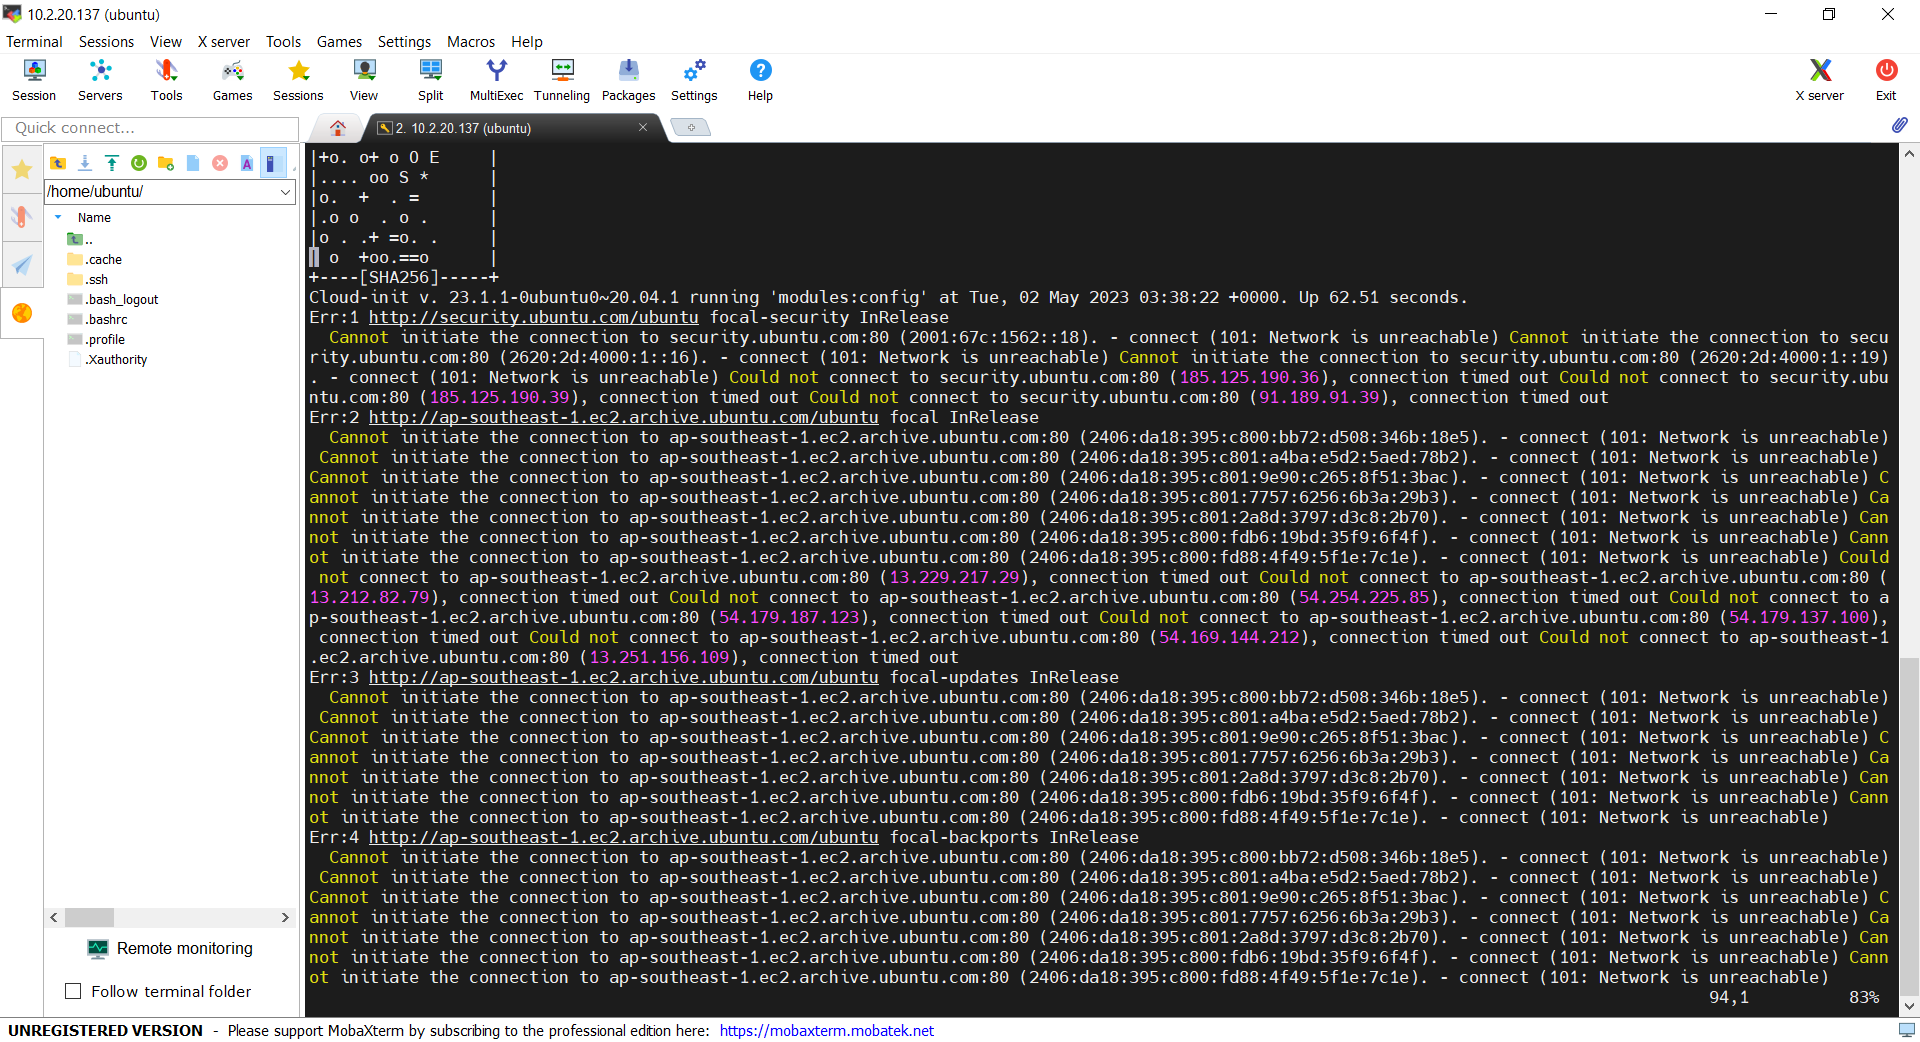
Now, let’s see if we can access the admin server via the bastion server using the private key. In fact, there is no problem to access and we can also realise that the AWS CLI is already installed properly, as shown in the screenshot below.
With the success of user_data script, we can use AWS CLI on the admin server.
Deleting the Cloud Resources
To delete what we have just setup using the Terraform code, we simply run the command terraform destroy. The complete deletion of the cloud resources is done within 3 minutes. This is definitely way more efficient than doing it manually on AWS Console.
All the 17 resources have been deleted successfully and the private key file is deleted too.
Conclusion
That is all for what I had researched on with my friend.
The high concentration of talented individuals in Samsung SDS is remarkable. I have worked alongside amazing colleagues who are not only friendly but also intelligent and dedicated to their work.
Before attempting the CKAD exam, I received advice on how demanding and challenging the assessment could be. Self-learning can also be daunting, particularly in a stressful work environment. However, I seized the opportunity to embark on my journey towards getting certified and committed myself to the process of kaizen, continuous improvement. It was a journey that required a lot of effort and dedication, but it was worth it.
I took the CKAD certification exam while I was working in Seoul in March 2023. The lovely weather has a soothing impact on my stress levels.
August 2022: Learning Docker Fundamentals
To embark on a successful Kubernetes learning journey, I acknowledge the significance of first mastering the fundamentals of Docker.
Docker is a tool that helps developers build, package, and run applications in a consistent way across different environments. Docker allows us to package our app and its dependencies into a Docker container, and then run it on any computer that has Docker installed.
Docker serves as the foundation for many container-based technologies, including Kubernetes. Hence, understanding Docker fundamentals provides a solid groundwork for comprehending Kubernetes.
I borrowed the free Pluralsight account from my friend, Marvin Heng.
The learning path helps me gain essential knowledge and skills that are directly applicable to Kubernetes. For example, it shows me how the best practices of optimising Docker images by carefully placing the Docker instructions and making use of its caching mechanism.
In the learning path, we learnt about Docker Swarm. Docker Swarm is a tool that helps us manage and orchestrate multiple Docker containers across multiple machines or servers, making it easier to deploy and scale our apps.
A simple architecture diagram of a system using Kubernetes. (Source: Pluralsight)
After getting the basic understanding of Docker Swarm, we move on to learning Kubernetes. Kubernetes is similar to Docker Swarm because they are both tools for managing and orchestrating containerised apps. However, Kubernetes has a larger and more mature ecosystem, with more third-party tools and plugins available for tasks like monitoring, logging, and service discovery.
The Linux Foundation provides a neutral and collaborative environment for open-source projects like Kubernetes to thrive, and the CNCF is able to leverage this environment to build a strong community of contributors and users around Kubernetes.
In addition, the Linux Foundation offers a variety of certification exams that allow individuals to demonstrate their knowledge and skills in various areas of open-source technology. CKAD is one of them.
The CKAD exam costs USD 395.00.
The Linux Foundation also offers Kubernetes-related training courses.
The CKAD course is self-paced and can be completed online, making it accessible to learners around the world. It is designed for developers who have some experience with Kubernetes and want to deepen their knowledge and skills in preparation for the CKAD certification exam.
The CKAD course includes a combination of lectures, hands-on exercises, and quizzes to reinforce the concepts covered. It covers a wide range of topics related to Kubernetes, including:
Kubernetes architecture;
Build and design;
Deployment configuration;
App exposing;
App troubleshooting;
Security in Kubernetes;
Helm.
Kubectl, the command-line client used to interact with Kubernetes clusters. (Image Credit: The Linux Foundation Training)
January 2023: Going through CKAD Exercises and Killer Shell
Following approximately one month of dedicated effort, I successfully completed the online course and proudly received my course completion certificate on 7th of January 2023. So, throughout the remainder of January, I directed my attention towards exam preparation by diligently working through the various online exercises.
The exercise comprises numerous questions, therefore, my suggestion would be to devote one week to thoroughly delve into them, by allocating an hour each day to tackle a subset of the questions.
During my 10-day Chinese New Year holiday, I dedicated my time towards preparing for the exam. (Image Credit: Global Times)
Furthermore, upon purchasing the CKAD exam, we are entitled to receive two complementary simulator sessions for the exam on Killer Shell (killer.sh), both containing the same set of questions. Therefore, it is advisable to strategise and plan our approach towards making optimal utilisation of them.
After going through all the questions in the CKAD exercise mentioned above, I proceeded to undertake the initial killer.sh exam. The simulator features an interface that closely resembles the new remote desktop Exam UI, thereby providing me with invaluable insights on how the actual exam will be conducted.
The killer.sh session is allocated a total of 2 hours for the exam, encompassing a set of 22 questions. Similar to the actual exam, the session is to test our hands-on experience and practical knowledge of Kubernetes. Thus, we are expected to demonstrate our proficiency by completing a series of tasks in a given Kubernetes environment.
The simulator questions are comparatively more challenging than the actual exam. In my initial session, I was able to score only 50% out of 100%. Upon analysing and rectifying my errors, I resolved to invest an additional month’s time to study and prepare more comprehensively.
Scenario-based questions like this are expected in the CKAD exam.
February 2023: Working on Cloud Migration Project
Upon my return from the Chinese New Year holiday, to my dismay, I discovered that I had been assigned to a cloud migration project at work.
The project presented me with an exceptional chance to deploy an ASP .NET solution on Kubernetes on Google Cloud Platform, allowing me to put into practice what I have learned and thereby fortify my knowledge of Kubernetes-related topics.
Furthermore, I am lucky to have had the opportunity to engage in a fruitful discussion with my fellow colleagues, through which I was able to learn more from them about Kubernetes by presenting my work.
March 2023: The Exam
In the early of March, I was assigned to visit Samsung SDS in Seoul until the end of the month. Therefore, I decided to seize the opportunity to complete my second kill.sh simulation session. This time, I managed to score more than the passing score, which is 66%.
After that, I dedicated an extra week to reviewing the questions in the CKAD exercises on GitHub before proceeding to take the actual CKAD exam.
The actual CKAD exam consists of 16 questions that need to be completed within 2 hours. Even though the exam is online and open book, we are not allowed to refer any resources other than the Kubernetes documentation and the Helm documentaion during the exam.
In addition, the exam has been updated to use the PSI Bridge where we get access to a remote desktop instead of just a remote terminal. There is an an article about it. This should not be unfamiliar to you if you have gone through the killer.sh exams.
The new exam UI now provides us access to a full remote XFCE desktop, enabling us to run the terminal application and Firefox to open the approved online documentations, unlike the previous exam UI. Thus, having multiple monitors and bookmarking the documentation pages on our personal Internet browser before the exam are no longer helpful.
Even though I am 30-minute early to the exam, I faced a technical issue with Chrome on my laptop that caused me to be 5 minutes late for the online exam. Fortunately, my exam time was not reduced due to the delay.
The issue was related to the need to end the “remoting_host.exe” application used by Chrome Remote Desktop in order to use a specific browser for the exam. Despite trying to locate it in task manager, I was unable to do so. After searching on Google, I found a solution for Windows users. We need to execute the command “net stop chromoting” to the “remoting_host.exe”.
During my stay in Seoul, my room at Shilla Stay Seocho served as my exam location.
CKAD certification exam is an online proctored exam. This means that it can be taken remotely but monitored by a proctor via webcam and microphone to ensure the integrity of the exam. Hence, to ensure a smooth online proctored exam experience, it is crucial to verify that our webcam is capable of capturing the text on our ID, such as our passport, and that we are using a stable, high-speed Internet connection.
During the exam, the first thing I did is to create a few aliases as listed below.
alias k="kubectl "
alias kn="kubectl config set-context --current --namespace"
export dry="--dry-run=client -o yaml"
export now="--force --grace-period 0"
These aliases helped me to complete the commands quickier. In addition, if it’s possible, I also always use an imperative command to create a YAML file using kubectl.
By working on the solution based on the generated YAML file, I am able to save a significant amount of time as opposed to writing the entire YAML file from scratch.
I completed only 15 questions with 1 not answered. I chose to forgo a 9-mark question that I was not confident in answering correctly, in order to have more time to focus on other questions. In the end, I still managed to score 78% out of 100%.
The passing score for CKAD is 66% out of 100%.
Moving Forward: Beyond the Certification
In conclusion, obtaining certification in one’s chosen field can be a valuable asset for personal and professional development. In my experience, it has helped me feel more confident in my abilities and given me a sense of purpose in my career.
However, it is essential to remember that it is crucial to continue learning and growing, both through practical experience and ongoing education, in order to stay up-to-date with the latest developments in the field. The combination of certification, practical experience, and ongoing learning can help us to achieve our career goals and excel in our role as a software engineer.