Here is a just a few items that I learnt on how to protect and secure my web applications in recent ASP .NET projects.
reCAPTCHA in Razor
CAPTCHA is an acronym for “Completely Automated Public Turing test to tell Computers and Humans Apart”.
CAPTCHA is a program to find out if the current user is whether a human or a robot by asking the user to do some challenge-response tests. This feature is important in some websites to prevent machine to, for example, auto login to the websites, to do online transactions, to register as members, and so on. Luckily, it’s now very easy to include CAPTCHA in our ASP .NET MVC web applications.
reCAPTCHA is a free Google CAPTCHA service that comes in the form of widget that can be added to websites easily. So, how do we implement reCAPTCHA in our ASP .NET MVC sites?
The library that I use is called ReCaptcha for MVC5, which can be downloaded from Codeplex. With the help of it, I am able to easily plugin reCAPTCHA in my MVC5 web applications.
After adding ReCaptcha.Mvc5.dll in my project, I will need to import its namespace to the Razor view of the page which needs to have reCAPTCHA widget.
@using ReCaptcha.Mvc5;
To render the reCAPTCHA widget in, for example, a form, we will do the following.
< div class="form-group">
    @Html.LabelFor(model => model.recaptcha_response_field, new { @class = "control-label col-md-2" })
    < div class="col-md-10">
        <!--Render the recaptcha-->
        @Html.reCAPTCHA("<public key here>")
    < /div>
 < /div>
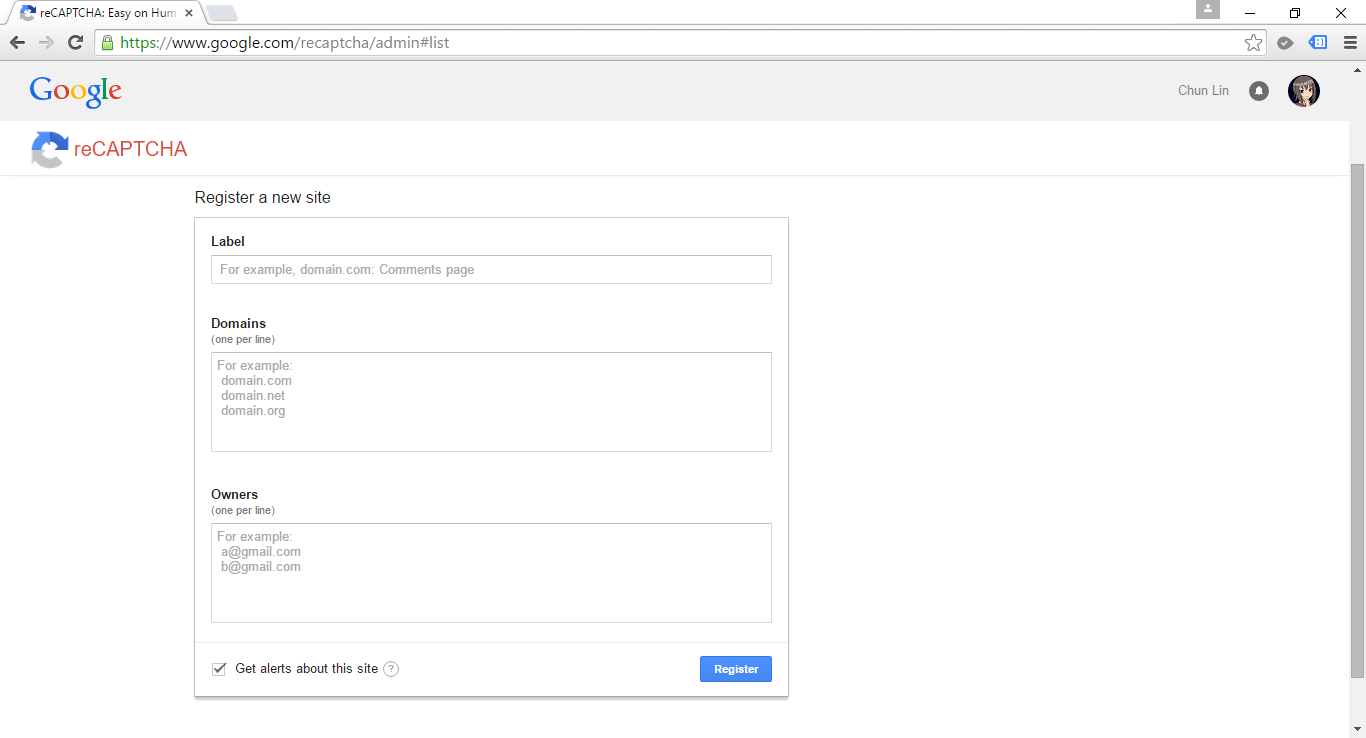
The public key can be retrieved from the official reCAPTCHA page after you register your website there.
In the code above, there is a field called recaptcha_response_field, which will be added in our model class as demonstrated below.
public class RegistrationViewModel : ReCaptchaViewModel
{
...
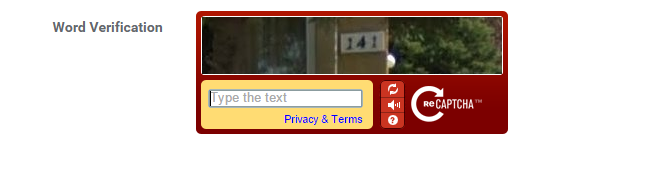
[Display(Name = "Word Verification")]
public override string recaptcha_response_field { get; set; }
}
To do verification in the controller, we will have the following code to help us.
[HttpPost]
[ValidateAntiForgeryToken]
public async Task<ActionResult> Register(RegistrationViewModel registrationVM)
{
    ...

    if (!string.IsNullOrEmpty(checkoutVM.recaptcha_response_field))
    {
        // Verify the recaptcha response.
        ReCaptchaResponse response =
            await this.verifyReCAPTCHA(registrationVM, "<private key here>", true);

        if (response.Success)
        {
            // Yay, the user is human!
        }
        else
        {
            ModelState.AddModelError("", "Please enter correct verification word.");
        }
    }
}
The private key can also be found in the official reCAPTCHA page after you have submitted your website.
After doing all these, you are now be able to have a working reCAPTCHA widget in your website.
XSRF: Cross-Site Request Forgery
In the controller code above, there is one attribute called ValidateAntiForgeryToken. The purpose of this attribute is to prevent XSRF by adding anti-forgery tokens in both a hidden form field and the cookies to the server.
I draw a graph for me to better explain about what XSRF is.
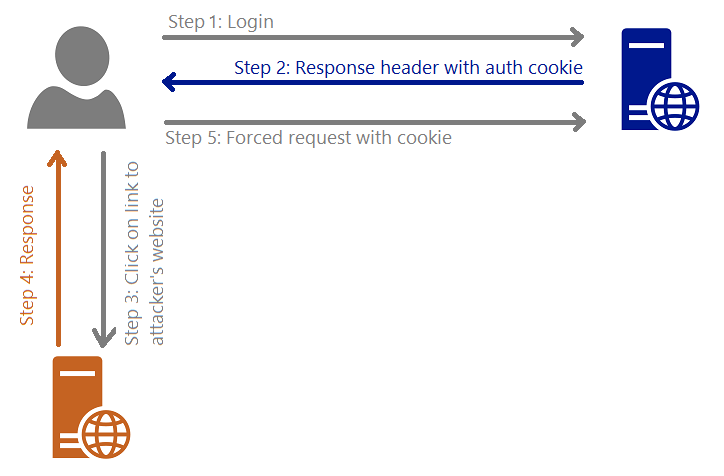
Steps are as follows.
- The user logs in to, for example, a bank website.
- The response header from the bank site will contain the user’s authentication cookie. Since authentication cookie is a session cookie, it will only be cleared when the process ends. Thus, until that time, the browser will always include the cookie with each request to the same bank website.
- The attacker sends to the user a link and somehow encourage the user to click on it. This causes sending a request to the attacker’s server.
- The attacker website has the following form.
<body onload="document.getElementById('attack-form').submit()"> <form id="fm1" action="https://bank.com/TransferMoney" method="post"> <input name="transferTo" value="attackerAccount" /> <input name="currency" value="USD" /> <input name="money" value="7,000,000,000" /> </form> </body> - Because of Step 4, the user will be forced to send a request to the bank website to transfer money to attacker’s account with the user’s authentication cookie.
Hence, the attribute ValidateAntiForgeryToken helps to avoid XSRF by checking both the cookie and form have anti-forgery tokens and their values match.
Mass-Assignment Vulnerability and Over-Posting Attack
Few years ago, Github was found to have Mass-Assignment Vulnerability. The vulnerability allows people to perform Over-Posting Attack to the site so that the attackers can modify data items which are not normally allowed to access. Due to the fact that ASP .NET MVC web application is using Model Binding, the same vulnerability can happen in ASP .NET MVC environment as well.

There are two my personal favourite solutions to avoid Over-Posting Attack.
One is using Bind attribute in the controller method. For example, in order to prevent users editing the value of isAdmin when they update their profile, I can do something as follows.
[HttpPost]
public ViewResult Edit([Bind(Exclude = "IsAdmin")] User user)
{
    ...
}
Alternatively, we can also use “Include” to define those fields that should be included in the binding.
Second solution is using view model. For example, the following class will not contain properties such as IsAdmin which are not allowed to be edited in the form post of profile edit.
public class UserProfileUpdateViewModel
{
    public string FirstName { get; set; }
    public string LastName { get; set; }
    ...
}
XSS: Cross-Site Scripting
According to OWASP (Open Web Application Security Project), XSS attacks
…are a type of injection, in which malicious scripts are injected into otherwise benign and trusted web sites… Flaws that allow these attacks are quite widespread and occur anywhere a web application uses input from a user within the output it generates without validating or encoding it.

Currently, by default ASP .NET will throw exception if potentially dangerous content is detected in the request. In addition, the Razor view engine protect us against most of the XSS attacks by encoding data which is displayed to web page via the @ tag.
In View, we also need to encode any user-generated data that we are putting into our JavaScript code. Starting from ASP .NET 4.0, we can call HttpUtility.JavaScriptStringEncode. HttpUtility.JavaScriptStringEncode helps to encode a string so that it is safe to display and characters are escaped in a way that JavaScript can understand.
In order to avoid our database to have malicious markup and script, we need to encode the user inputs in the Controller as well using Server.HtmlEncode.
[AllowHtml]
There are some cases where our web application should accept HTML tags. For example, we have a <textarea> element in our blogging system where user can write the content of post, then we need to skip the default checking of ASP .NET.
To post HTML back to our Model, we can simply add the [AllowHtml] attribute to the corresponding property in the Model, for example
public class BlogPost {
    [Key]
    public int ID { get; set; }
    ...
    [AllowHtml]
    public string Content { get; set; }
}
Then in the View, we will need to use @Html.Raw to tell Razor not to encode the HTML markup.
@Html.Raw(post.Content)
Wait… Won’t this make XSS attack possible in our website? Yup, of course. So, we must be very careful whenever we are trying to bypass the Razor encoding. The solution will then be using AntiXSS encoding library from Microsoft.
AntiXSS uses a safe list approach to encoding. With its help, we will then able to remove any malicious script from the user input in the Controller, as demonstrated below.
[HttpPost]
[ValidateAntiForgeryToken]
public ActionResult CreatePost(BlogPost post)
{
    if (ModelState.IsValid)
    {
        ...
        post.Content = Sanitizer.GetSafeHtmlFragment(post.Content);
        ...
        db.BlogPosts.Add(post);
        db.SaveChanges();
        return RedirectToAction("Index");
    }
    return View(post);
}
ASP .NET Request Validation
Previously in the discussion of XSS, we know that by default ASP .NET throws exception if potentially dangerous content is detected in the request. This is because of the existence of ASP .NET Request Validation.
However, according to OWASP, Request Validation should not be used as our only method of XSS protection because it does not guarantee to catch every type of invalid input.
HttpOnly Cookies
In order to reduce the risk of XSS, popular modern browsers have added a new attribute to cookie called HttpOnly Cookie. This new attribute specifies that a cookie is not accessible through script. Hence, it prevents the sensitive data contained in the cookie can be sent to attacker’s side via malicious JavaScript in XSS attack.
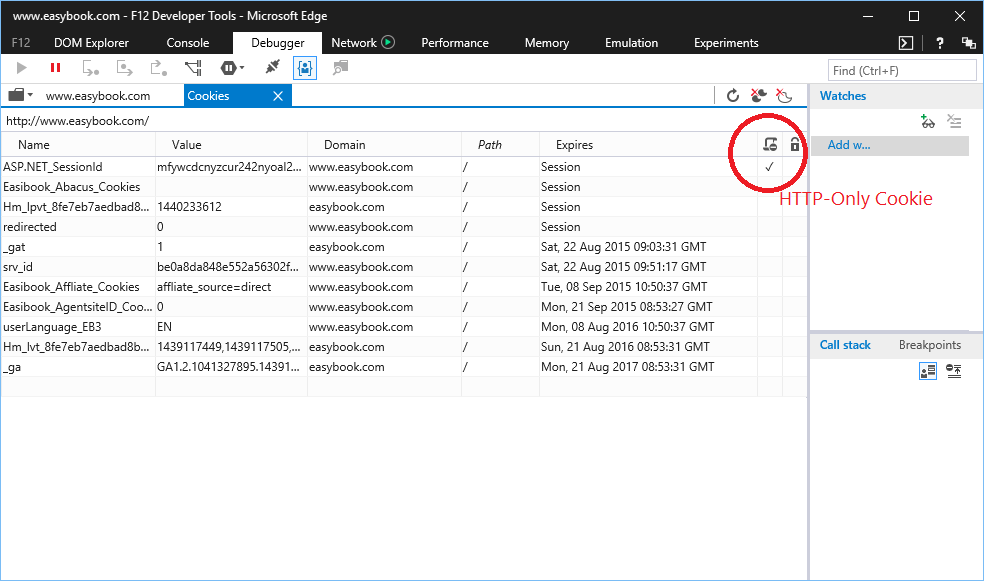
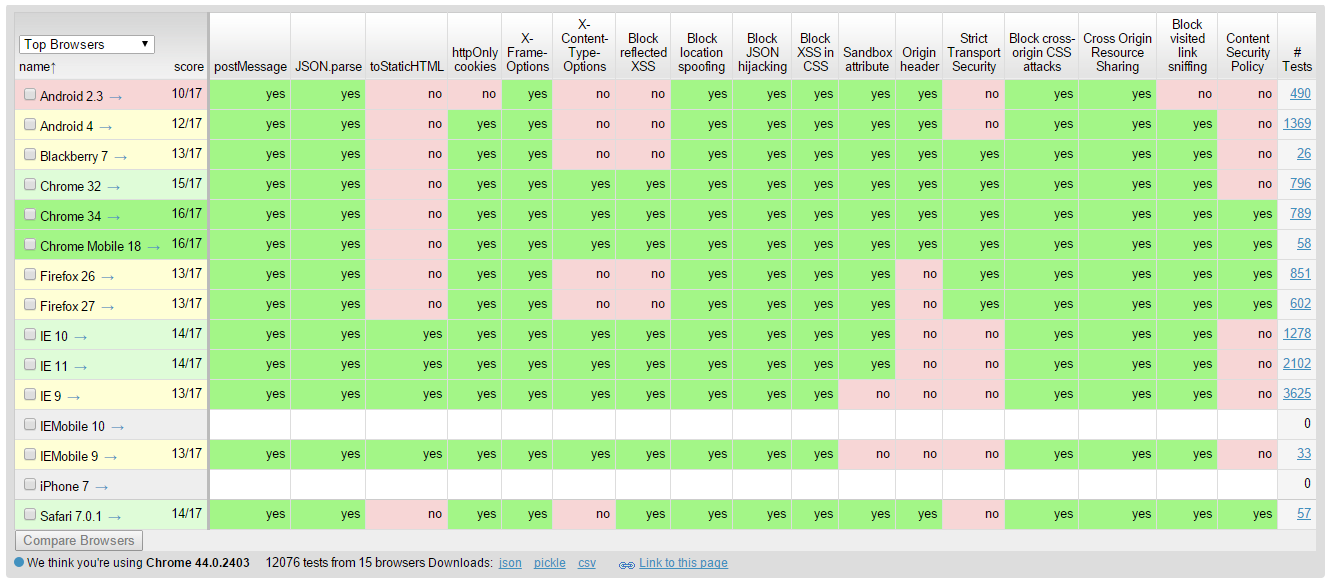
When a cookie is labelled as HttpOnly, it tells the browser that the cookie should only be accessed by the server. It is very easy to check which cookies are HttpOnly in the developer tool of modern browsers.
So, how do we create HttpOnly cookies in ASP .NET web applications? Just add a new line to set HttpOnly attribute of the cookie to true is fine.
HttpCookie myCookie = new HttpCookie("MyHttpOnlyCookie");
myCookie["Message"] = "Hello, world!";
myCookie.Expires = DateTime.Now.AddDays(30);
myCookie.HttpOnly = true;
Response.Cookies.Add(myCookie);
Alternatively, HttpOnly attribute can be set in web.config.
<httpCookies httpOnlyCookies="true" ...>
However, as pointed out in OWASP, if a browser is too old to support HttpOnly cookie, the attribute will be ignored by the browser and thus the cookies will be vulnerable to XSS attack. Also according to MSDN, HttpOnly does not prevent attacker with access to the network channel from accessing the cookie directly, so it recommends the use of SSL in addition of HttpOnly attribute.
HttpOnly Cookie was introduced in 2002 in IE6. Firefox 2.0.0.5 only supported HttpOnly attribute in 2007, 5 years later. However, soon people realized that in Firefox, there was still a bug in the HttpOnly implementation. Firefox allowed attackers to do an XMLHttpRequest to get the cookie values from the HTTP Response headers. 2 years later, in 2009, Mozilla finally fixed the bug. Since then, the XMLHttpRequest can no longer access the Set-Cookie and Set-Cookie2 headers of any response no matter the HttpOnly attribute is set to true or not.
SQL Injection and Entity SQL
When I first learned SQL in university, I always thought escaping user inputs helped to prevent SQL Injection. This approach doesn’t work actually. I just read an article written by Steve Friedl regarding how escaping the input strings does not protect our applications from being attacked by SQL Injection. The following is the example Steve gave.
SELECT fieldlist
FROM table
WHERE id = 23 OR 1=1;  -- Boom! Always matches!
When I was working in the Summer Fellowship Programme, I started to use Parameterized SQL.
SqlConnection conn = new SqlConnection(connectionString);
conn.Open();
string sql = "SELECT fieldlist FROM table WHERE id = @id";
SqlCommand cmd = new SqlCommand(sql);
cmd.Parameters.Add("@id", SqlDbType.Int, id);
SqlDataReader reader = cmd.ExecuteReader();
This approach provides a huge security performance benefits.
In January, I started to learn Entity Framework. In Entity Framework, there are three types of queries:
- Native SQL
- Entity SQL
- LINQ to Entity
In the first two types, there is a risk of allowing SQL Injection if the developers are not careful enough. Hence, it’s recommended to use parameterized queries. In addition, we can also use Query Builder Methods to safely construct Entity SQL, for example
ObjectQuery<Flight> query =
    context.Flights
    .Where("it.FlightCode = @code",
    new ObjectParameter("code", flightCode));
However, if we choose to use LINQ to Entity, which does not compose queries by using string manipulation and concatenation, we will not have the problem of being attacked by traditional SQL Injection.
JsonResult and JSON Hijacking
Using the MVC JsonResult, we are able to make our controller in ASP .NET MVC application to return Json. However, by default, ASP .NET MVC does not allow us to response to an HTTP GET request with a JSON payload (Book: Professional ASP .NET MVC 5). Hence, if we test the controller by just typing the URL directly in the browser, we will receive the following error message.
This request has been blocked because sensitive information could be disclosed to third party web sites when this is used in a GET request. To allow GET requests, set JsonRequestBehavior to AllowGet.
Since the method only accepts POST requests, unless Cross-Origin Resource Sharing (CORS) is implemented, the browser will be able to protect our data from returning the Json result to other domains.
This is actually a feature introduced by ASP .NET MVC team in order to mitigate a security threat known as JSON Hijacking. JSON Hijacking is an attack similar to XSRF where attacker can access cross-domain JSON data which is returned as array literals.
The reason why “returning JSON data as array” is dangerous is that although browsers nowadays stop us from making cross domain HTTP request via JavaScript, we are still able to use a <script> tag to make the browser load a script from another domain.
<script src="https://www.bank.com/Home/AccountBalance/12"></script>
Due to the fact that a JSON array will be treated as a valid JavaScript script and can thus be executed. So, we need to wrap the JSON result in an object, just like what ASP .NET and WCF do. The ASP.NET AJAX library, for example, automatically wraps JSON data with { d: [] } construct to make the returned value to become an invalid JavaScript statement which cannot be executed:
{"d" : ["balance", "$7,000,000,000.00"] }
So, to avoid JSON Hijacking, we need to
- never return JSON array
- not allow HTTP GET request to get the sensitive data
Nowadays, even though JSON Hijacking is no longer a known problem in modern browsers, it is still a concern because “you shouldn’t stop plugging a security hole just because it isn’t likely to be exploited“.
By the way, GMail was successfully exploited via JSON Hijacking. =)
Summer 2015 Self-Learning Project
This article is part of my Self-Learning in this summer. To read the other topics in this project, please click here to visit the project overview page.