Development and DevOps of Desktop Apps with .NET Core 3.0

In September, .NET Core 3.0 was announced in the official .NET Conf 2019. Happily, I’m invited to be speaker in .NET Conf Singapore happening in BLOCK71. I am one the organisers of the event, so theoretically speaking, I invited myself.

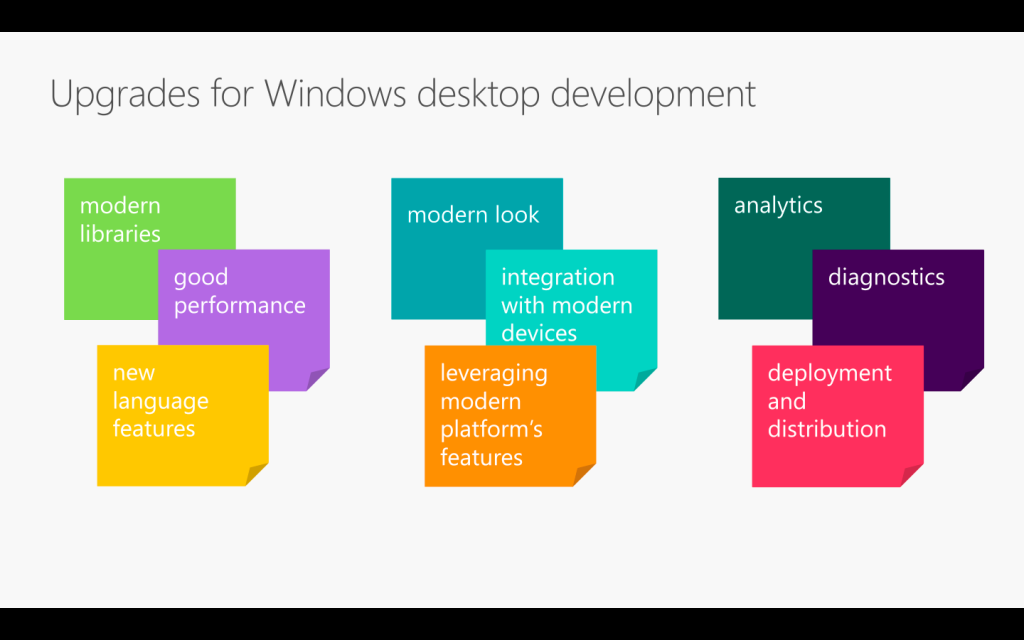
The topic that I delivered in the event is “Development and DevOps of Desktop Apps with .NET Core 3.0”. It is a 45-minute talk combining the content from the following three talks.

From coding, converting, to deploying. (Image Credit: .NET Conf 2019)

If you watch the videos above, the total length is about 70 minutes. So covering three of them in a 45-minute talk is a challenge to me. Luckily, I have Sabrina to help me out by co-speaking with me.

If you have missed our session, don’t worry, I have uploaded the recordings of the .NET Conf Singapore 2019 to the YouTube: https://www.youtube.com/watch?v=5VX-bAcBOWw&list=PLJEtXrSgWKZqkaYgY3PxBjRbA8O2vKEL7

If you have watched our session, you will realise it’s quite different from the official .NET Conf. In this post, I am going to brief you through about my thoughts and development process of our talk content.

Let’s Hashtag Together!

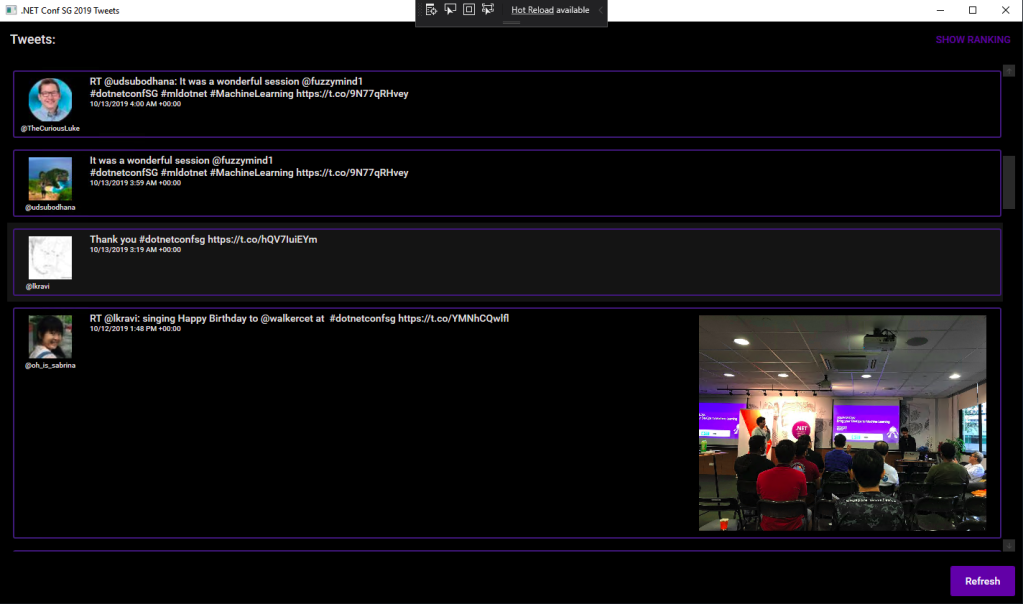
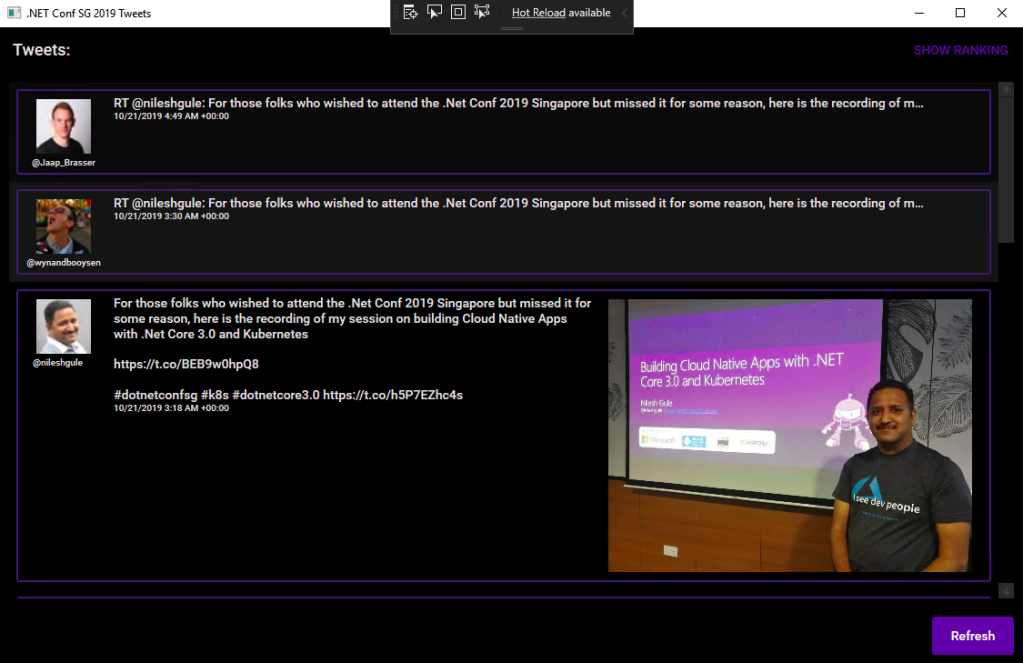
In order to make the conference to be more engaging, after discussing with Sabrina, I came out with a desktop app which will shows the recent tweets having #dotnetconfsg hashtag, which looks like the following.

Participants tweeting about our sessions.

To make this “game” more interesting, I announced that the top four participants who earn the highest scores would receive prizes from me. The formula to calculate the score is basically

  • +1 point for one tweet;
  • +5 point for one retweet of the tweet;
  • +5 point for one like of the tweet.

Throughout the conference, we thus had seen a huge number of tweets about our event and speakers. Some of them even tweeted with great photos (I should have given 5 points for great photos too).

In our talk, we used this desktop app as our sample. The app is built in .NET Framework 4.7. Sabrina started the demo with showing how we can modernise it to a .NET Core desktop app. I then covered a bit about Hot Reload, the runtime tools (the small little black bar on top of locally launched WPF app), and DevOps part of desktop app.

Starting from .NET Framework 4.7

After the talk, I redo the project to make it nicer. I have also published the code on GitHub: https://github.com/goh-chunlin/DotNetConfSgTweetsDashboard

I am using the Tweetinvi library to retrieve the tweets easily. I originally tried calling the Tweeter APIs directly from C# and it’s a painful experience. Instead of wasting resources on researching the Tweeter APIs, I change to use Tweetinvi because it allows me to easily get the tweets in just two lines of codes.

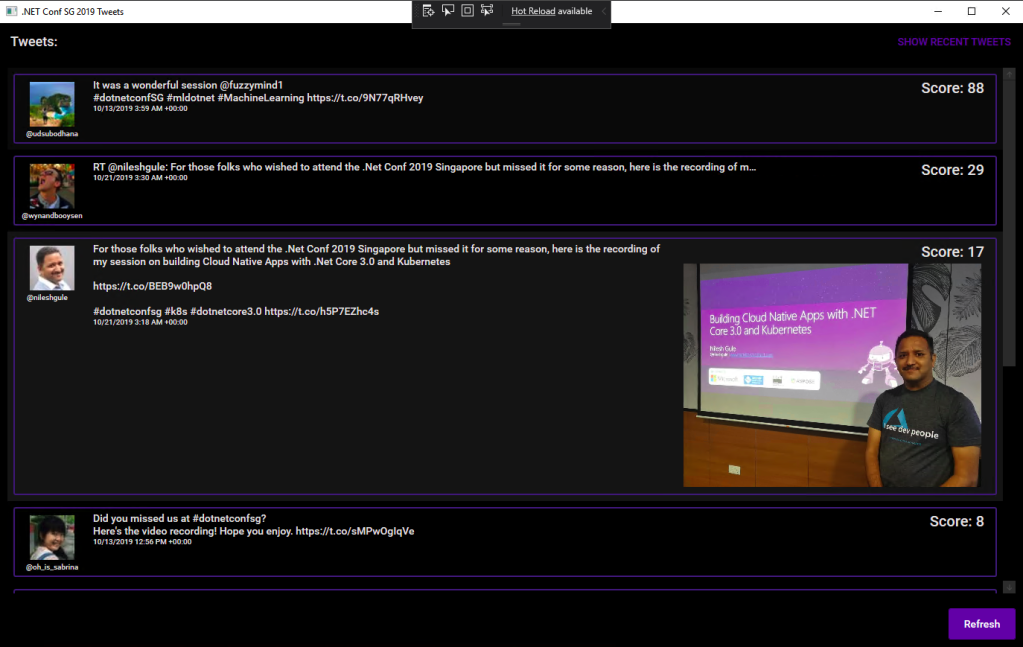
To improve the GUI, I use the Material Design in XAML Toolkit. So, I can easily change the WPF application to have dark mode. This is very important to me because I realise light mode isn’t displayed well on the projected screen during the event. So, it now looks as shown in the following screenshot.

New look with Material Design.

By clicking on the “Show Ranking” button at the top-right corner, we can easily tell the scores received by the participants.

The participants are sorted according to the score they receive.

Migrating to .NET Core 3.0

Now with many third-party libraries used in our WPF application, is the desktop app still compatible with .NET Core? Well, to answer this question, there is a tool from Microsoft called Portability Analyzer can give us a detail report on the set of APIs referenced in our apps that are not yet available in NET Core 3.0.

After downloading it and using it to check our application above, we received the following report.

This says that our WPF application is 100% portable to the .NET Core.

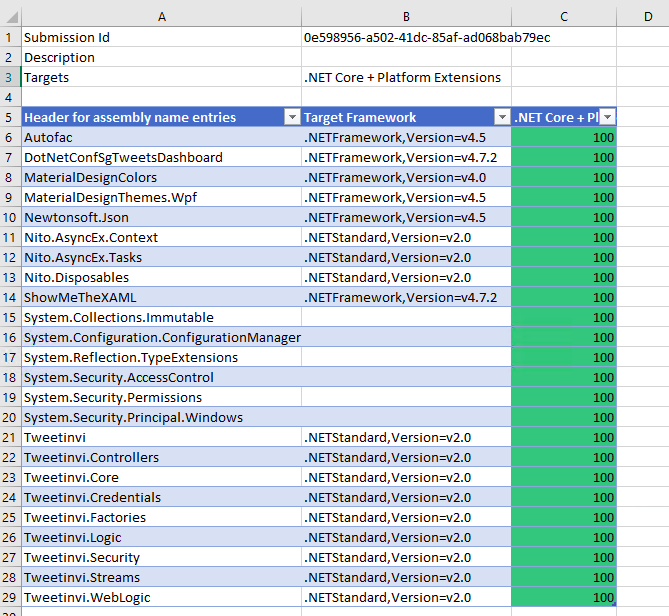
The Excel report comes with three tabs, i.e. Portability Summary (the one shown above), Details (empty), and Missing assemblies. There is one item in the report Missing assemblies though, as shown below.

There is one unresolved assembly.

Interestingly, if we refer to the .NET API Portability GitHub repo, we will see an issue filed by Alicia Li. There are many doubts over this tab.

However, if we proceed to use try-convert to migrate our WPF application from .NET Framework to .NET Core, it will be a successful conversion, as shown in the screenshot below.

Converted a .NET Framework project to .NET Core 3.0.

The try-convert tool is an open-source tool that helps us to migrate .NET Framework projects to .NET Core. After installing it, we need to restart the Command Prompt to use it.

The following screenshot shows how the app looks like after being migrated to .NET Core 3.0. Nothing significant is changed. If you would like to find out what have been changed, please visit the commit of this project on GitHub.

This is a WPF app in .NET Core 3.0.

XAML Islands

There is another thing that I shared in my talk is about XAML Islands. In fact, I talked about XAML Islands in Microsoft Insider Dev Tour too when I was sharing about WinUI.

Image may contain: 10 people, people sitting
Microsoft Insider Dev Tour (Image Credit: Microsoft Malaysia – Insider Dev Tour Kuala Lumpur)

XAML Islands is a feature that allows us to host UWP controls in non-UWP desktop applications. The reason of having it is to improve the UX of existing Win32 apps by leveraging UWP controls.

Although the documentation says it is enabled only starting from Windows 10, version 1903. However, if you are using version 1809, XAML Islands feature is also available already, just that not yet stable. So, the best choice is still using version 1903 and above.

In my presentation, since I was using the Windows 10 image hosted on Microsoft Azure VM, the best version I could get is 1809.

Windows 10 Pro, version 1809 on Microsoft Azure.

The quick-start way to use an XAML Island inside a WPF app is to use the NuGet packages from Microsoft. The one I am using is Microsoft.Toolkit.Wpf.UI.Controls, which has wrapper classes for 1st party controls, such as the InkCanvas, InkToolbar, MapControl, and MediaPlayerElement, all for WPF.

Installed with Microsoft.Toolkit.Wpf.UI.Controls.

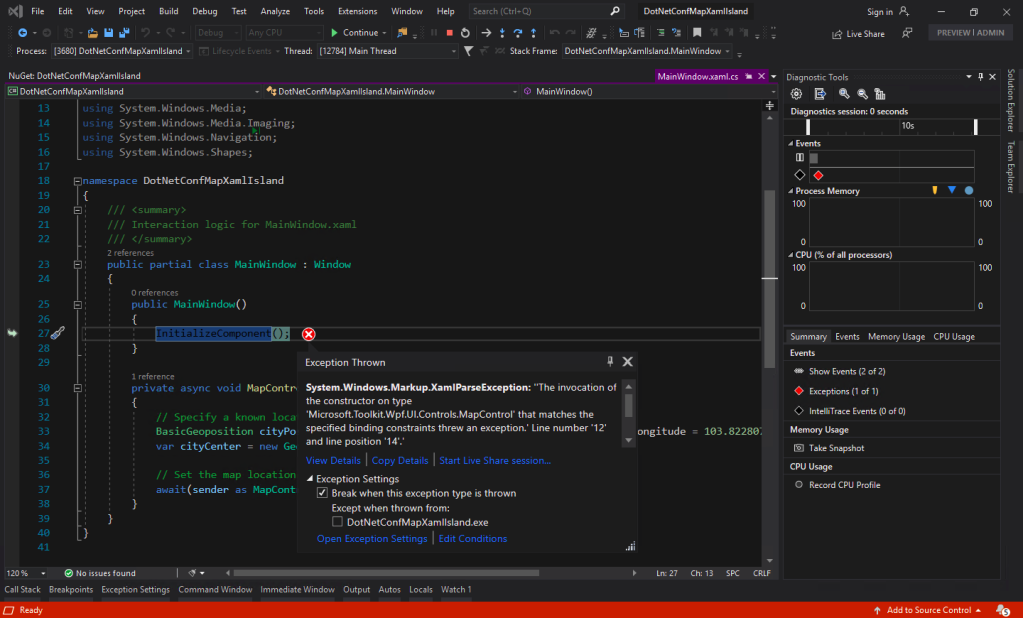
You may ask why I am using version 5.1.1 of the Microsoft.Toolkit.Wpf.UI.Controls. On the day of .NET Conf Singapore, the version 6.0 (Preview 9.1) of it is already out. However, when I try to use the library, it threw the exception, as shown in the screenshot below.

Oops, app crashes with Microsoft.Toolkit.Wpf.UI.Controls 6.0 (Preview 9.1).

I could only demonstrated how I used the MapControl in a WPF app with XAML Islands.

Such a beautiful map displayed on WPF app!

Creating Build Pipeline in Azure DevOps

Now, with the codes of our WPF application on GitHub, we can create a Build pipeline for the app on Azure DevOps. This is not a new feature but it is nice to see how we can now build a .NET Core WPF app on Azure DevOps.

Benefits of DevOps (Image Credit: .NET Conf 2019)

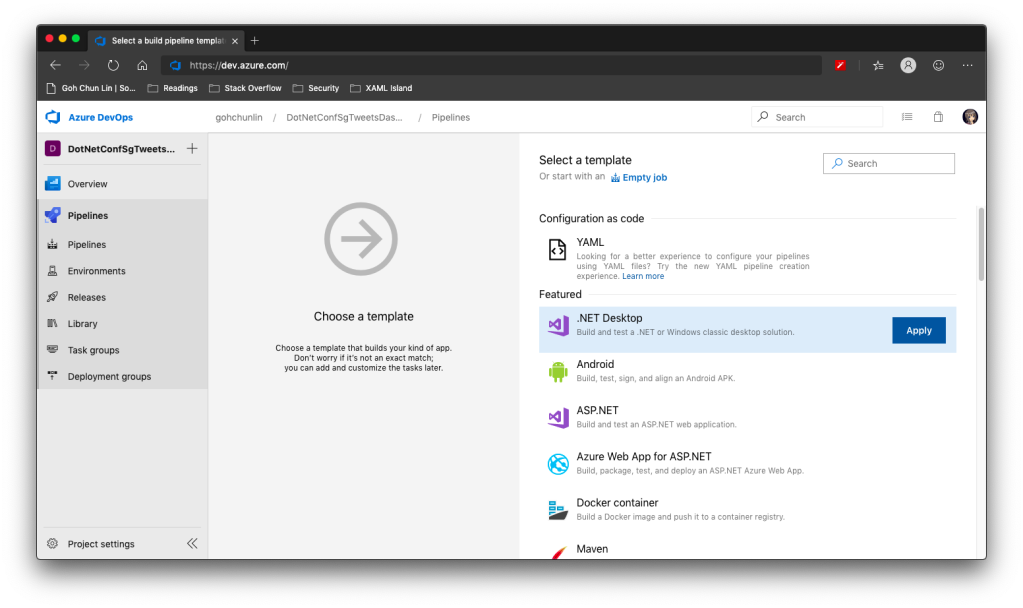
There is a template available on Azure DevOps to build .NET Desktop app.

We can apply this template to build .NET Desktop app on Azure DevOps.

However, before we proceed to start the build, we need to make a few changes to it.

Since we will be using dotnet publish later, so the BuildPlatform variable is not necessary and can be removed.

Removing BuildPlatform variable from the pipeline.

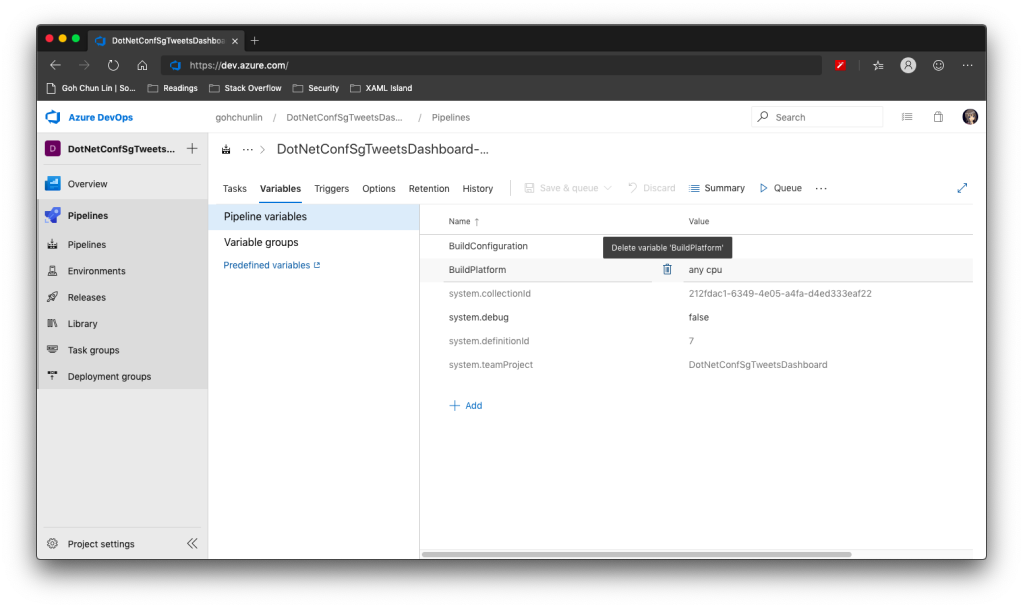
Instead, we need to add a new variable called DOTNET_SKIP_FIRST_TIME_EXPERIENCE and set it to true. This is to speed up the build process because by default when we run any .NET Core SDK command on Azure DevOps, it does some caching. However, now we are running this on a hosted build agent, so this caching will never be useful because the agent will be discarded right after the build is completed. Thanks Daniel Jacobson for highlighting this in his video.

Daniel Jacobson (right) explains about Azure DevOps and .NET Core SDK commands. (Image source: YouTube video)

After that, we need to remove all the default steps because we need to start from scratch for .NET Core.

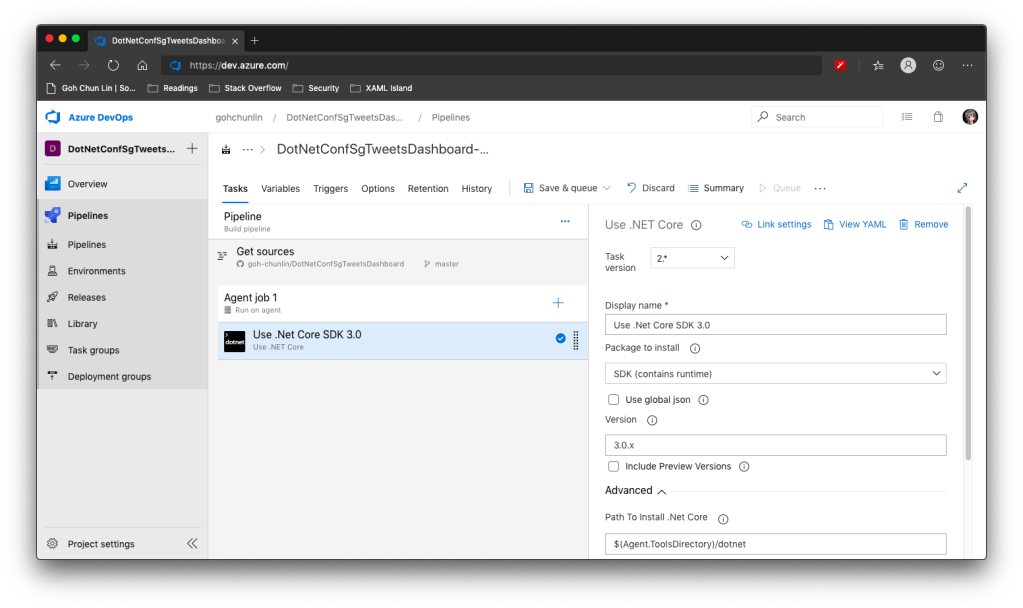
The first step is to install .NET Core SDK 3.0. Remember to state “3.0.x” as the version otherwise if there is a minor update to .NET Core 3.0, we will still be using the outdated one to build.

Step 1: Use .NET Core SDK 3.0

After that, we are going to do dotnet publish.

Starting with .NET Core 2.0, we don’t have to run dotnet restore because it’s run implicitly by all commands that require a restore to occur. Also dotnet publish will build the project, so we do not need to run dotnet build.

Since this is a WPF project, so we have to uncheck the “Publish Web Projects” checkbox, together with the other two checkboxes “Zip Published Projects” and “Add project name to publish path”, as shown in the screenshot below.

Step 2: dotnet publish

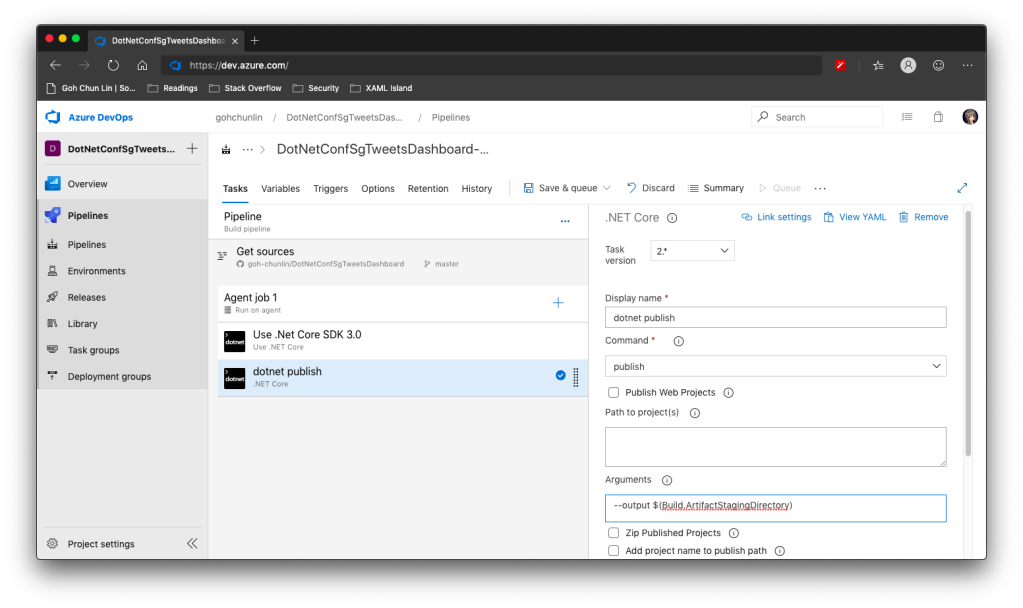
We also need to specify the output of the artifacts. We will put it in a directory known as $(Build.ArtifactStagingDirectory). This is actually a pre-defined variable that we can find in the Azure DevOps documentation. There is a link to this document in the Variables tab.

Now we proceed to add the next step, which is to publish the artifact. Here we specify $(Build.ArtifactStagingDirectory) as the path of the directory to publish. Then we also specify a user friendly name for the artifact.

Step 3: Publish Pipeline Artifact

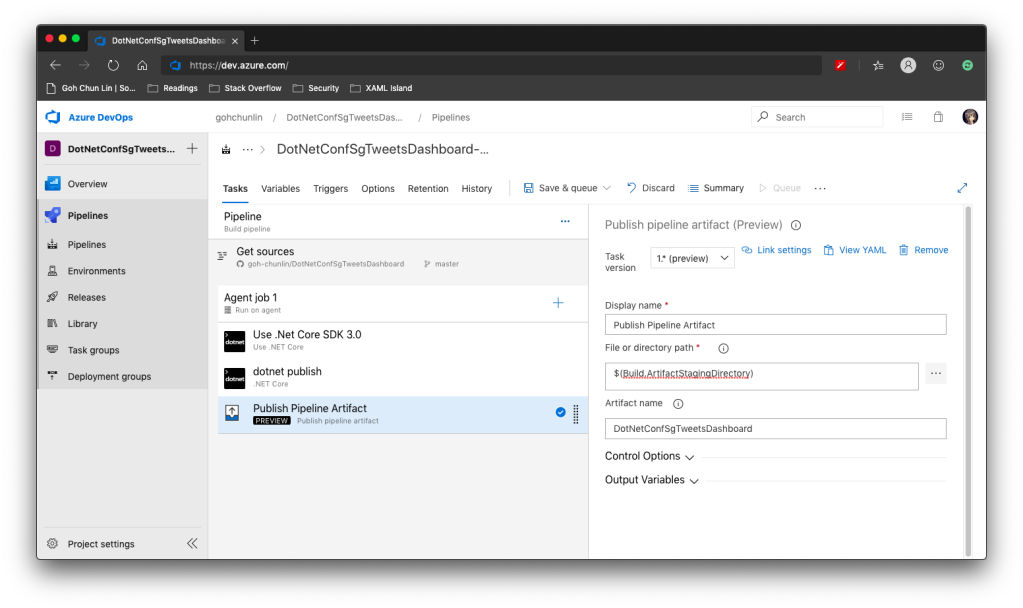
Now we can click the “Save & queue” to run this pipeline.

In the published artifact, we will see the following.

Published artifact in our first attempt.

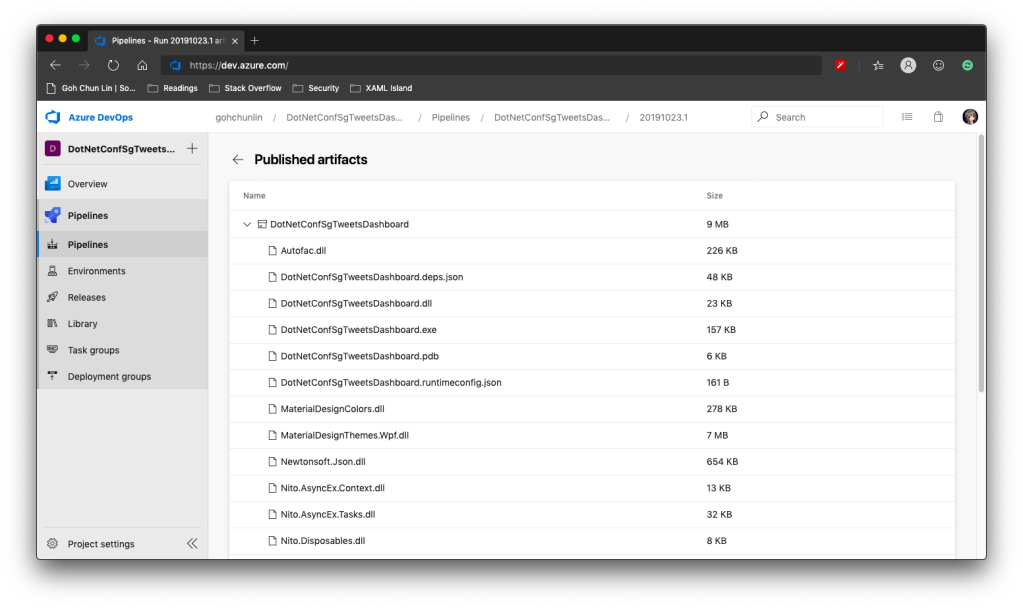
Wow, there are a lot of DLLs! The .exe file alone is only 157KB.

Fortunately, starting from .NET Core 3.0, as long as we specify the following in our csproj file, it will produce a single .exe file.

<PublishSingleFile>true</PublishSingleFile>

However, there is one more thing to take note is that if we miss out the <RuntimeIdentifier>, there will be an error NETSDK1097 which says, “It is not supported to publish an application to a single-file without specifying a RuntimeIdentifier. Please either specify a RuntimeIdentifier or set PublishSingleFile to false.”

<RuntimeIdentifier>win-x86</RuntimeIdentifier>

With this change, when we run the Build pipeline again, we get the following.

Published artifact with <PublishSingleFile>.

We now only have one .exe file but its size has grown from 157KB to 145MB!

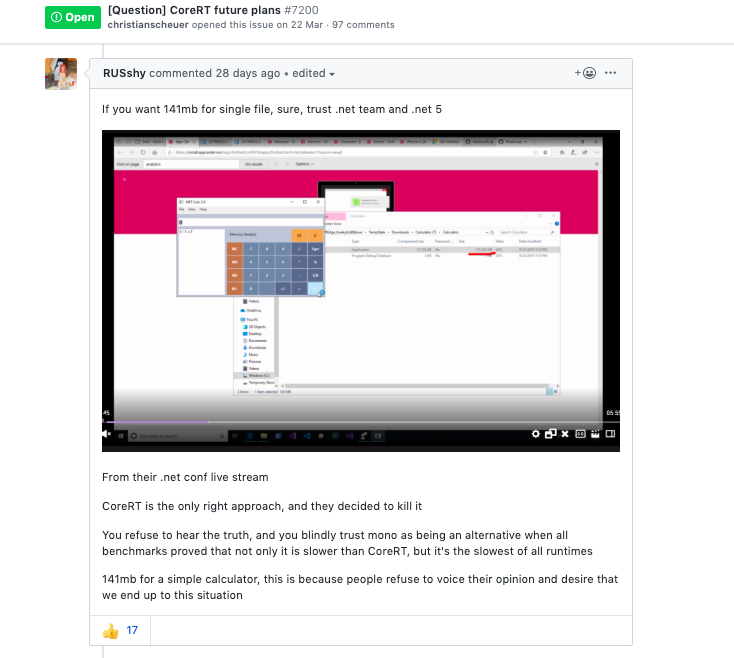
There is mixed feeling for developers in .NET CoreRT project. In their discussion about CoreRT future, they’re disappointed about CoreRT not being mentioned, instead PublishSingleFile was mentioned in the .NET Conf 2019.

“CoreRT is the only right approach” (Image Soure: .NET CoreRT Issue #7200)

In fact, according to Scott Hanselmen’s blog post “Making a tiny .NET Core 3.0 entirely self-contained single executable”, he suggested to set <PublishTrimmed> to be true to trim out unused codes so that now the .exe will be smaller.

Published artifact with additional <PublishTrimmed>.

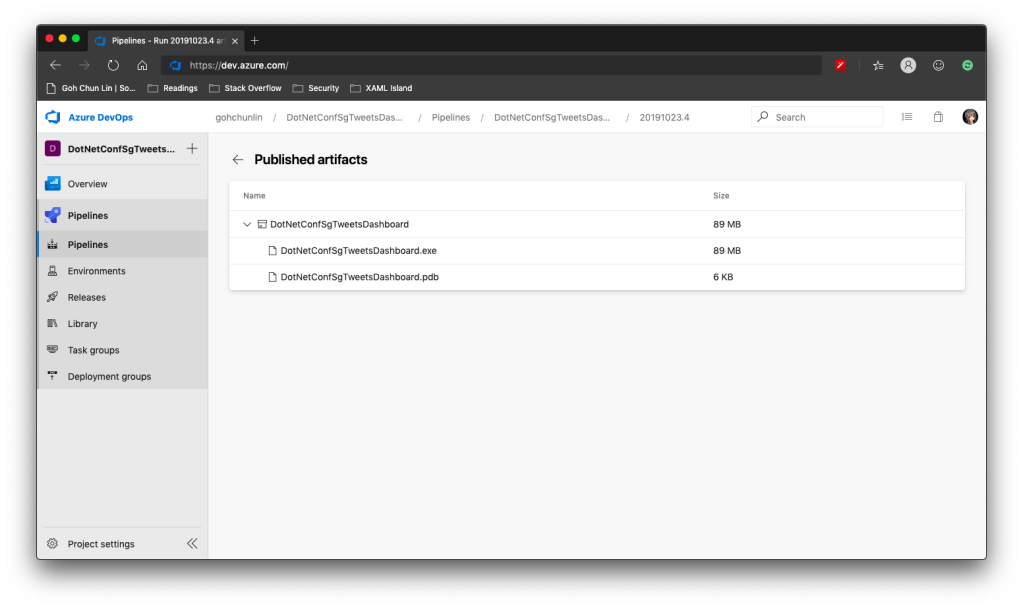
Cool, now we have a .exe file with 89MB, instead of the one over 100MB.

With this .exe file, we can proceed to the release of our application.

Releasing WPF Application in VS App Center

VS App Center was launched in 2017, which was previously known as VS Mobile Center. When it was first launched, it was mainly for Android, iOS, macOS, and Windows apps. The “Windows apps” here refer to UWP apps. Only in August 2019, WinForm and WPF applications are supported.

WinForms and WPF are now available on VS App Center but still in preview.

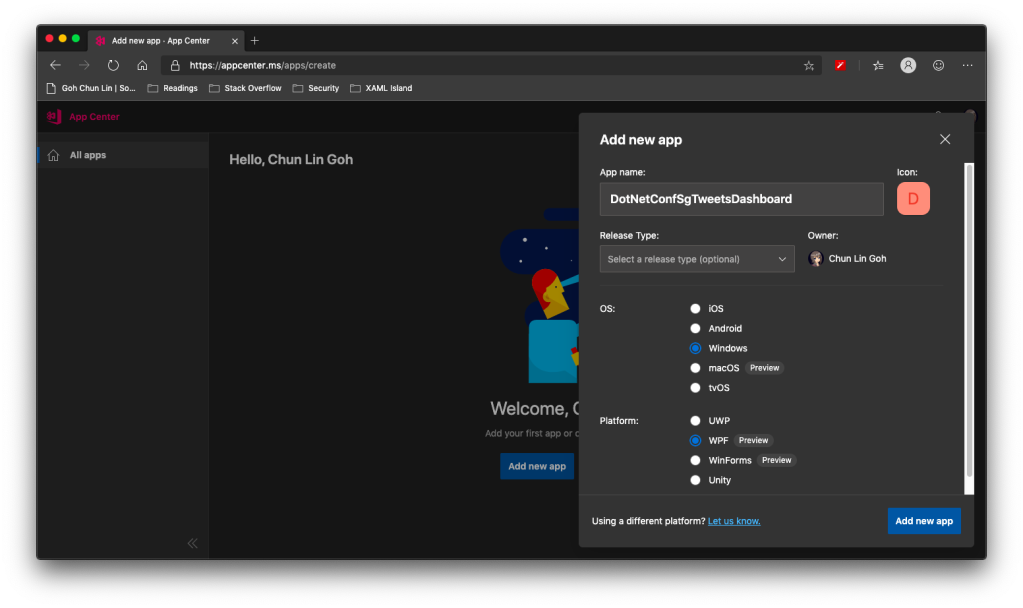
So, the artifact generated in Azure DevOps Build pipeline cannot be automatically delivered to VS App Center even after .NET Conf 2019. We now have to do it manually.

Firstly, we need to download the actifact as a zipped file in Azure DevOps.

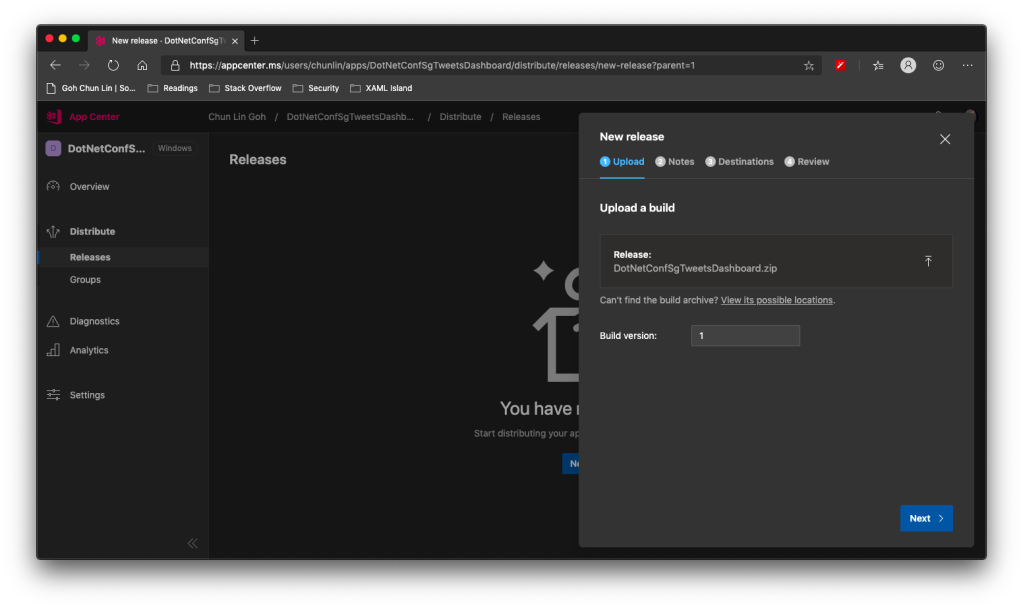
Secondly, we need to upload the zipped file to the VS App Center in its Releases tab, as shown in the following screenshot.

Setting Build version to 1 because this is our first release of the app.

After keying the release notes, we will be landed on a page to choose who we should distribute the app to. Normally they are our developers, business analysts, and testers. Here, in my example, I only have one group called Collaborator and I am the only one in the group.

We are not allowed to add those who are not in our App Center as testers.

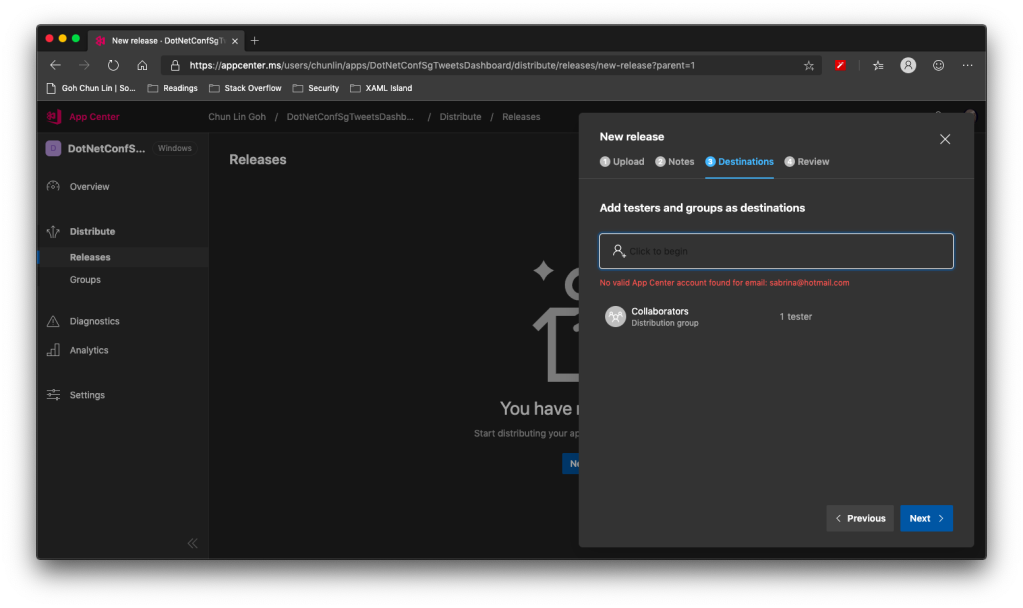
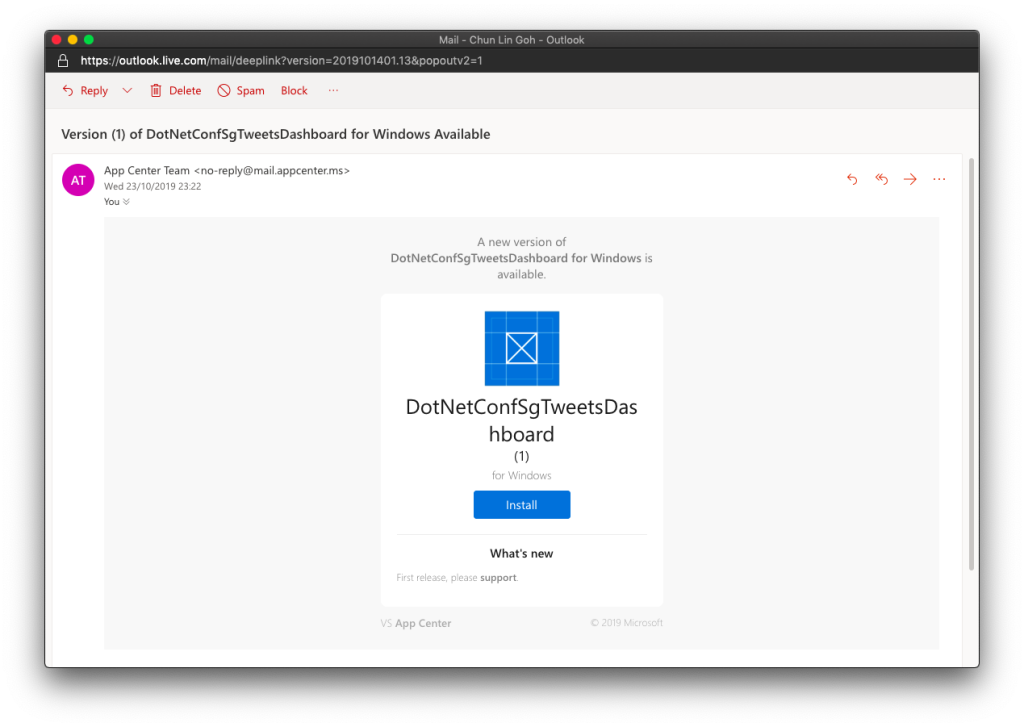
Finally, we will hit the “Distribute” button to release our app to testers. As tester, I will receive the email notifying about the new release.

Yay, new release available for in-house testing.

Analytics with App Center SDK

We can also integrate our WPF desktop app with App Center SDK to further collect data to find out how people use our app as well as the crashes in our app.

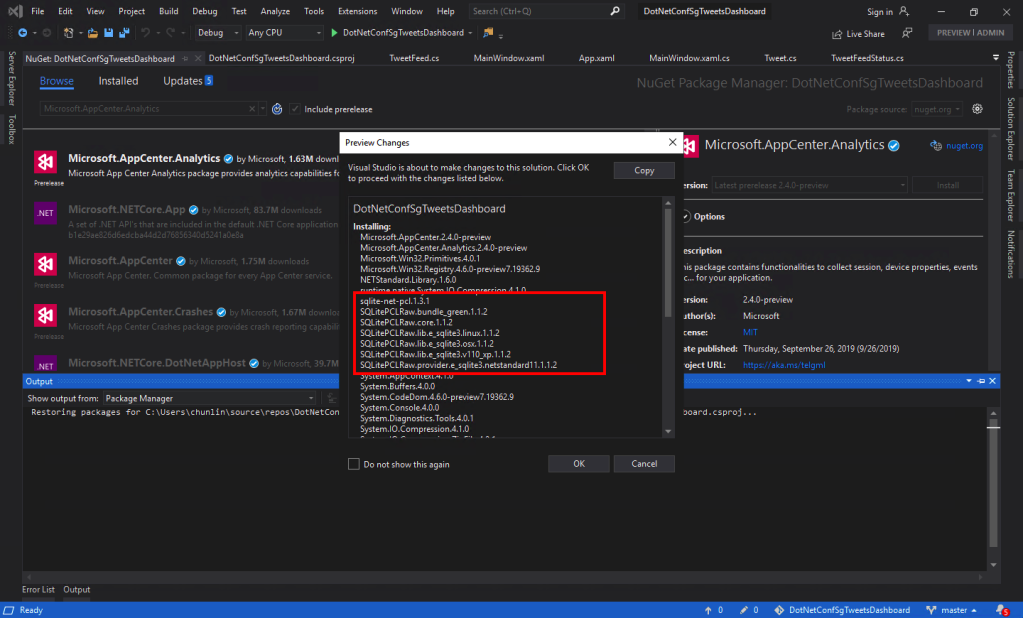
To do so, firstly, we need to install the following two Nuget packages. As the support for WPF SDK is still in preview, please remember to check the “Include prerelease” checkbox.

  • Microsoft.AppCenter.Analytics;
  • Microsoft.AppCenter.Crashes.
SQLitePLCRaw is being installed when we install the App Center SDK.

Now we can proceed to put the following code in the first window that will be launched in our app. In my case, it is the MainWindow. So, right after the InitializeComponent() is called, the following codes will be executed.

AppCenter.Start("<app-secret>", 
    typeof(Analytics), typeof(Crashes)); 

The App Secret can be found in the code sample of the Overview page in VS App Center.

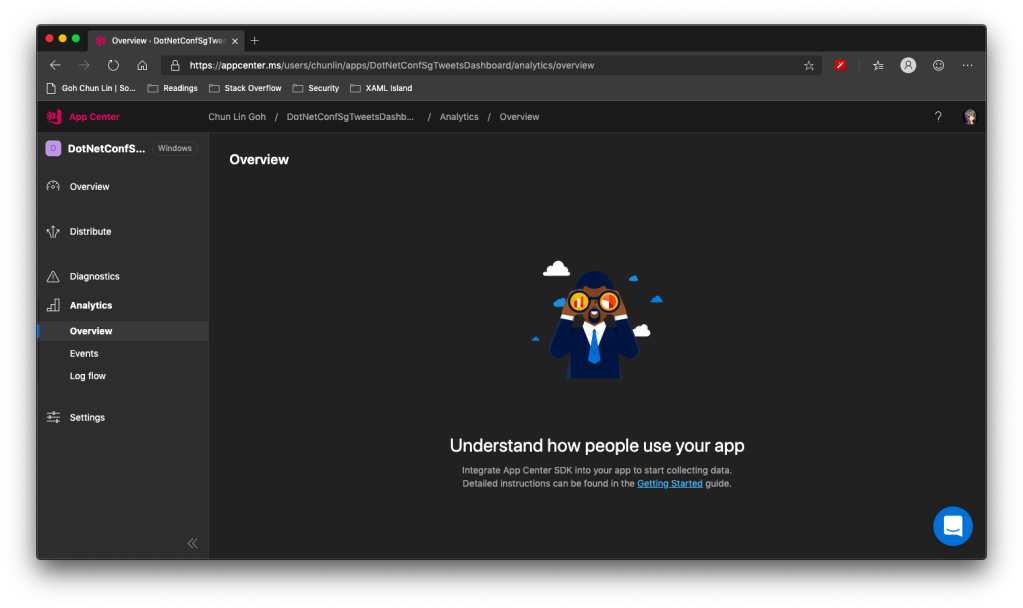
However, if we run the WPF app now, the Analytics Overview page in VS App Center will still say there is no data. Why is it so?

No analytics, how come?

It turns out that, as highlighted in .NET Conf 2019, there is a bug in the preview SDK.

Daniel Jacobson mentions about the bug. (Image source: YouTube video)

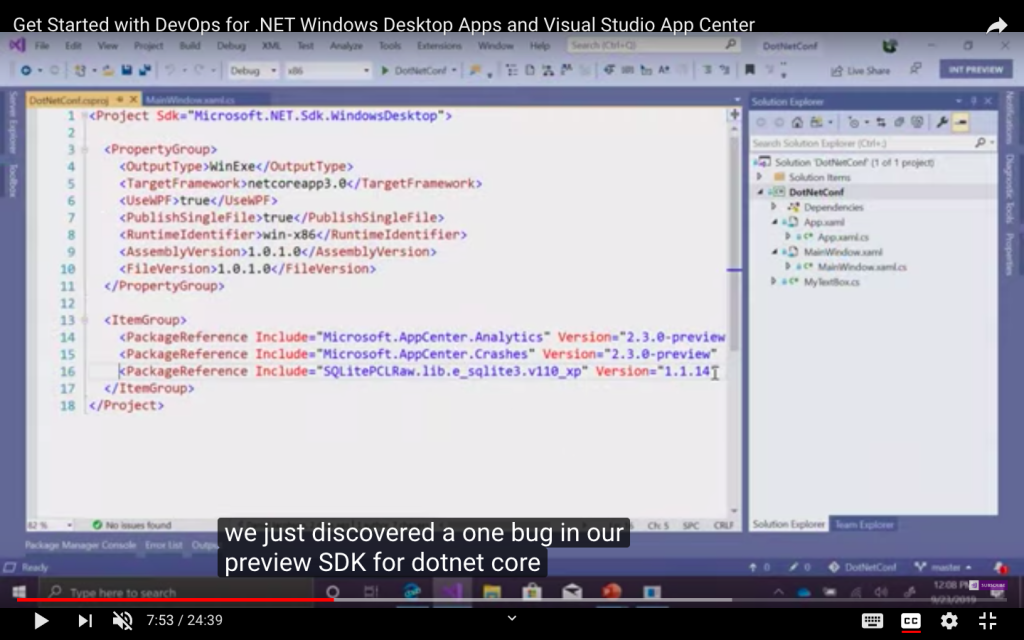
So what we need to do is simply to add the following line in <ItemGroup> in the .csproj file.

<PackageReference Include="SQLitePCLRaw.lib.e_sqlite3.v110_xp" Version="1.1.14" />

Yup, if you have noticed earlier when we’re installing the App Center SDK, SQLitePCLRaw was being installed also. Just because of the bug in the SDK, this line was not added to the project file and thus we have to manually reference it. Hopefully this bug gets fixed soon.

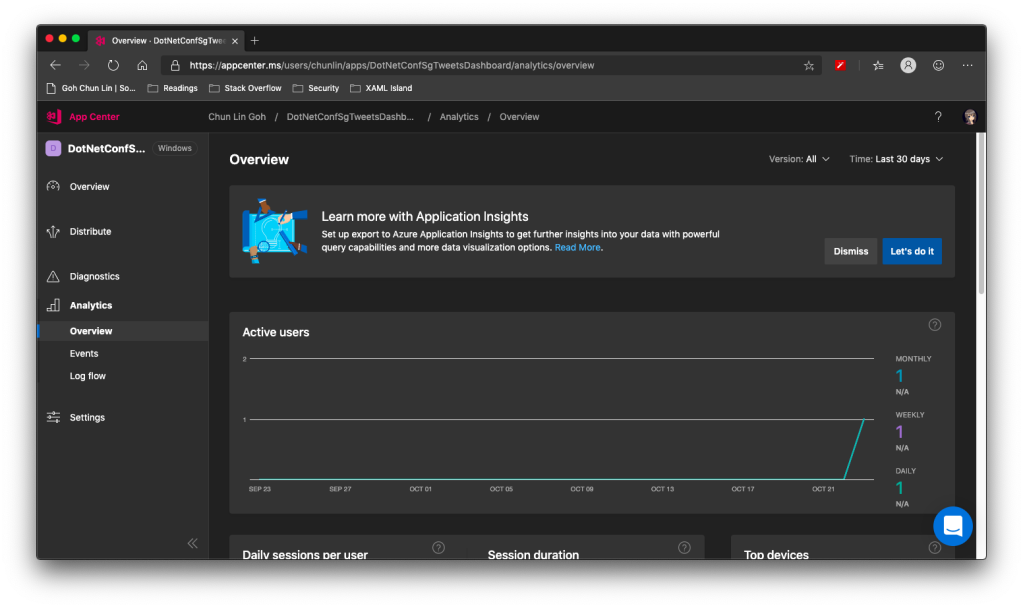
Now when we launch our WPF app again, the nice dashboard will show there is 1 user. Yay!

+1 active user in our app!

Conclusion

That’s all so far for what I’d like to share in addition to what I have shared in .NET Conf Singapore 2019.

Happy .NET Conf 2019 from Singapore! (Image Credit: .NET Developers Community Singapore)

If you spot any mistake or you have any suggestion to make, please let me know in the Comments section below. Thank you!

References

Unit Testing with Golang

Continue from the previous topic

Unit Testing is a level of automated software testing that units which can be modular parts of the program are tested. Normally, the “unit” refers to a function, but it doesn’t necessary always be so. A unit typically takes in data and returns an output. Correspondingly, a unit test case passes data into the unit and check the resultant output to see if they meet the expectations.

Unit Testing Files

In Golang, unit test cases are written in <module>_test.go files, grouped according to their functionality. In our case, when we do unit testing for the videos web services, we will have the unit test cases written in video_test.go. Also, the test files need to be in the same package as tested functions.

Necessary Packages

In the beginning, we need to import the “testing” package. In each of our unit test function, we will take in a parameter t which is a pointer to testing.T struct. It is the main struct that we will be using to call out any failure or error.

In our code video_test.go, we use only the function Error in testing.T to log the errors and to mark the test function fails. In fact, Error function is a convenient function in the package that combines calling of Log function and then the Fail function. The Fail function marks the test case has failed but it still allows the execution of the rest of the test case. There is another similar function called FailNow. The FailNow function is stricter and exits the test case once it’s encountered. So, if FailNow function is what you need, you have to call the Fatal function which is another convenient function that combines Log and FailNow instead of the Error function.

Besides the “testing” package, there is another package that we need in order to do unit testing for Golang web applications. It is the “net/http/httptest” package. It allows us to use the client functions of the “net/http” package to send an HTTP request and capturing the HTTP response.

Test Doubles, Mock, and Dependency Injection

Before proceeding to writing unit test functions, we need to get ready with Test Doubles. Test Double is a generic term for any case where we replace a production object for testing purposes. There are several different types of Test Double, of which a Mock is one. Using Test Doubles helps making the unit test cases more independent.

In video_test.go, we apply the Dependency Injection in the design of Test Doubles. Dependency Injection is a design pattern that decouples the layer dependencies in our program. This is done through passing a dependency to the called object, structure, or function. This dependency is used to perform the action instead of the object, structure, or function.

Currently, the handleVideoRequests handler function uses a global sql.DB struct to open a database connection to our PostgreSQL database to perform the CRUD. For unit testing, we should not depend on database connection so much and thus the dependency on sql.DB should be removed. The dependency on sql.DB then should be injected into the process flow from the main program.

To do so, firstly, we need to introduce a new interface called IVideo.

type IVideo interface {

GetVideo(userID string, id int) (err error)
GetAllVideos(userID string) (videos []Video, err error)
CreateVideo(userID string) (err error)
UpdateVideo(userID string) (err error)
DeleteVideo() (err error)

}

Secondly, we make our Video struct to implement the new interface and let one of the fields in the Video struct a pointer to sql.DB. Unlike in C#, we have to specify which interface the class is implementing, in Golang, as long as the Video struct implements all the methods that IVideo has (which is already does), then Video struct is implementing the IVideo interface. So now our Video struct looks as following.

type Video struct {
Db *sql.DB
ID int `json:"id"`
Name string `json:"videoTitle"`
URL string `json:"url"`
YoutubeVideoID string `json:"youtubeVideoId"`
}

As you can see, we added a new field called Db which is a pointer to sql.DB.

Now, we can create a Test Double called FakeVideo which implements IVideo interface to be used in unit testing.

// FakeVideo is a record of favourite video for unit test
type FakeVideo struct {
ID int `json:"id"`
Name string `json:"videoTitle"`
URL string `json:"url"`
YoutubeVideoID string `json:"youtubeVideoId"`
CreatedBy string `json:"createdBy"`
}


// GetVideo returns one single video record based on id
func (video *FakeVideo) GetVideo(userID string, id int) (err error) {
jsonFile, err := os.Open("testdata/fake_videos.json")
if err != nil {
return
}

defer jsonFile.Close()

jsonData, err := ioutil.ReadAll(jsonFile)
if err != nil {
return
}

var fakeVideos []FakeVideo
json.Unmarshal(jsonData, &fakeVideos)

for _, fakeVideo := range fakeVideos {
if fakeVideo.ID == id && fakeVideo.CreatedBy == userID {
video.ID = fakeVideo.ID
video.Name = fakeVideo.Name
video.URL = fakeVideo.URL
video.YoutubeVideoID = fakeVideo.YoutubeVideoID

return
}
}

err = errors.New("no corresponding video found")

return
}
...

So instead of reading the info from the PostgreSQL database, we read mock data from a JSON file which is stored in testdata folder. The testdata folder is a special folder where Golang will ignores when it builds the project. Hence, with this folder, we can easily read our test data from JSON file fake_videos.json through relative path from video_test.go.

Since now the Video struct is updated, we need to update our handleVideoAPIRequests method to be as follows.

func handleVideoAPIRequests(video models.IVideo) http.HandlerFunc {
    return func(writer http.ResponseWriter, request *http.Request) {
        var err error

       ...

        switch request.Method {
        case "GET":
            err = handleVideoAPIGet(writer, request, video, user)
        case "POST":
            err = handleVideoAPIPost(writer, request, video, user)
        case "PUT":
            err = handleVideoAPIPut(writer, request, video, user)
        case "DELETE":
            err = handleVideoAPIDelete(writer, request, video, user)
        }

        if err != nil {
            util.CheckError(err)
            return
        }
    }
}

So now we pass an instance of the Video struct directly into the handleVideoAPIRequests. The various Video methods will use the sql.DB that is a field in the struct instead. At this point of time, handleVideoAPIRequests no longer follows the ServeHTTP method signature and is no longer a handler function.

Thus, in the main function, instead of attaching a handler function to the URL, we call the handleVideoAPIRequests function as follows.

func main() {
...

mux.HandleFunc("/api/video/",
handleRequestWithLog(handleVideoAPIRequests(&models.Video{Db: db})))

...
}

Writing Unit Test Cases for Web Services

Now we are good to write unit test cases in video_test.go. Instead of passing a Video struct like in server.go, this time we pass in the FakeVideo struct, as highlighted in one of the test cases below.

func TestHandleGetAllVideos(t *testing.T) {
    mux = http.NewServeMux()
    mux.HandleFunc("/api/video/", handleVideoAPIRequests(&models.FakeVideo{}))
    writer = httptest.NewRecorder()

    request, _ := http.NewRequest("GET", "/api/video/", nil)
    mux.ServeHTTP(writer, request)

   if writer.Code != 200 {
        t.Errorf("Response code is %v", writer.Code)
    }

    var videos []models.Video
    json.Unmarshal(writer.Body.Bytes(), &videos)

    if len(videos) != 2 {
        t.Errorf("The list of videos is retrieved wrongly")
    }
}

By doing this, instead of fetching videos from the PostgreSQL database, now it will get from the fake_videos.json in testdata.

Testing with Mock User Info

Now, since we have implemented user authentication, how do we make it works in unit testing also. To do so, in auth.go, we introduce a flag called isTesting which is false as follows.

// This flag is for the use of unit testing to do fake login
var isTesting bool

Then in the TestMain function, which is provided in testing package to do setup or teardown, we will set this to be true.

So how do we use this information? In auth.go, there is this function profileFromSession which retrieves the Google user information stored in the session. For unit testing, we won’t have this kind of user information. Hence, we need to mock this data too as shown below.

if isTesting {
        return &Profile{
            ID: "154226945598527500122",
            DisplayName: "Chun Lin",
            ImageURL: "https://avatars1.githubusercontent.com/u/8535306?s=460&v=4",
        }
    }

With this, then we can test whether the functions, for example, are retrieving correct videos of the specified user.

Running Unit Test Locally and on Azure DevOps

Finally, to run the test cases, we simply use the command below.

go test -v

Alternatively, Visual Studio Code allows us to run specified test case by clicking on the “Run Test” link above the test case.

Running test on VS Code.

We can then continue to add the testing as one of the steps in Azure DevOps Build pipeline, as shown below.

Added the go test task in Azure DevOps Build pipeline.

By doing this, if any of the test cases fails, there won’t be a build made and thus our system becomes more stable now.

Deploy Golang App to Azure Web Apps with CI/CD on DevOps

Continue from the previous topic

After we have our code on Github repository, now it’s time to automate our builds and deployments so that our Golang application will always be updated whenever there is a new change to our code on Github.

Sample Golang Web App DevOps Pipelines

To do that, we will use Azure DevOps and its Pipelines module. We can easily create a DevOps project in Azure Portal for our Golang application because there is a template available.

Golang is one of the supported languages in Azure DevOps.

As a start, we will focus on “Windows Web App” instead of containers. After that, we just need to configure basic information of the web app, such as its name, location, resource group, pricing tier, and application insights.

We can configure Application Insights while creating the DevOps project.

After that, we shall be able to see a new DevOps project created with the following two folders, Application and ArmTemplates, in Repos. Application folder contains a sample Golang application.

However, why is there an ArmTemplates folder? This is because by default when we create a new Azure DevOps project for Golang application using the steps above, it will also automatically create a web app for us. Hence, this is the ARM (Azure Resource Manager) template Azure uses to do that.

Content of ArtTemplate which is used to create/update the Azure web app.

With this pipeline setup, we can simply update the default Golang code in the Repos to launch our Golang application on Azure. However, what if we want to link Azure DevOps with the codes we already have on our Github repo?

Connecting DevOps with Github

To do that, let’s start again by creating a new project on Azure DevOps, instead of Azure portal. Here, I will make the DevOps project to be Public so that you can access it while reading this article.

Creating a new public DevOps project.

Once the project is created, we can proceed to the Project Settings page of the project to disable some modules that we don’t need, i.e. Boards and Repos.

We need to hide both Boards and Repos because Github provides us similar features.

Setting up Build Pipeline

After this, we then can proceed to create our Build pipeline by first a connecting to our Github repo.

If our code is neither on DevOps or Github, we can click “Use the visual designer” to proceed.

Before continuing to choose the corresponding Github repo, we need to have a azure-pipelines.yml. To understand the guidelines to write proper Azure DevOps Pipelines YAML, we can refer to the official guide. For Golang, there is another specific documentation on how to build and test Golang projects with Azure DevOps Pipelines.

For our case, we will have the following pipeline YAML file.

# Go 
# Build your Go project.

resources:
- repo: self

pool:
vmImage: 'vs2017-win2016'

steps:
- task: GoTool@0
inputs:
version: 1.11.5
displayName: 'Use Go 1.11.5'
- task: Go@0
displayName: 'go get'
inputs:
arguments: '-d'
workingDirectory: '$(System.DefaultWorkingDirectory)'
- task: Go@0
displayName: 'go build'
inputs:
command: build
arguments: '-o "$(System.TeamProject).exe"'
workingDirectory: '$(System.DefaultWorkingDirectory)'
- task: ArchiveFiles@2
displayName: 'Archive Files'
inputs:
rootFolderOrFile: '$(Build.Repository.LocalPath)'
includeRootFolder: False
- task: PublishBuildArtifacts@1
displayName: 'Publish Artifact'
inputs:
artifactName: drop

There are a few virtual machine images from Microsoft-hosted agent pool. We choose the “Visual Studio 2017 on Windows Server 2016 (vs2017-win2016)” image because I normally use Visual Studio 2017 for development.

The first task is the Go Tool Installer task. It will find and download a specific version of the Go tool into the tool cache and add it to the PATH. Here we will use the latest version of Golang which is 1.11.5 at the point of writing this article.

The subsequent step will be running go get. This command will download the packages along with their dependencies. Since the -d argument is present, it will only download them but not install them.

After that, it will run go build. This step compiles the packages along with their dependencies, but it does not install the results. By default, the build command will write the resulting executable to an output file named after the first source file (or the source code directory). However, with the -o flag here, it forces build to write the resulting executable to the output file named $(System.TeamProject).exe, i.e. GoLab.exe.

Next we use the Archive Files task to create an archive file from a source folder. Finally, we use the Publish Build Artifacts task to publish build artifact to DevOps pipelines. With Archive Files task, it will generate a zip file called as such D:\a\1\a\54.zip where 54 is the build id. Publish Build Artifacts task will then upload the zip file to file container called drop.

Details of the Archive Files task.

To find out what is inside the file container drop, we can download it from the Summary page of the build. It is actually a folder containing all the files of our Golang application.

We can download the drop from the Summary page of the build.

Setting up Release Pipeline

Now we can proceed to create our Release pipeline. Luckily, there is already a template available to help us kick starting the Release pipeline.

The “Deploy a Go app to Azure App Service” pipeline is what we need here.

After selecting the template, we will need to specify the artifact, as shown below. There is version that we can choose, for example, the latest version from a specific branch with tags. Here we choose Latest so that our latest code change will always get deployed to Azure Web Apps.

Adding artifact.

Next, we need to enable the CD trigger as shown in the following screenshot so that a new release will be created every time a new build is available.

Enabling CD trigger.

Now we are at Pipeline tab. What we need to next is to move on to the Tasks tab, which is now having a red exclamation mark. We just need to authorize the Release pipeline to our Azure subscription and then connect it to the Azure Web App in the subscription.

Completing tasks.

Now, as you can see, the agent basically does three steps:

  • Stop the Azure Web App;
  • Deploy our code to Web App;
  • Start the Web App.

What interests us here is the second step. The reason why we need to generate a zip file in Build pipeline is also because in the second step, we need to specify the file path to the zip files to deploy.

Default configuration of second step.

Finally, we can just Save the pipeline and rename the “New release pipeline” to another friendlier name.

Now we can manually create a Release to test it out.

Create a new release manually.

Since we trigger this release manually, we also need to click in to deploy it manually.

Deploying to Azure App Service in progress.

After the deployment is done, we can view its summary as shown below.

The deployment process of the agent.

Conclusion

That’s all for setting up simple build and release pipelines on Azure DevOps to deploy our Golang web app to Azure Web Apps.

TCP Listener on Microsoft Azure with Service Fabric

azure-service-fabric-load-balancer.png

Getting TCP listener to run on Microsoft Azure is always an interesting topic to work on. Previously, I did one experimental TCP listener on Azure Cloud Service and it works quite well.

Today, I’d like to share with you my another experiment which is hosting a TCP Listener on Microsoft Azure with Service Fabric.

Step 0: Installing Service Fabric SDK

Most of the time, it’s better to run the Visual Studio 2017 in Administrator mode otherwise debugging and deployment of Service Fabric applications may have errors.

Before we can start a new Service Fabric application project on Visual Studio, we first need to make sure Service Fabric SDK is installed.

service-fabric-sdk-must-be-installed.png
Visual Studio will prompt us to install Service Fabric SDK.

The template that I use is Stateless Service under .NET Core 2.0. This project template is to create a stateless reliable service with .NET Core.

Step 1: Add TCP Endpoint

In the ServiceManifest.xml of the PackageRoot folder of the application project, we need to specify an endpoint that our TCP Listener will be listening to. In my case, I am using port 9005. So I need to add an endpoint as shown below in the ServiceManifest.xml.

<Endpoint Name="TcpEndpoint" Protocol="tcp" Port="9005"/>

Step 2: Create Listeners

In the StatelessService class, there is a CreateServiceInstanceListeners method that we can override to create TCP listeners with the following codes.

protected override IEnumerable CreateServiceInstanceListeners()
{
    var endpoints = Context.CodePackageActivationContext.GetEndpoints()
        .Where(endpoint => endpoint.Protocol == EndpointProtocol.Tcp)
        .Select(endpoint => endpoint.Name);

    return endpoints.Select(endpoint => new ServiceInstanceListener(
        serviceContext => new TcpCommunicationListener(serviceContext, ServiceEventSource.Current, endpoint), endpoint));
}

Then in the RunAsync method, which is the main entry point for our service instance, we can simply include the code for TCP Listener to receive and send message to the clients.runasync.png

Step 3: Create Service Fabric Cluster


There are a few simple steps for us to follow in order to create a new Service Fabric cluster on Microsoft Azure.

Firstly, we need to specify some basic information, such as cluster name, OS, and default VM credentials.

service-fabric-step1-configure-basic-settings.png
Configure basic settings for a new Azure Service Fabric cluster.

Secondly, we need to define Node Types. Node types can be seen as equivalent to the roles in Cloud Service. Node types define the VM sizes, the number of VMs, and their properties. Every node type that is defined in a Service Fabric cluster maps to a virtual machine scale set.

We can start with only one node type. The portal will then prompt us to select one VM size. By default, it only shows three recommended sizes. If you would like to find out more other specs with lower price, please click on “View All”.

I once use A0 (which coasted USD 14.88) for experimental purpose. However, it turns out that the newly created service fabric cluster is totally not connectable with a status saying “Upgrade service unreachable”. The funny thing is that the status was only shown after everything in the resource group is setup successfully which strangely took about one hour plus to finish. So I wasted about one hour for that. Hence, please use at least the recommended size for the VM.

service-fabric-step2-configure-cluster.png
We need to specify the VM spec for each of the node type.

A very interesting point to take note is that, there is a checkbox for us to configure advance settings for node type, as shown in the following screenshot. The default values here will affect things such as the Service Fabric dashboard URL we use later. It’s fine to leave them as default.

service-fabric-step2-configure-cluster-advance-settings.png
Default values in the advanced settings of node type.

Thirdly, we need to configure the security settings by specifying which Key Vault to use. If you don’t have any suitable key vault, then it will take about one minute to create a new key vault for you. After the new key vault is created, you may be prompted with an error stopping you to proceed, as shown in the following screenshot.

service-fabric-step3-configure-security-settings-error.png
New key vault created here by default is not enabled for deployment.

To fix the error, we first need to visit the Key Vaults page. After that, we need to find out the key vault we just created above. Then we proceed to tick the corresponding checkbox to enable the key vault access to Azure VM for deployment, as shown in the following screenshot.

service-fabric-step3-configure-key-vault.png
Enable it so that Azure VM can retrieve certificates stored as secret from the key vault.

Now, if we got back to the Step 3 of the service fabric cluster setup, we can get rid of the error message by re-selecting the key vault. After keying a certificate name, we will need to wait for 30 seconds for validation. Then we will be given a link to download our certificate for later use.

service-fabric-step4-download-cert.png
Let’s download the cert from here!

This marks the end of our service fabric cluster setup. What we need to do is just to click on the “Create” button.

The creation process took about 40 minutes to complete. It actually went through many stages which are better described in the article “Azure Service Fabric Cluster – Deployment Issues”, written by Cosmin Muscalu.

Step 4: Publish App from Visual Studio

After the service fabric cluster is done, we can proceed to publish our application to it.

In the Solution Explorer, we simply need to right-click on the Service Fabric project and choose Publish, as shown in the following image.

solution-explorer
Solution Explorer

A window will popup and prompt us that the Connection Endpoint is not valid, as shown below.

cannot-publish-to-server.png
Failed to connect to server and thus we cannot publish the app to Azure.

Now, according to the article from the link “How to configure secure connection”, we have to install the certificate that we downloaded earlier from Azure Portal in Step 2.

Since there is no password for the pfx file, we simply need to accept all default settings while importing the certificate.

Now if we go back to the Publish window, we will see a green tick icon appearing at the side of the Connection Endpoint. Now, we are good to proceed to do a publish. The deployment of a simple TCP Listener normally takes less than one minute to finish.

Step 5: Open Port Access

After the deployment is done, we need to open up the 9005 port that we specified above in Step 2. To do so, we need to visit the Load Balancer used by the service fabric cluster to add a new rule for the port 9005 to be accessible from public.

add-load-balancing-rule.png
Add a new load balancing rule for the service fabric.

The process of adding a new rule normally takes about three minutes to complete.

Please take note that we need to note down the Public IP Address of our load balancer as well.

load-balancer-public-ip-address.png
The Public IP Address of a load balancer can be found in its Overview panel.

Step 6: Open Up Service Fabric Explorer

Finally, we need to open up the Explorer for our service fabric cluster. To do so, we can retrieve the dashboard URL in the Overview panel of the service fabric cluster.

service-fabric-admin-dashboard.png
The Service Fabric Explorer URL is here.

To access the Explorer, we first need to select a certificate that we downloaded earlier to authenticate ourselves to the Explorer, as shown in the screenshot below.

select-certificate.png
Selecting a certificate on Google Chrome.

Step 7: Communicate with TCP Listener

Now, if we build a simple TCP client to talk to the server at the IP address of the load balancer that we noted down earlier, we can easily send and receive response from the server, as shown in the screenshot below.

tcp-client.png
Hooray, we receive the response from the application on Azure Service Fabric!

So yup, that’s all for a very simple TCP Listener which is hosted on Microsoft Azure.

I will continue to research more about this topic with my teammates so that I can find out more about this cool technology.