TCP Listener on Microsoft Azure with Service Fabric

azure-service-fabric-load-balancer.png

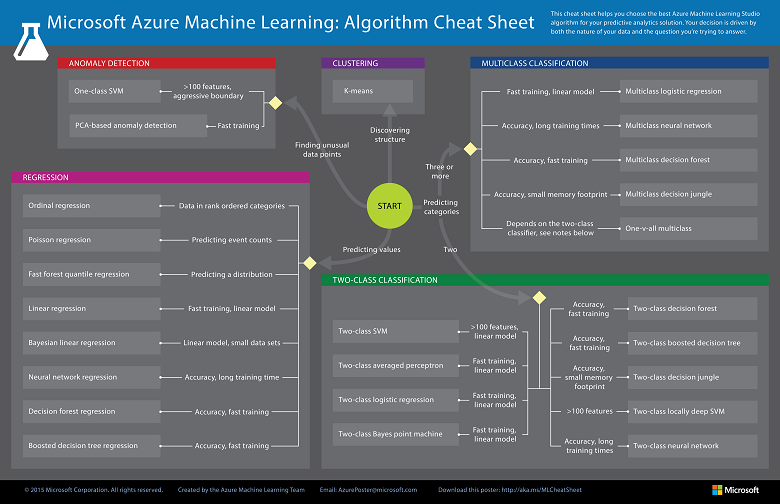
Getting TCP listener to run on Microsoft Azure is always an interesting topic to work on. Previously, I did one experimental TCP listener on Azure Cloud Service and it works quite well.

Today, I’d like to share with you my another experiment which is hosting a TCP Listener on Microsoft Azure with Service Fabric.

Step 0: Installing Service Fabric SDK

Most of the time, it’s better to run the Visual Studio 2017 in Administrator mode otherwise debugging and deployment of Service Fabric applications may have errors.

Before we can start a new Service Fabric application project on Visual Studio, we first need to make sure Service Fabric SDK is installed.

service-fabric-sdk-must-be-installed.png
Visual Studio will prompt us to install Service Fabric SDK.

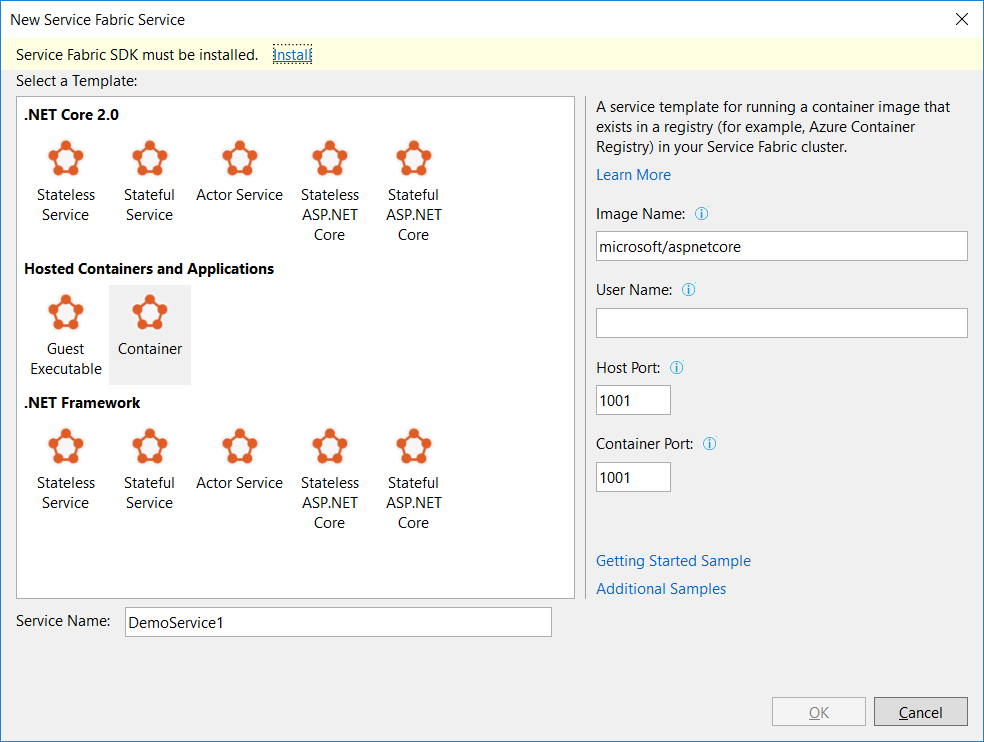
The template that I use is Stateless Service under .NET Core 2.0. This project template is to create a stateless reliable service with .NET Core.

Step 1: Add TCP Endpoint

In the ServiceManifest.xml of the PackageRoot folder of the application project, we need to specify an endpoint that our TCP Listener will be listening to. In my case, I am using port 9005. So I need to add an endpoint as shown below in the ServiceManifest.xml.

<Endpoint Name="TcpEndpoint" Protocol="tcp" Port="9005"/>

Step 2: Create Listeners

In the StatelessService class, there is a CreateServiceInstanceListeners method that we can override to create TCP listeners with the following codes.

protected override IEnumerable CreateServiceInstanceListeners()
{
    var endpoints = Context.CodePackageActivationContext.GetEndpoints()
        .Where(endpoint => endpoint.Protocol == EndpointProtocol.Tcp)
        .Select(endpoint => endpoint.Name);

    return endpoints.Select(endpoint => new ServiceInstanceListener(
        serviceContext => new TcpCommunicationListener(serviceContext, ServiceEventSource.Current, endpoint), endpoint));
}

Then in the RunAsync method, which is the main entry point for our service instance, we can simply include the code for TCP Listener to receive and send message to the clients.runasync.png

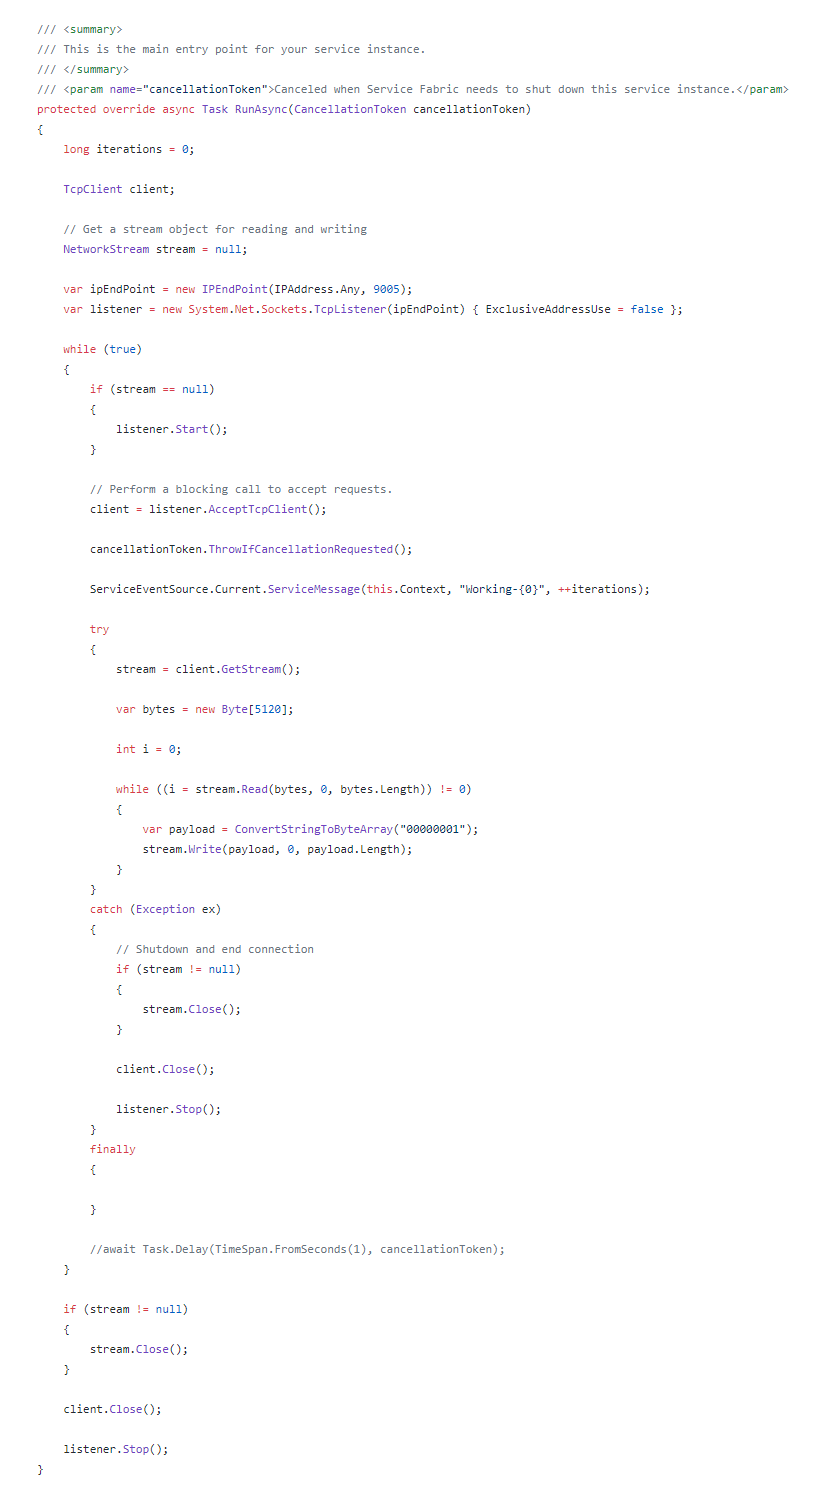
Step 3: Create Service Fabric Cluster


There are a few simple steps for us to follow in order to create a new Service Fabric cluster on Microsoft Azure.

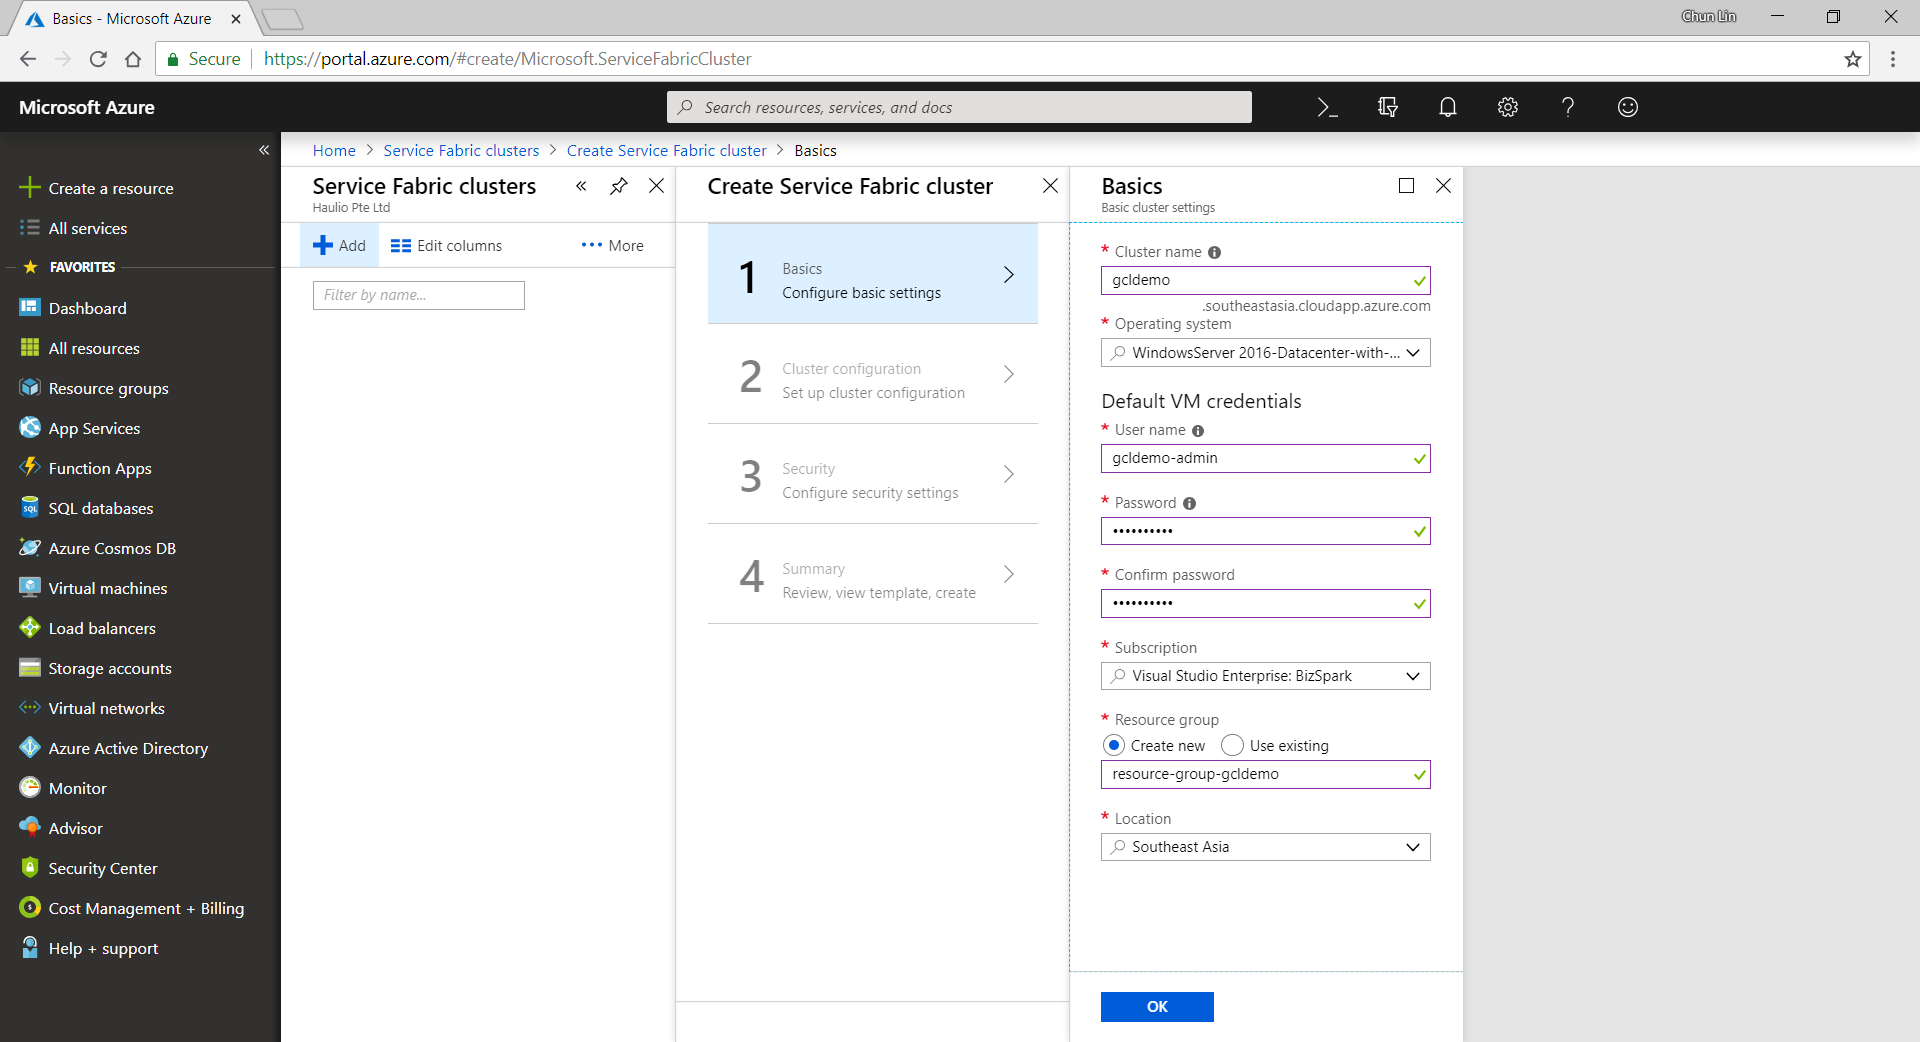
Firstly, we need to specify some basic information, such as cluster name, OS, and default VM credentials.

service-fabric-step1-configure-basic-settings.png
Configure basic settings for a new Azure Service Fabric cluster.

Secondly, we need to define Node Types. Node types can be seen as equivalent to the roles in Cloud Service. Node types define the VM sizes, the number of VMs, and their properties. Every node type that is defined in a Service Fabric cluster maps to a virtual machine scale set.

We can start with only one node type. The portal will then prompt us to select one VM size. By default, it only shows three recommended sizes. If you would like to find out more other specs with lower price, please click on “View All”.

I once use A0 (which coasted USD 14.88) for experimental purpose. However, it turns out that the newly created service fabric cluster is totally not connectable with a status saying “Upgrade service unreachable”. The funny thing is that the status was only shown after everything in the resource group is setup successfully which strangely took about one hour plus to finish. So I wasted about one hour for that. Hence, please use at least the recommended size for the VM.

service-fabric-step2-configure-cluster.png
We need to specify the VM spec for each of the node type.

A very interesting point to take note is that, there is a checkbox for us to configure advance settings for node type, as shown in the following screenshot. The default values here will affect things such as the Service Fabric dashboard URL we use later. It’s fine to leave them as default.

service-fabric-step2-configure-cluster-advance-settings.png
Default values in the advanced settings of node type.

Thirdly, we need to configure the security settings by specifying which Key Vault to use. If you don’t have any suitable key vault, then it will take about one minute to create a new key vault for you. After the new key vault is created, you may be prompted with an error stopping you to proceed, as shown in the following screenshot.

service-fabric-step3-configure-security-settings-error.png
New key vault created here by default is not enabled for deployment.

To fix the error, we first need to visit the Key Vaults page. After that, we need to find out the key vault we just created above. Then we proceed to tick the corresponding checkbox to enable the key vault access to Azure VM for deployment, as shown in the following screenshot.

service-fabric-step3-configure-key-vault.png
Enable it so that Azure VM can retrieve certificates stored as secret from the key vault.

Now, if we got back to the Step 3 of the service fabric cluster setup, we can get rid of the error message by re-selecting the key vault. After keying a certificate name, we will need to wait for 30 seconds for validation. Then we will be given a link to download our certificate for later use.

service-fabric-step4-download-cert.png
Let’s download the cert from here!

This marks the end of our service fabric cluster setup. What we need to do is just to click on the “Create” button.

The creation process took about 40 minutes to complete. It actually went through many stages which are better described in the article “Azure Service Fabric Cluster – Deployment Issues”, written by Cosmin Muscalu.

Step 4: Publish App from Visual Studio

After the service fabric cluster is done, we can proceed to publish our application to it.

In the Solution Explorer, we simply need to right-click on the Service Fabric project and choose Publish, as shown in the following image.

solution-explorer
Solution Explorer

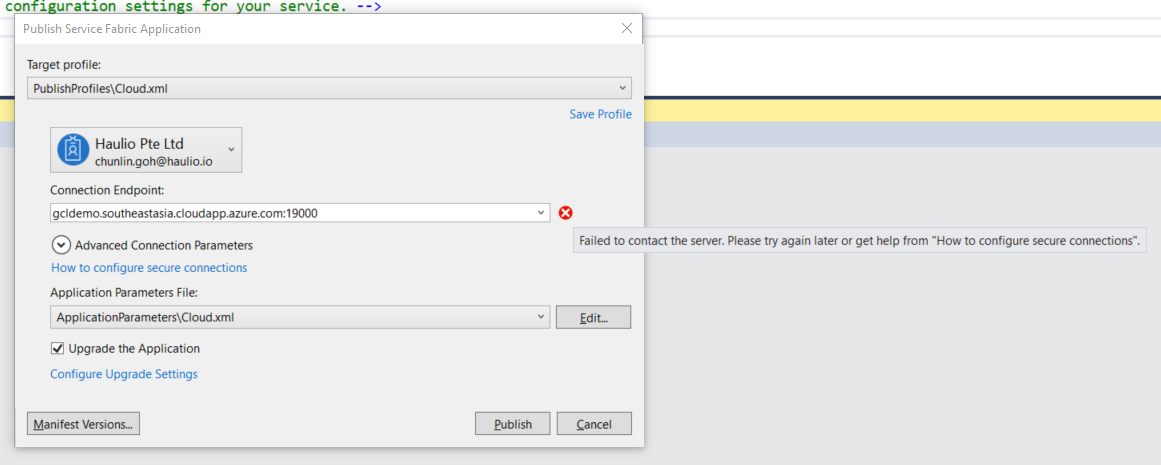
A window will popup and prompt us that the Connection Endpoint is not valid, as shown below.

cannot-publish-to-server.png
Failed to connect to server and thus we cannot publish the app to Azure.

Now, according to the article from the link “How to configure secure connection”, we have to install the certificate that we downloaded earlier from Azure Portal in Step 2.

Since there is no password for the pfx file, we simply need to accept all default settings while importing the certificate.

Now if we go back to the Publish window, we will see a green tick icon appearing at the side of the Connection Endpoint. Now, we are good to proceed to do a publish. The deployment of a simple TCP Listener normally takes less than one minute to finish.

Step 5: Open Port Access

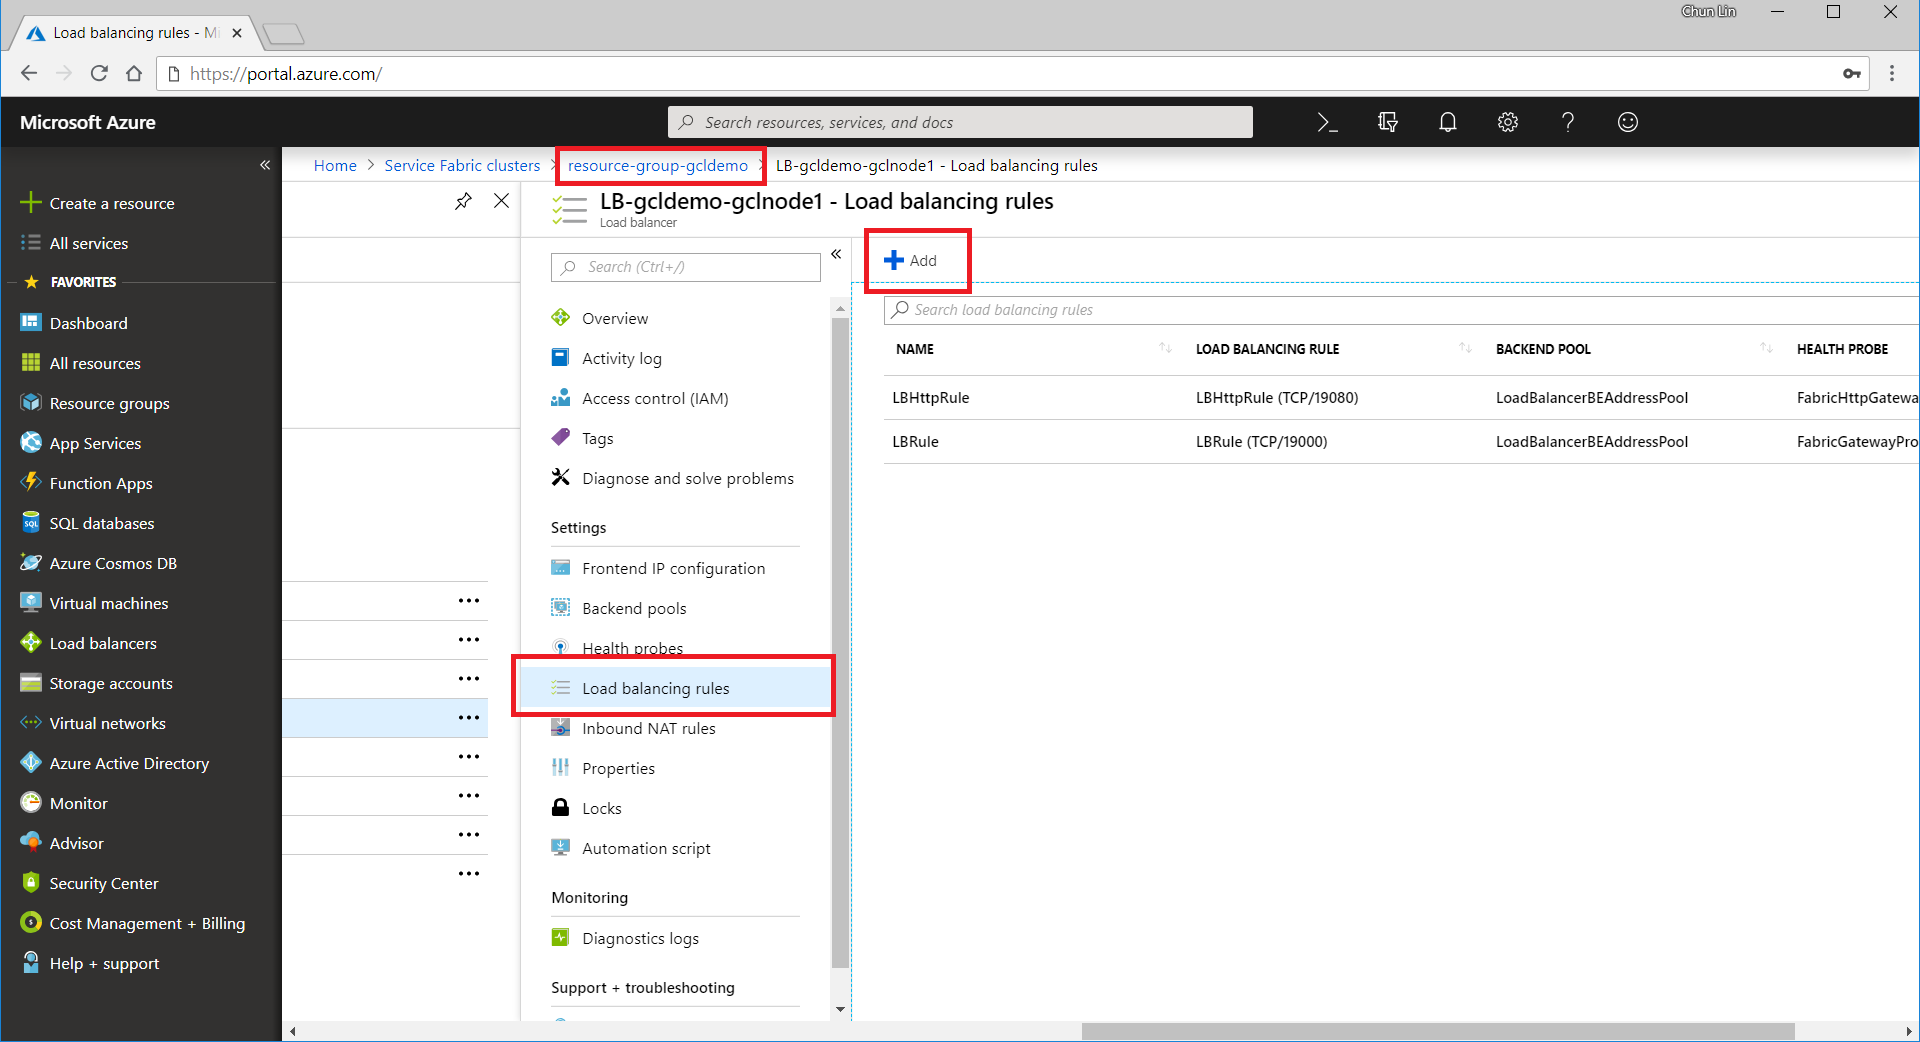
After the deployment is done, we need to open up the 9005 port that we specified above in Step 2. To do so, we need to visit the Load Balancer used by the service fabric cluster to add a new rule for the port 9005 to be accessible from public.

add-load-balancing-rule.png
Add a new load balancing rule for the service fabric.

The process of adding a new rule normally takes about three minutes to complete.

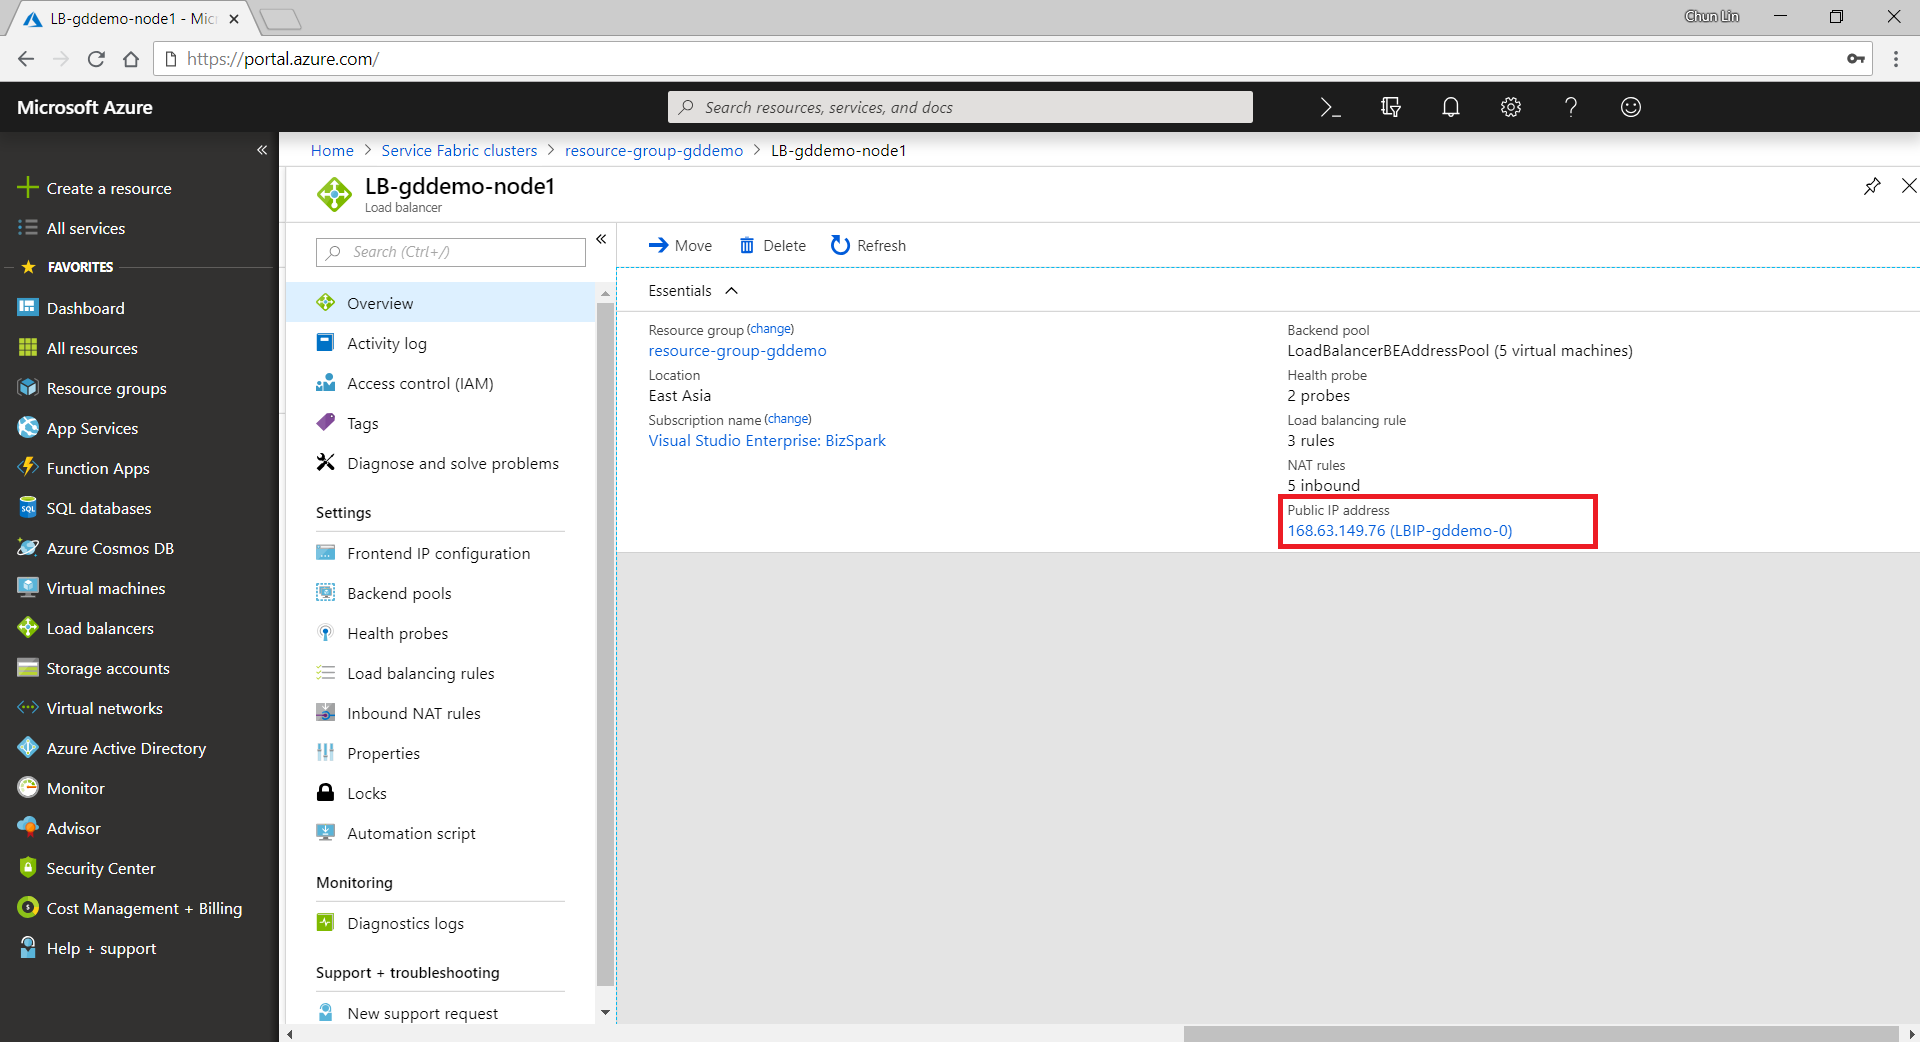
Please take note that we need to note down the Public IP Address of our load balancer as well.

load-balancer-public-ip-address.png
The Public IP Address of a load balancer can be found in its Overview panel.

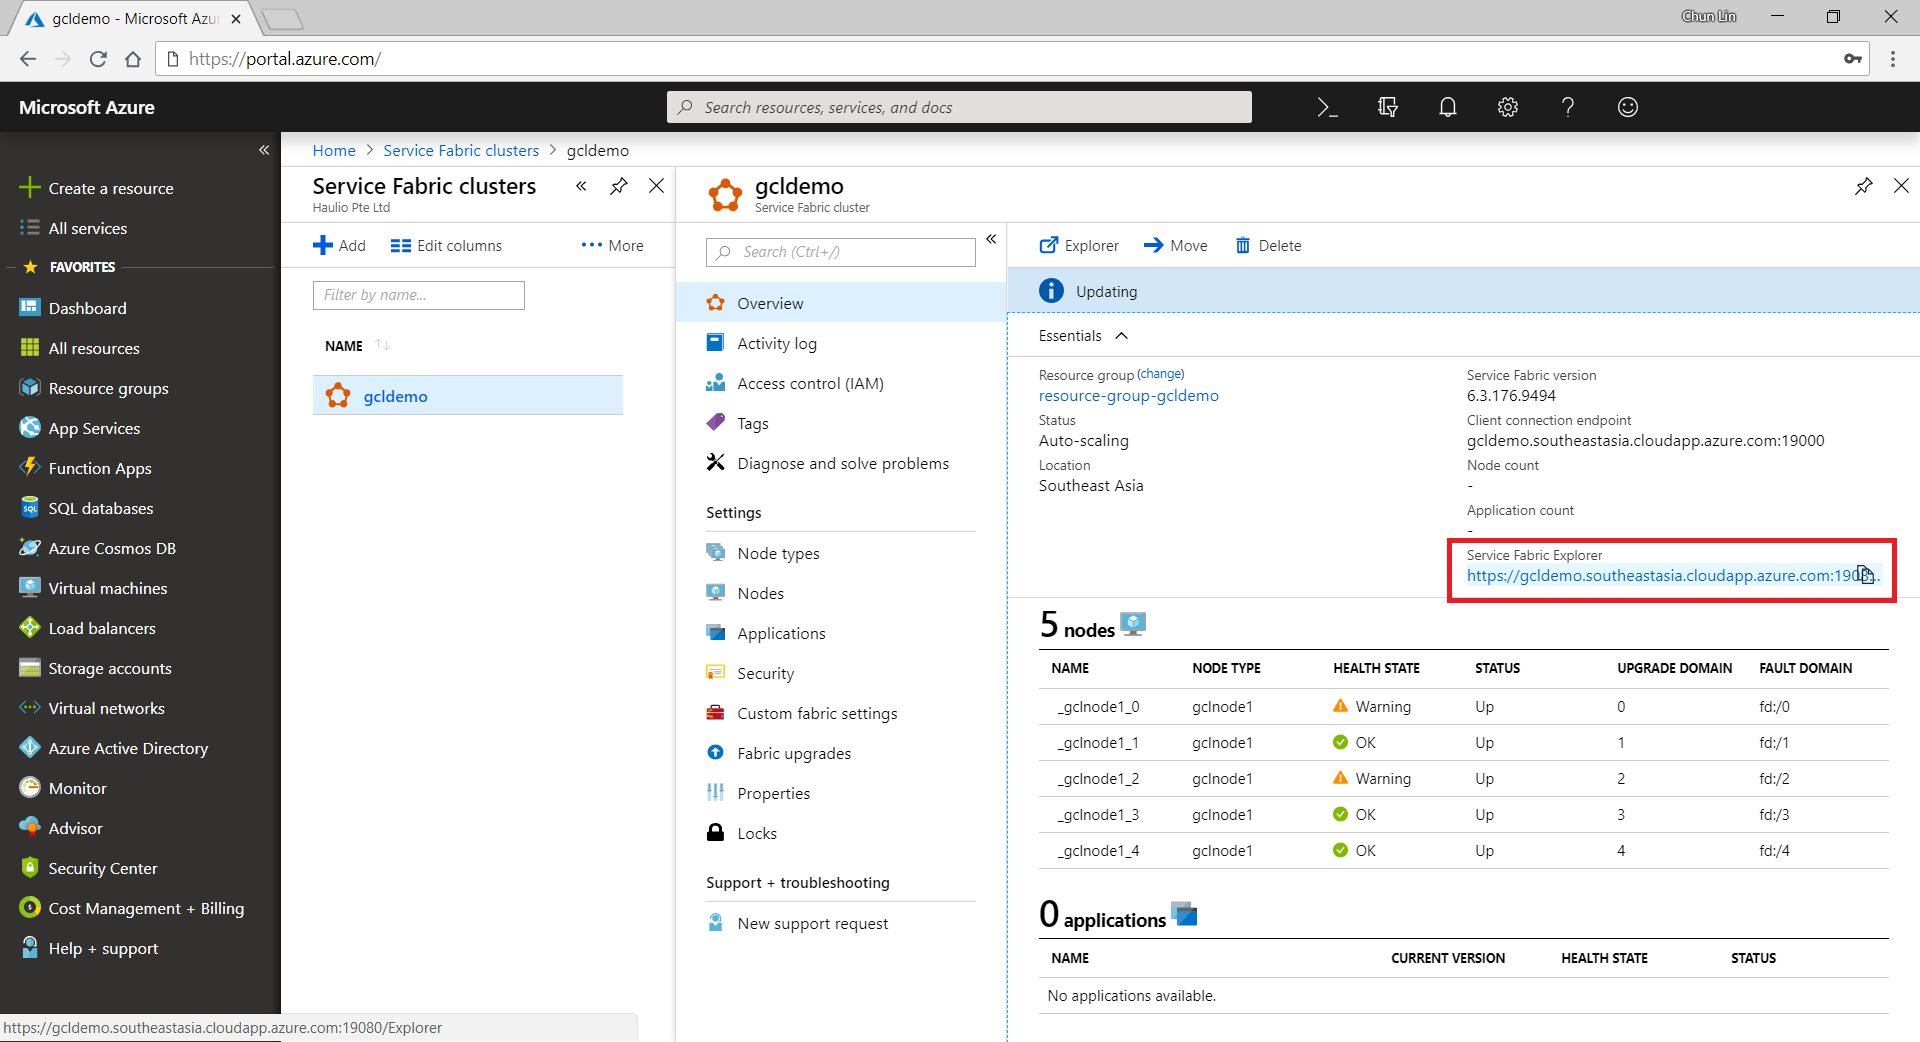
Step 6: Open Up Service Fabric Explorer

Finally, we need to open up the Explorer for our service fabric cluster. To do so, we can retrieve the dashboard URL in the Overview panel of the service fabric cluster.

service-fabric-admin-dashboard.png
The Service Fabric Explorer URL is here.

To access the Explorer, we first need to select a certificate that we downloaded earlier to authenticate ourselves to the Explorer, as shown in the screenshot below.

select-certificate.png
Selecting a certificate on Google Chrome.

Step 7: Communicate with TCP Listener

Now, if we build a simple TCP client to talk to the server at the IP address of the load balancer that we noted down earlier, we can easily send and receive response from the server, as shown in the screenshot below.

tcp-client.png
Hooray, we receive the response from the application on Azure Service Fabric!

So yup, that’s all for a very simple TCP Listener which is hosted on Microsoft Azure.

I will continue to research more about this topic with my teammates so that I can find out more about this cool technology.

[KOSD Series] Ready ML Tutorial One

kosd-azure-machine-learning.png

During the Labour Day holiday, I had a great evening chat with Marvin, my friend who had researched a lot about Artificial Intelligence and Machine Learning (ML). He guided me through steps setting up a simple ML experiment. Hence, I decided to note down what I had learned on that day.

The tool that we’re using is Azure Machine Learning Studio. What I had learned from Marvin is basically creating a ML experiment through drag-and-dropping modules and connecting them together. It may sound simple but for a beginner like me, it is still important to understand some key concepts and steps before continuing further in the ML field.

Azure ML Studio

Azure ML Studio is a tool for us to build, test, and deploy predictive analytics on our data. There is a detailed diagram about the capability of the tool, which can be downloaded here.

ml_studio_overview_v1.1.png
Capability of Azure ML Studio (Credits: Microsoft Azure Docs)

Step 0: Defining Problem

Before we began, we need to understand why we are using ML for?

Here, I’m helping a watermelon stall to predict how many watermelon they can sell this year based on last year sales data.

Step 1: Preparing Data

As shown in the diagram above, the first step is to import the data into the experiment. So, before we can even start, we need to make sure that we have at least a handful of data points.

data.png
Daily sales of the watermelon stall and the weather of the day.

Step 2: Importing Data to ML Studio

With the data points we now have, we then can import them to ML Studio as a Dataset.

datasets.png
Datasets available in Azure ML Studio.

Step 3: Preprocessing Data

Firstly, we need to perform a cleaning operation so that missing data can be handled properly without affecting our results later.

Secondly, we need to “Select Columns in Dataset” so that only selected columns will be used in the subsequent operations.

Step 4: Splitting Data

This step is to help us to separate data into training and testing sets.

Step 5: Choosing Learning Algorithm

Since we are now using the model to predict number of watermelons the stall can sell, which is a number, we’ll use Linear Regression algorithm, as recommended. There is a cheat sheet from Microsoft telling us which algorithm we need to choose based on different scenarios. You can also download it here.

machine-learning-algorithm-cheat-sheet-small_v_0_6-01.png
Learning algorithm cheat sheet. (Image Credits: Microsoft Docs)

Step 6: Partitioning and Sampling

Sampling is an important tool in machine learning because it reduces the size of a dataset while maintaining the same ratio of values. If we have a lot of data, we might want to use only the first n rows while setting up the experiment, and then switch to using the full dataset when you build our model.

Step 7: Training

After choosing the learning algorithm, it’s time for us to train the data.

Since we are going to predict the number of watermelons sold, we will select the column, as shown in the following screenshot.

train.png
Select the one column that we need to predict in Train Model module.

Step 8: Scoring

Do you still remember that we split our data into two sets in Step 4 above? Now, we need to connect output from Split Data module and output from Train Data module to the Score module as inputs. Doing this step is to score prediction for our regression model.

Step 9: Evaluating

We finally have to generate scores over our training data, and evaluate the model based on the scores.

Step 10: Deploying

Now that we’ve completed the experiment set up, we can deploy it as a predictive web service.

predictive-experiment.png
Generated predictive experiment.

With that deployed, we then can easily predict how many watermelons can be sold on a future date, as shown in the screenshot below.

testing.png
Yes, we can sell 25 watermelons on 7th May if the temperature is 32 degrees!

Conclusion


This is just the very beginning of setting up a ML experiment on Azure ML Studio. I am still very new to this AI and ML stuff. If you spot any problem in my notes above, please let me know. Thanks in advance!

References:


KOSD, or Kopi-O Siew Dai, is a type of Singapore coffee that I enjoy. It is basically a cup of coffee with a little bit of sugar. This series is meant to blog about technical knowledge that I gained while having a small cup of Kopi-O Siew Dai.

[KOSD Series] Azure App Service Diagnostics

kosd-app-service-diagnose.png

Last week, one of our web apps seemed to be running slow. Thus, we decided to diagnose the web app which was hosted on Azure App Service. Fortunately, there is a smart chatbot in Azure App Service that helps us to troubleshoot our web app.

The diagnostics chatbot can be found under “Diagnose and solve problems” page of the web app. The chatbot suggested that it can help us with checking the following issues.

  1. Web App Down;
  2. Web App Slow;
  3. High CPU Usage;
  4. High Memory Usage;
  5. Web App Restarted;
  6. TCP Connections.
diagnose-and-solve-problems
“Diagnose and solve problems” option is available under each Azure App Service.

In addition, it also provides a set of Diagnostic Tools for famous software stacks on Azure App Services, such as ASP .NET Core, ASP .NET, Java, and PHP.

diagnostic-tools.png
Available Diagnostics Tools for each of the software stack of the web app.

Health Checkup

The chatbot says quite many things in the first run. So if we continue to scroll down to the bottom, we will realize that the Diagnostics chatbot also recommends us to run a Health Checkup on our web app first to give us a summary about its requests, errors, performance, CPU usage, and memory usage.

For example, the following graph shows that my web app was experiencing HTTP server errors where a report about the errors was attached. In the report, it listed down errors happened during that period of time with affected URLs.

Sometimes, if there is a common solution available to the problems, troubleshooting steps will be listed down to help us to better fix the errors too.

requests-and-errors

The “App Performance” diagram basically shows us how much the server took to respond in the period of time. If the web app is performing slow, sometimes it will recommend us to collect a memory dump to identify the root cause of the issue.

The “CPU Usage” has diagram showing the overall CPU usage per instance. If there is any high CPU detected in the last 24 hours, there will be a warning displayed too.

For “Memory Usage” tab, it will provide us diagrams to show the following numbers.

  • Page Operations: A rate at which the disk was read to resolve hard page faults per second.
  • Overall Percent Physical Memory Usage: The overall percent memory in use by both system and the application on each instance.
  • Application Percent Physical Memory Usage: The percent physical memory usage of each application on an instance.
  • Committed Memory Usage: Amount of committed memory, in MB. Committed memory is the physical memory which has space reserved on the disk paging file(s).

TCP Connections Analysis

TCP Connections Analysis is one of the analysis that are not part of the Health Checkup. We can find it under “Availability & Performance” in the chatbot. It basically provides charts showing number of outbound TCP connections per instance in the period of time.

Is My App Restarted?

If we would like to find out if our web app was restarted in a period of time, we can click on the “Web App Restarted” button in the chatbot to find out when and why our web app is restarted.

reasons-for-your-web-app-restart.png
So yes, changing application settings will cause the web app to restart.

Connection Strings Checking


There is one more feature that I’d like to highlight is the diagnostic tool that helps to validate all the connection strings configured in our web app. It helps us to identify success vs. failing connection from the instance.

Conclusion

There are still more features available in the Azure App Service Diagnostics chatbot. I only list down features and tools that I use most in my daily development life. So, if you are also on your way to be DevOps, feel free to discover more yourself!

Reference


KOSD, or Kopi-O Siew Dai, is a type of Singapore coffee that I enjoy. It is basically a cup of coffee with a little bit of sugar. This series is meant to blog about technical knowledge that I gained while having a small cup of Kopi-O Siew Dai.

[KOSD Series] Read-only Users for Azure SQL Databases

kosd-azure-sql-ms-sql-server-management-studio.png

It’s quite common that Business Analyst will always ask for the permission to access the databases of our systems to do data analysis. However, most of the time we will only give them read-only access. With on-premise MS SQL Server and SQL Management Studio, it is quite easily done. However, how about for those databases hosted on Azure SQL?

Login as Server Admin

To make things simple, we will first login to the Azure SQL Server as Server admin on SQL Management Studio. The Server Admin name can be found easily on Azure Portal, as shown in the screenshot below. Its password will be the password we use when we create the SQL Server.

sql-server-admin.png
Identifying the Server Admin of an Azure SQL Server. (Source: Microsoft Azure Docs)

Create New Login

By default, the master database will be the default database in Azure SQL Server. So, once we have logged in, we simply create the read-only login using the following command.

CREATE LOGIN <new-login-id-here>
    WITH PASSWORD = '<password-for-the-new-login>' 
GO

Alternatively, we can also right-click on the “Logins” folder under “Security” then choose “New Login…”, as shown in the screenshot below. The same CREATE LOGIN command will be displayed.

new-login.png
Adding new login to the Azure SQL Server.

Create User

After the new login is created, we need to create a new user which is associated with it. The user needs to be created and granted read-only permission in each of the databases that the new login is allowed to access.

Firstly, we need to expand the “Databases” in the Object Explorer and then look for the databases that we would like to grant the new login the access to. After that, we right-click on the database and then choose “New Query”. This shall open up a new blank query window, as shown in the screenshot below.

new-query-to-create-user.png
Opening new query window for one of our databases.

Then we simply need to run the following query for the selected database in the query window.

CREATE USER <new-user-name-here> FROM LOGIN <new-login-id-here>;

Please remember to run this for the master database too. Otherwise we will not be able to login via SQL Management Studio at all with the new login because the master database is the default database.

Grant Read-only Permission

Now for this new user in the database, we need to give it a read-only permission. This can be done with the following command.

EXEC sp_addrolemember 'db_datareader', '<new-user-name-here>';

Conclusion

Repeat the two steps above for the remaining databases that we want the new login to have access to. Finally we will have a new login that can read from only selective databases on Azure SQL Server.

References


KOSD, or Kopi-O Siew Dai, is a type of Singapore coffee that I enjoy. It is basically a cup of coffee with a little bit of sugar. This series is meant to blog about technical knowledge that I gained while having a small cup of Kopi-O Siew Dai.