Let’s start with a problem that many of us in the systems engineering world have faced. You have a computationally intensive application such as a financial model, a scientific process, or in my case, a Discrete Event Simulation (DES). The code is correct, but it is slow.
In some DES problems, to get a statistically reliable answer, you cannot just run it once. You need to run it 5,000 times with different inputs, which is a massive parameter sweep combined with a Monte Carlo experiment to average out the randomness.
If you run this on your developer machine, it will finish in 2026. If you rent a single massive VM on cloud, you are burning money while one CPU core works and the others idle.
This is a brute-force computation problem. How do you solve it without rewriting your entire app? You build a simulation lab on Kubernetes. Here is the blueprint.
About Time
My specific app is a DES built with a C# library called SNA. In DES, the integrity of the entire system depends on a single, unified virtual clock and a centralised Future Event List (FEL). The core promise of the simulation engine is to process events one by one, in strict chronological order.
The FEL is a core component of a DES, which manages and schedules all future events that will occur in the simulation.
This creates an architectural barrier. You cannot simply chop a single simulation into pieces and run them on different pods on Kubernetes. Each pod has its own system clock, and network latency would destroy the causal chain of events. A single simulation run is, by its nature, an inherently single-threaded process.
We cannot parallelise the simulation, but we can parallelise the experiment.
This is what is known as an Embarrassingly Parallel problem. Since the multiple simulation runs do not need to talk to each other, we do not need a complex distributed system. We need an army of independent workers.
The Blueprint: The Simulation Lab
To solve this, I moved away from the idea of a “server” and toward the idea of a “lab”.
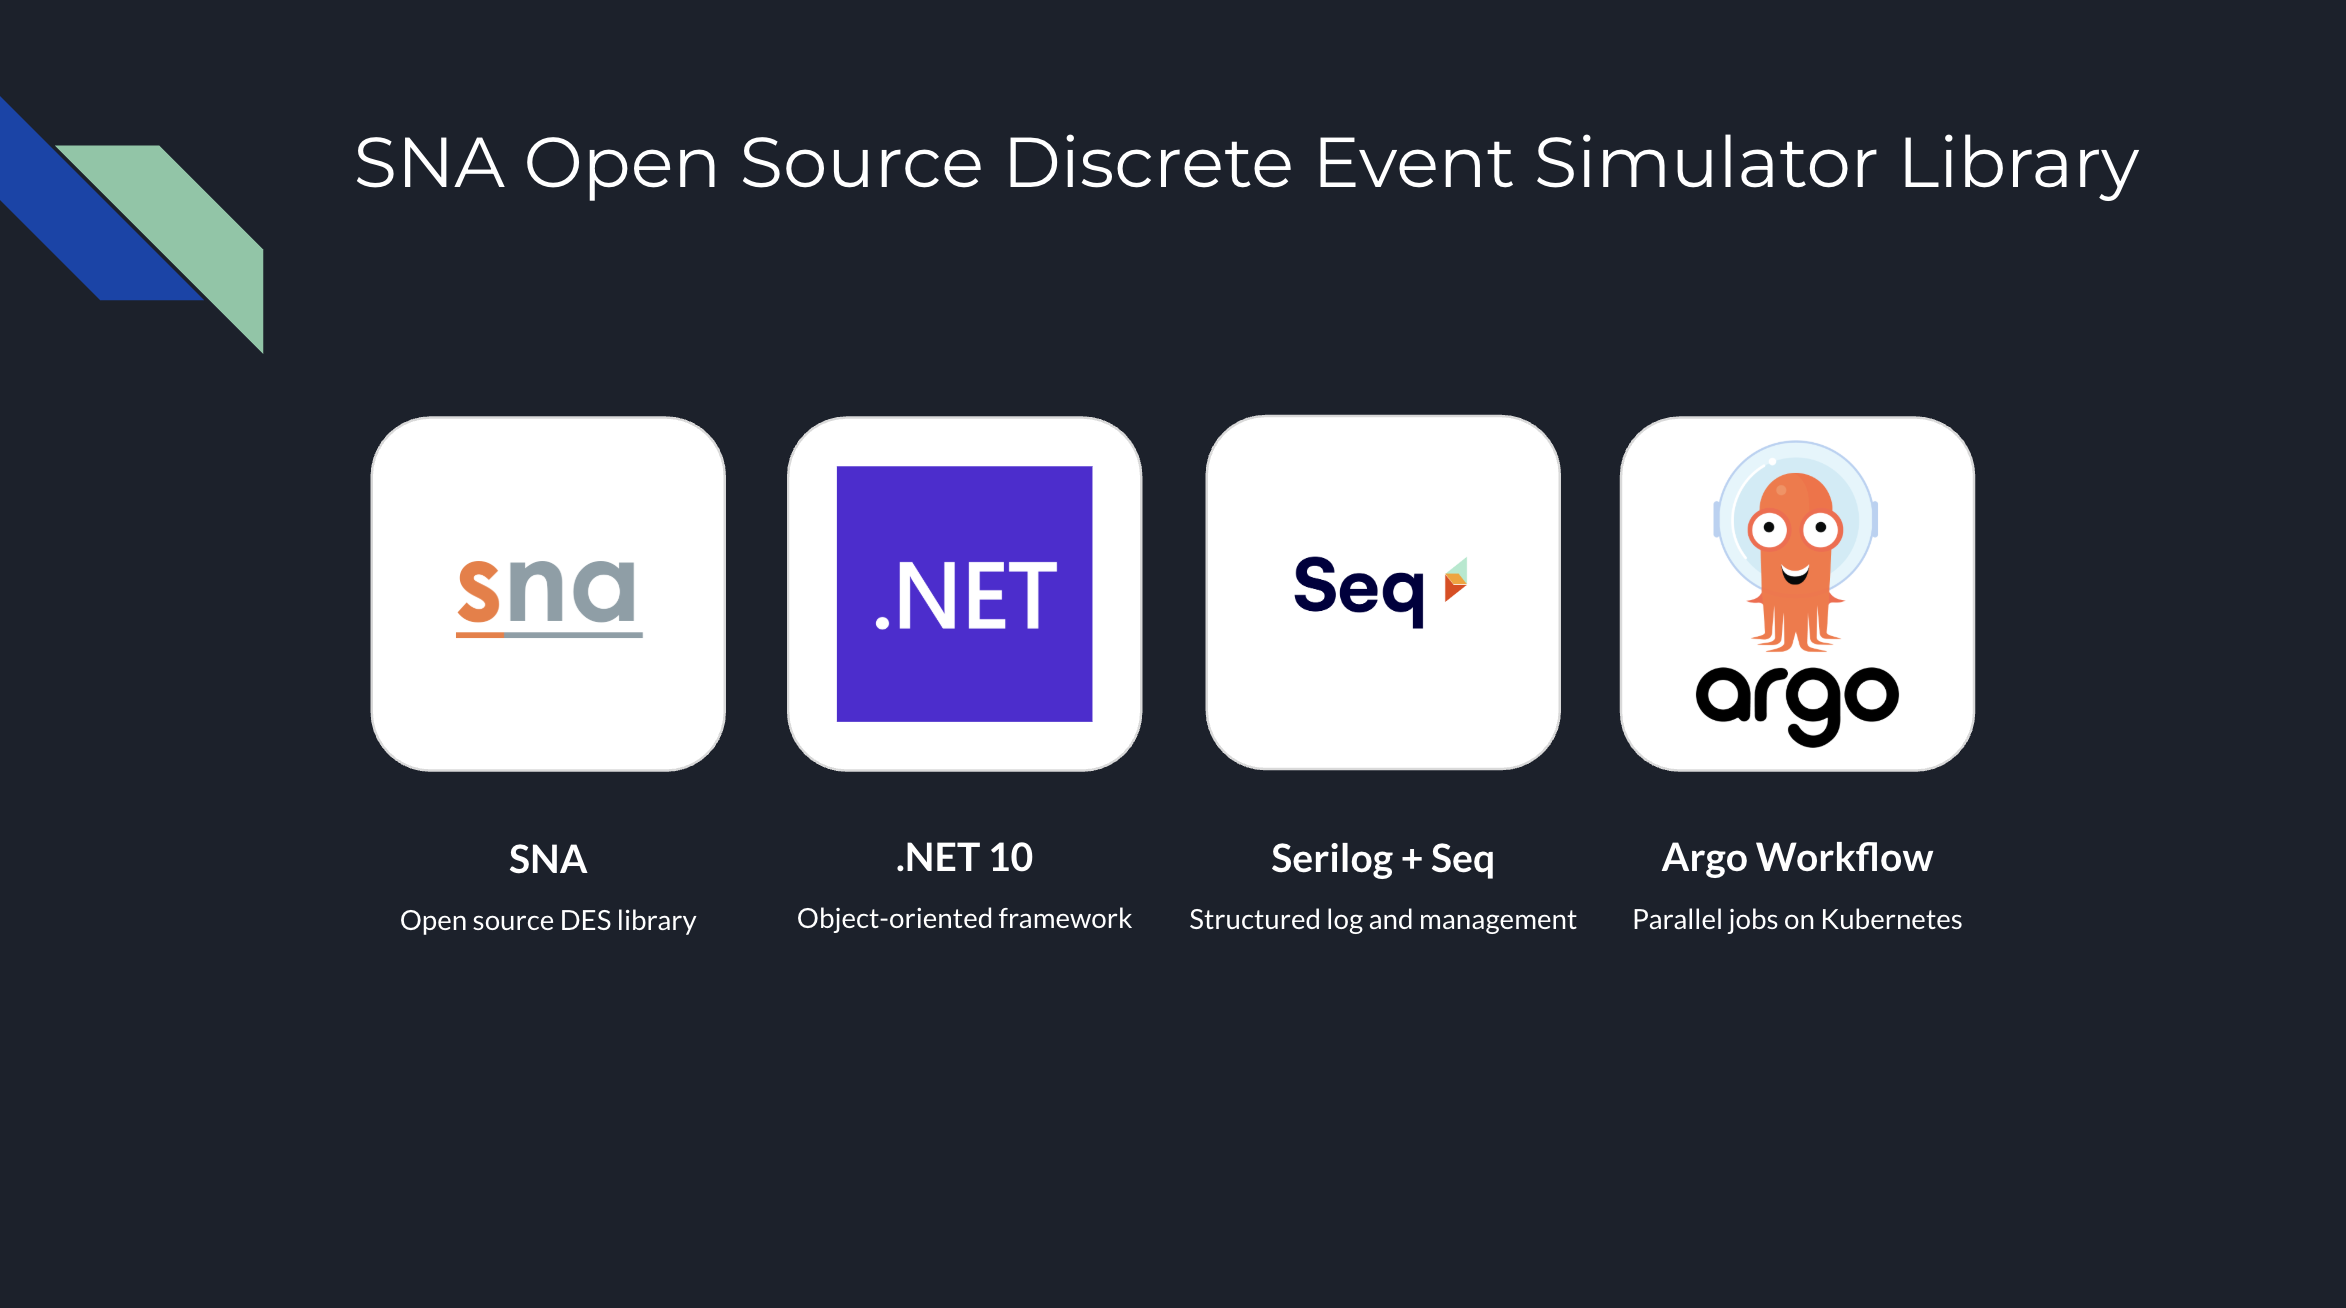
Our architecture has three components:
The Engine: A containerised .NET app that can run one full simulation and write its results as structured logs;
The Orchestrator: A system to manage the parameter sweep, scheduling thousands of simulation pods and ensuring they all run with unique inputs;
The Observatory: A centralised place to collect and analyse the structured results from the entire army of pods.
The Engine: Headless .NET
The foundation is a .NET console programme.
We use System.CommandLine to create a strict contract between the container and the orchestrator. We expose key variables of the simulation as CLI arguments, for example, arrival rates, resource counts, service times.
using System.CommandLine;
var rootCommand = new RootCommand { Description = "Discrete Event Simulation Demo CLI\n\n" + "Use 'demo <subcommand> --help' to view options for a specific demo.\n\n" + "Examples:\n" + " dotnet DemoApp.dll demo simple-generator\n" + " dotnet DemoApp.dll demo mmck --servers 3 --capacity 10 --arrival-secs 2.5" };
// Show help when run with no arguments if (args.Length == 0) { Console.WriteLine("No command provided. Showing help:\n"); rootCommand.Invoke("-h"); // Show help return 1; }
// ---- Demo: simple-server ---- var meanArrivalSecondsOption = new Option<double>( name: "--arrival-secs", description: "Mean arrival time in seconds.", getDefaultValue: () => 5.0 );
var simpleServerCommand = new Command("simple-server", "Run the SimpleServerAndGenerator demo"); simpleServerCommand.AddOption(meanArrivalSecondsOption);
var demoCommand = new Command("demo", "Run a simulation demo"); demoCommand.AddCommand(simpleServerCommand);
rootCommand.AddCommand(demoCommand);
return await rootCommand.InvokeAsync(args);
This console programme is then packaged into a Docker container. That’s it. The engine is complete.
The Orchestrator: Unleashing an Army with Argo Workflows
How do you manage a great number of pods without losing your mind?
My first attempt was using standard Kubernetes Jobs. Kubernetes Jobs are primitive, so they are hard to visualise, and managing retries or dependencies requires writing a lot of fragile bash scripts.
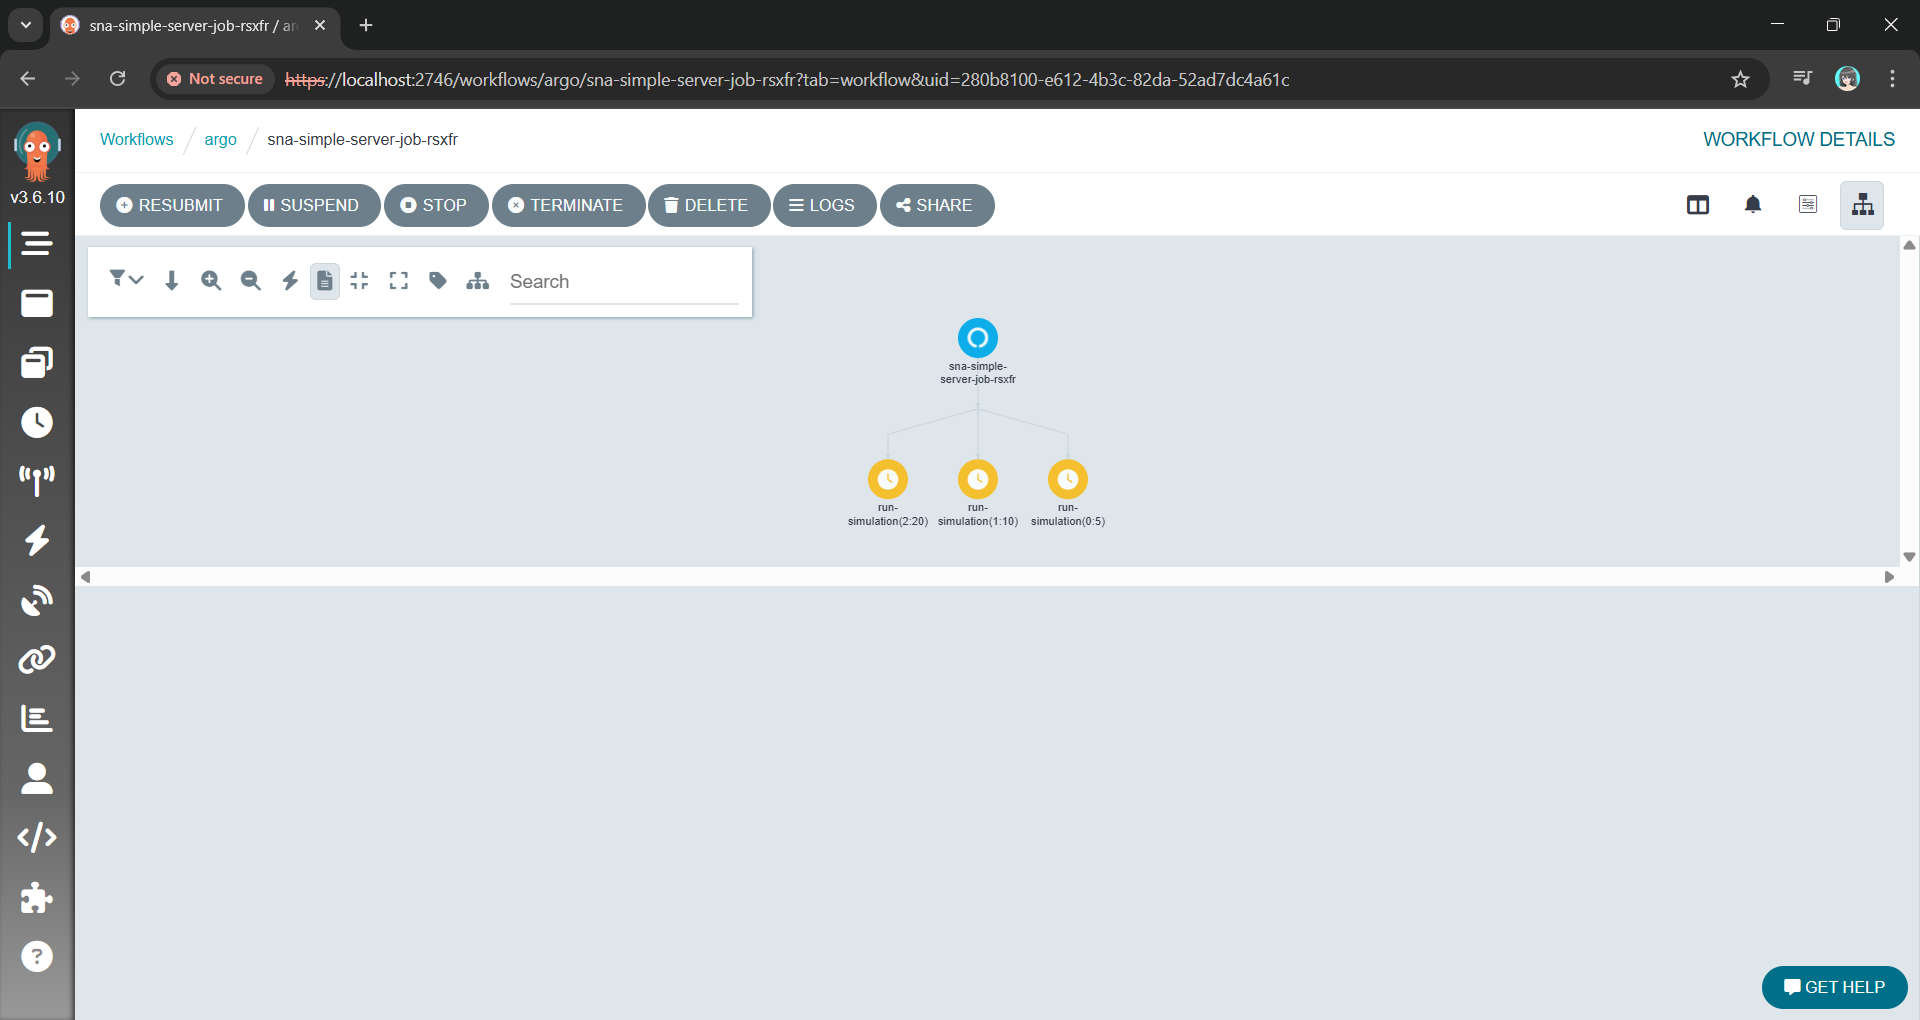
Argo allows us to define the entire parameter sweep as a single workflow object. The killer feature here is the withItems. Alternative, using withParam loop, we can feed Argo a JSON list of parameter combinations, and it handles the rest: Fan-out, throttling, concurrency control, and retries.
This YAML file is our lab manager. It can also be extended to support scheduling, retries, and parallelism, transforming a complex manual task into a single declarative manifest.
The Argo Workflow UI with the fan-out/parallel nodes using the YAML above.
Instead of managing pods, we are now managing a definition of an experiment.
The Observatory: Finding the Needle in a Thousand Haystacks
With a thousand pods running simultaneously, kubectl logs is useless. You are generating gigabytes of text per minute. If one simulation produces an anomaly, finding it in a text stream is impossible.
We solve this with Structured Logging.
By using Serilog, our .NET Engine does not just write text. Instead, it emits machine-readable events with key-value pairs for our parameters and results. Every log entry contains the input parameters (for example, { "WorkerCount": 5, "ServiceTime": 10 }) attached to the result.
These structured logs are sent directly to a centralised platform like Seq. Now, instead of a thousand messy log streams, we have a single, queryable database of our entire experiment results.
Viewing the structured log on Seq generated with Serilog.
Wrap-Up: A Reusable Pattern
This architecture allows us to treat the Kubernetes not just as a place to host websites, but as a massive, on-demand supercomputer.
By separating the Engine from the Orchestrator and the Observatory, we have taken a problem that was too slow for a single machine and solved it using the native strengths of the Kubernetes. We did not need to rewrite the core C# logic. Instead, we just needed to wrap it in a clean interface and unleash a container army to do the work.
The full source code for the SNA library and the Argo workflow examples can be found on GitHub: https://github.com/gcl-team/SNA
The turnout for my DES session in Taipei confirmed a growing hunger in our industry for proactive, simulation-driven approaches to engineering.
I just spent two days at the Hello World Dev Conference 2025 in Taipei, and beneath the hype around cloud and AI, I observed a single, unifying theme: The industry is desperately building tools to cope with a complexity crisis of its own making.
The agenda was a catalog of modern systems engineering challenges. The most valuable sessions were the “踩雷經驗” (landmine-stepping experiences), which offered hard-won lessons from the front lines.
A 2-day technical conference on AI, Kubernetes, and more!
However, these talks raised a more fundamental question for me. We are getting exceptionally good at building tools to detect and recover from failure but are we getting any better at preventing it?
This post is not a simple translation of a Mandarin-language Taiwan conference. It is my analysis of the patterns I observed. I have grouped the key talks I attended into three areas:
Cloud Native Infrastructure;
Reshaping Product Management and Engineering Productivity with AI;
Deep Dives into Advanced AI Engineering.
Feel free to choose to dive into the section that interests you most.
Session: Smart Pizza and Data Observability
This session was led by Shuhsi (林樹熙), a Data Engineering Manager at Micron. Micron needs no introduction, they are a massive player in the semiconductor industry, and their smart manufacturing facilities are a prime example of where data engineering is mission-critical.
Shuhsi’s talk, “Data Observability by OpenLineage,” started with a simple story he called the “Smart Pizza” anomaly.
He presented a scenario familiar to anyone in a data-intensive environment: A critical dashboard flatlines, and the next three hours are a chaotic hunt to find out why. In his “Smart Pizza” example, the culprit was a silent, upstream schema change.
Smart pizza dashboard anomaly.
His solution, OpenLineage, is a powerful framework for what we would call digital forensics. It is about building a perfect, queryable map of the crime scene after the crime has been committed. By creating a clear data lineage, it reduces the “Mean Time to Discovery” from hours of panic to minutes of analysis.
Let’s be clear: This is critical, valuable work. Like OpenTelemetry for applications, OpenLineage brings desperately needed order to the chaos of modern data pipelines.
It is a fundamentally reactive posture. It helps us find the bullet path through the body with incredible speed and precision. However, my main point is that our ultimate goal must be to predict the bullet trajectory before the trigger is pulled. Data lineage minimises downtime. My work with simulation, which will be explained in the next session, aims to prevent it entirely by modelling these complex systems to find the breaking points before they break.
Session: Automating a .NET Discrete Event Simulation on Kubernetes
My talk, “Simulation Lab on Kubernetes: Automating .NET Parameter Sweeps,” addressed the wall that every complex systems analysis eventually hits: Combinatorial explosion.
While the industry is focused on understanding past failures, my session is about building the Discrete Event Simulation (DES) engine that can calculate and prevent future ones.
A restaurant simulation game in Honkai Impact 3rd. (Source: 西琳 – YouTube)
To make this concrete, I used the analogy of a restaurant owner asking, “Should I add another table or hire another waiter?” The only way to answer this rigorously is to simulate thousands of possible futures. The math becomes brutal, fast: testing 50 different configurations with 100 statistical runs each requires 5,000 independent simulations. This is not a task for a single machine; it requires a computational army.
My solution is to treat Kubernetes not as a service host, but as a temporary, on-demand supercomputer. The strategy I presented had three core pillars:
Declarative Orchestration: The entire 5,000-run DES experiment is defined in a single, clean Argo Workflows manifest, transforming a potential scripting nightmare into a manageable, observable process.
Radical Isolation: Each DES run is containerised in its own pod, creating a perfectly clean and reproducible experimental environment.
Controlled Randomness: A robust seeding strategy is implemented to ensure that “random” events in our DES are statistically valid and comparable across the entire distributed system.
The turnout for my DES session confirmed a growing hunger in our industry for proactive, simulation-driven approaches to engineering.
The final takeaway was a strategic re-framing of a tool many of us already use. Kubernetes is more than a platform for web apps. It can also be a general-purpose compute engine capable of solving massive scientific and financial modelling problems. It is time we started using it as such.
Session: AI for BI
Denny’s (監舜儀) session on “AI for BI” illustrated a classic pain point: The bottleneck between business users who need data and the IT teams who provide it. The proposed solution was a natural language interface, the FineChatBI, a tool designed to sit on top of existing BI platforms to make querying existing data easier.
Denny is introducing AI for BI.
His core insight was that the tool is the easy part. The real work is in building the “underground root system” which includes the immense challenge of defining metrics, managing permissions, and untangling data semantics. Without this foundation, any AI is doomed to fail.
Getting the underground root system right is important for building AI projects.
This is a crucial step forward in making our organisations more data-driven. However, we must also be clear about what problem is being solved.
This is a system designed to provide perfect, instantaneous answers to the question, “What happened?”
My work, and the next category of even more complex AI, begins where this leaves off. It seeks to answer the far harder question: “What will happen if…?” Sharpening our view of the past is essential, but the ultimate strategic advantage lies in the ability to accurately simulate the future.
Session: The Impossibility of Modeling Human Productivity
The presented Jugg (劉兆恭) is a well-known agile coach and the organiser of Agile Tour Taiwan 2020. His talk, “An AI-Driven Journey of Agile Product Development – From Inspiration to Delivery,” was a masterclass in moving beyond vanity metrics to understand and truly improve engineering performance.
Jugg started with a graph that every engineering lead knows in their gut. As a company grows over time:
Business grow (purple line, up);
Software architecture and complexity grow (first blue line, up);
The number of developers increases (second blue line, up);
Expected R&D productivity should grow (green line, up);
But paradoxically, the actual R&D productivity often stagnates or even declines (red line, down).
Jugg provided a perfect analogue for the work I do. He tackled the classic productivity paradox: Why does output stagnate even as teams grow? He correctly diagnosed the problem as a failure of measurement and proposed the SPACE framework as a more holistic model for this incredibly complex human system.
He was, in essence, trying to answer the same class of question I do: “If we change an input variable (team process), how can we predict the output (productivity)?”
This is where the analogy becomes a powerful contrast. Jugg’s world of human systems is filled with messy, unpredictable variables. His solutions are frameworks and dashboards. They are the best tools we have for a system that resists precise calculation.
This session reinforced my conviction that simulation is the most powerful tool we have for predicting performance in the systems we can actually control: Our code and our infrastructure. We do not have to settle for dashboards that show us the past because we can build models that calculate the future.
Session: Building a Map of “What Is” with GraphRAG
The most technically demanding session came from Nils (劉岦崱), a Senior Data Scientist at Cathay Financial Holdings. He presented GraphRAG, a significant evolution beyond the “Naive RAG” most of us use today.
Nils is explaining what a Naive RAG is.
He argued compellingly that simple vector search fails because it ignores relationships. By chunking documents, we destroy the contextual links between concepts. GraphRAG solves this by transforming unstructured data into a structured knowledge graph: a web of nodes (entities) and edges (their relationships).
Enhancing RAG-based application accuracy by constructing and leveraging knowledge graphs (Image Credit: LangChain)
In essence, GraphRAG is a sophisticated tool for building a static map of a known world. It answers the question, “How are all the pieces in our universe connected right now?” For AI customer service, this is a game-changer, as it provides a rich, interconnected context for every query.
This means our data now has an explicit, queryable structure. So, the LLM gets a much richer, more coherent picture of the situation, allowing it to maintain context over long conversations and answer complex, multi-faceted questions.
This session was a brilliant reminder that all advanced AI is built on a foundation of rigorous data modelling.
However, a map, no matter how detailed, is still just a snapshot. It shows us the layout of the city, but it cannot tell us how the traffic will flow at 5 PM.
This is the critical distinction. GraphRAG creates a model of a system at rest and DES creates a model of a system in motion. One shows us the relationships while the other lets us press watch how those relationships evolve and interact over time under stress. GraphRAG is the anatomy chart and simulation is the stress test.
Session: Securing the AI Magic Pocket with LLM Guardrails
Nils from Cathay Financial Holdings returned to the stage for Day 2, and this time he tackled one of the most pressing issues in enterprise AI: Security. His talk “Enterprise-Grade LLM Guardrails and Prompt Hardening” was a masterclass in defensive design for AI systems.
What made the session truly brilliant was his central analogy. As he put it, an LLM is a lot like Doraemon: a super-intelligent, incredibly powerful assistant with a “magic pocket” of capabilities. It can solve almost any problem you give it. But, just like in the cartoon, if you give it vague, malicious, or poorly thought-out instructions, it can cause absolute chaos. For a bank, preventing that chaos is non-negotiable.
There are two lines of defence: Guardrails and Prompt Hardening. The core of the strategy lies in understanding two distinct but complementary approaches:
Guardrails (The Fortress): An external firewall of input filters and output validators;
Prompt Hardening (The Armour): Internal defences built into the prompt to resist manipulation.
This is an essential framework for any enterprise deploying LLMs. It represents the state-of-the-art in building static defences.
While necessary, this defensive posture raises another important question for a developers: How does the fortress behave under a full-scale siege?
A static set of rules can defend against known attack patterns. But what about the unknown unknowns? What about the second-order effects? Specifically:
Performance Under Attack: What is the latency cost of these five layers of validation when we are hit with 10,000 malicious requests per second? At what point does the defence itself become a denial-of-service vector?
Emergent Failures: When the system is under load and memory is constrained, does one of these guardrails fail in an unexpected way that creates a new vulnerability?
These are not questions a security checklist can answer. They can only be answered by a dynamic stress test. The X-Teaming Nils mentioned is a step in this direction, but a full-scale DES is the ultimate laboratory.
Neil’s techniques are a static set of rules designed to prevent failure. Simulation is a dynamic engine designed to induce failure in a controlled environment to understand a system true breaking points. He is building the armour while my work with DES is in building the testing grounds to see where that armour will break.
Session: Driving Multi-Task AI with a Flowchart in a Single Prompt
The final and most thought-provoking session was delivered by 尹相志, who presented a brilliant hack: Embedding a Mermaid flowchart directly into a prompt to force an LLM to execute a deterministic, multi-step process.
尹相志,數據決策股份有限公司技術長。
He provided a new way beyond the chaos of autonomous agents and the rigidity of external orchestrators like LangGraph. By teaching the LLM to read a flowchart, he effectively turns it into a reliable state machine executor. It is a masterful piece of engineering that imposes order on a probabilistic system.
Action Grounding Principles proposed by 相志.
What he has created is the perfect blueprint. It is a model of a process as it should run in a world with no friction, no delays, and no resource contention.
And in that, he revealed the final, critical gap in our industry thinking.
A blueprint is not a stress test. A flowchart cannot answer the questions that actually determine the success or failure of a system at scale:
What happens when 10,000 users try to execute this flowchart at once and they all hit the same database lock?
What is the cascading delay if one step in the flowchart has a 5% chance of timing out?
Where are the hidden queues and bottlenecks in this process?
His flowchart is the architect’s beautiful drawing of an airplane. A DES is the wind tunnel. It is the necessary, brutal encounter with reality that shows us where the blueprint will fail under stress.
The ability to define a process is the beginning. The ability to simulate that process under the chaotic conditions of the real world is the final, necessary step to building systems that don’t just look good on paper, but actually work.
Final Thoughts and Key Takeaways from Taipei
My two days at the Hello World Dev Conference were not a tour of technologies. In fact, they were a confirmation of a dangerous blind spot in our industry.
From what I observe, they build tools for digital forensics to map past failures. They sharpen their tools with AI to perfectly understand what just happened. They create knowledge graphs to model the systems at rest. They design perfect, deterministic blueprints for how AI processes should work.
These are all necessary and brilliant advancements in the art of mapmaking.
However, the critical, missing discipline is the one that asks not “What is the map?”, but “What will happen to the city during the hurricane?” The hard questions of latency under load, failures, and bottlenecks are not found on any of their map.
Our industry is full of brilliant mapmakers. The next frontier belongs to people who can model, simulate, and predict the behaviour of complex systems under stress, before the hurricane reaches.
Hello, Taipei. Taken from the window of the conference venue.
I am leaving Taipei with a notebook full of ideas, a deeper understanding of the challenges and solutions being pioneered by my peers in the Mandarin-speaking tech community, and a renewed sense of excitement for the future we are all building.
During the session, Mohammad L. U. Tanjim, the Product Manager of ApiDog, gave a detailed walkthrough of the API-First design and how Apidog can be used for this approach.
Apidog helps us to define, test, and document APIs in one place. Instead of manually writing Swagger docs and using API tool separately, ApiDog combines everything. This means frontend developers can get mock APIs instantly, and backend developers as well as QAs can get clear API specs with automatic testing support.
Hence, for the customised headless APIs, we will adopt an API-First design approach. This approach ensures clarity, consistency, and efficient collaboration between backend and frontend teams while reducing future rework.
By designing APIs upfront, we reduce the likelihood of frequent changes that disrupt development. It also ensures consistent API behaviour and better long-term maintainability.
For our frontend team, with a well-defined API specification, they can begin working with mock APIs, enabling parallel development. This eliminates dependencies where frontend work is blocked by backend completion.
For QA team, API spec will be important to them because it serve as a reference for automated testing. The QA engineers can validate API responses before implementation.
API Design Journey
In this article, we will embark on an API Design Journey by transforming a traditional travel agency in Singapore into an API-first system. To achieve this, we will use Apidog for API design and testing, and Orchard Core as a CMS to manage travel package information. Along the way, we will explore different considerations in API design, documentation, and integration to create a system that is both practical and scalable.
Many traditional travel agencies in Singapore still rely on manual processes. They store travel package details in spreadsheets, printed brochures, or even handwritten notes. This makes it challenging to update, search, and distribute information efficiently.
The reliance on physical posters and brochures of a travel agency is interesting in today’s digital age.
By introducing a headless CMS like Orchard Core, we can centralise travel package management while allowing different clients like mobile apps to access the data through APIs. This approach not only modernises the operations in the travel agency but also enables seamless integration with other systems.
API Design Journey 01: The Design Phase
Now that we understand the challenges of managing travel packages manually, we will build the API with Orchard Core to enable seamless access to travel package data.
Instead of jumping straight into coding, we will first focus on the design phase, ensuring that our API meets the business requirements. At this stage, we focus on designing endpoints, such as GET /api/v1/packages, to manage the travel packages. We also plan how we will structure the response.
Given the scope and complexity of a full travel package CMS, this article will focus on designing a subset of API endpoints, as shown in the screenshot below. This allows us to highlight essential design principles and approaches that can be applied across the entire API journey with Apidog.
Let’s start with eight simple endpoints.
For the first endpoint “Get all travel packages”, we design it with the following query parameters to support flexible and efficient result filtering, pagination, sorting, and text search. This approach ensures that users can easily retrieve and navigate through travel packages based on their specific needs and preferences.
GET /api/v1/packages?page=1&pageSize=20&sortBy=price&sortOrder=asc&destinationId=4&priceRange[min]=500&priceRange[max]=2000&rating=4&searchTerm=spa
Pasting the API path with query parameters to the Endpoint field will auto populate the Request Params section in Apidog.
Same with the request section, the Response also can be generated based on a sample JSON that we expect the endpoint to return, as shown in the following screenshot.
As shown in the Preview, the response structure can be derived from a sample JSON.
In the screenshot above, the field “description” is marked as optional because it is the only property that does not exist in all the other entry in “data”.
Besides the success status, we also need another important HTTP 400 status code which tells the client that something is wrong with their request.
By default, for generic error responses like HTTP 400, there are response components that we can directly use in Apidog.
The reason why we need HTTP 400 is that, instead of processing an invalid request and returning incorrect or unexpected results, our API should explicitly reject it, ensuring that the client knows what needs to be fixed. This improves both developer experience and API reliability.
After completing the endpoint for getting all travel packages, we also have another POST endpoint to search travel packages.
While GET is the standard method for retrieving data from an API, complex search queries involving multiple parameters, filters, or file uploads might require the use of a POST request. This is particularly true when dealing with advanced search forms or large amounts of data, which cannot be easily represented as URL query parameters. In these cases, POST allows us to send the parameters in the body of the request, ensuring the URL remains manageable and avoiding URL length limits.
For example, let’s assume this POST endpoint allows us to search for travel packages with the following body.
We can also easily generate the data schema for the body by pasting this JSON as example into Apidog, as shown in the screenshot below.
Setting up the data schema for the body of an HTTP POST request.
When making an HTTP POST request, the client sends data to the server. While JSON in the request body is common, there is also another format used in APIs, i.e. multipart/form-data (also known as form-data).
The form-data is used when the request body contains files, images, or binary data along with text fields. So, if our endpoint /api/v1/packages/{id}/reviews allows users to submit both text (review content and rating) and an image, using form-data is the best choice, as demonstrated in the following screenshot.
Setting up a request body which is multipart/form-data in Apidog.
API Design Journey 02: Prototyping with Mockups
When designing the API, it is common to debate, for example, whether reviews should be nested inside packages or treated as a separate resource. By using Apidog, we can quickly create mock APIs for both versions and tested how they would work in different use cases. This helps us make a data-driven decision instead of endless discussions.
A list of mock API URLs for our “Get all travel packages” endpoint.
Clicking on the “Request” button next to each of the mock API URL will bring us to the corresponding mock response, as shown in the following screenshot.
Default mock response for HTTP 200 of our first endpoint “Get all travel packages”.
As shown in the screenshot above, some values in the mock response are not making any sense, for example negative id and destinationId, rating which is supposed to be between 1 and 5, “East” as sorting direction, and so on. How could we fix them?
Firstly, we will set the id (and destinationId) to be any positive integer number starting from 1.
Setting id to be a positive integer number starting from 1.
Secondly, we update both the price and rating to be float. In the following screenshot, we specify that the rating can be any float from 1.0 to 5.0 with single fraction digit.
Apidog is able to generate an example based on our condition under “Preview”.
Finally, we will indicate that the sorting direction can only be either ASC or DESC, as shown in the following screenshot.
Configuring the possible value for the direction field.
With all the necessary mock values configuration, if we fetch the mock response again, we should be able to get a response with more reasonable values, as demonstrated in the screenshot below.
Now the mock response looks more reasonable.
With the mock APIs, our frontend developers will be able to start building UI components without waiting for the backend to be completed. Also, as shown above, a mock API responds instantly, unlike real APIs that depend on database queries, authentication, or network latency. This makes UI development and unit testing faster.
Speaking of testing, some test cases are difficult to create with a real API. For example, what if an API returns an error (500 Internal Server Error)? What if there are thousands of travel packages? With a mock API, we can control the responses and simulate rare cases easily.
For example, our travel package API allows admins to see all packages, including unpublished ones, while regular users only see public packages. We thus can setup in such a way that different bearer token will return different set of mock data.
We are setting up the endpoint to return drafts when a correct admin token is provided in the request header with Mock Expectation.
With Mock Expectation feature, Apidog can return custom responses based on request parameters as well. For instance, it can return normal packages when the destinationId is 1 and trigger an error when the destinationId is 2.
API Design Journey 03: Documenting Phase
With endpoints designed properly in earlier two phases, we can now proceed to create documentation which is offers a detailed explanation of the endpoints in our API. This documentation will include the information such as HTTP methods, request parameters, and response formats.
Fortunately, Apidog makes the documentation process smooth by integrating well within the API ecosystem. It also makes sharing easy, letting us export the documentation in formats like OpenAPI, HTML, and Markdown.
Apidog can export API spec in formats like OpenAPI, HTML, and Markdown.
We can also export our documentation on folder basis to OpenAPI Specification in Overview, as shown below.
Custom export configuration for OpenAPI Specification.
We can also export the data as an offline document. Just click on the “Open URL” or “Permalink” button to view the raw JSON/YAML content directly in the Internet browser. We then can place the raw content into the Swagger Editor to view the Swagger UI of our API, as demonstrated in the following screenshot.
The exported content from Apidog can be imported to Swagger Editor directly.
Let’s say now we need to share the documentation with our team, stakeholders, or even the public. Our documentation thus needs to be accessible and easy to navigate. That is where exporting to HTML or Markdown comes in handy.
Documentation is Markdown format, generated by Apidog.
Finally, Apidog also allows us to conveniently publish our API documentation as a webpage. There are two options: Quick Share, for sharing parts of the docs with collaborators, and Publish Docs, for making the full documentation publicly available.
Quick Share is great for API collaborators because we can set a password for access and define an expiration time for the shared documentation. If no expiration is set, the link stays active indefinitely.
API spec presented as a website and accessible by the collaborators. It also enables collaborators to generate client code for different languages.
API Design Journey 04: The Development Phase
With our API fully designed, mocked, and documented, it is time to bring it to life with actual code. Since we have already defined information such as the endpoints, request format, and response formats, implementation becomes much more straightforward. Now, let’s start building the backend to match our API specifications.
Orchard Core generally supports two main approaches for designing APIs, i.e. Headless and Decoupled.
In the headless approach, Orchard Core acts purely as a backend CMS, exposing content via APIs without a frontend. The frontend is built separately.
In the decoupled approach, Orchard Core still provides APIs like in the headless approach, but it also serves some frontend rendering. It is a hybrid approach because we use Razor Pages some parts of the UI are rendered by Orchard, while others rely on APIs.
So in fact, we can combine the good of both approaches so that we can build a customised headless APIs on Orchard Core using services like IOrchardHelper to fetch content dynamically and IContentManager to allow us full CRUD operations on content items. This is in fact the approach mentioned in the Orchard Core Basics Companion (OCBC) documentation.
For the endpoint of getting a list of travel packages, i.e. /api/v1/packages, we can define it as follows.
[ApiController]
[Route("api/v1/packages")]
public class PackageController(
    IOrchardHelper orchard,
    ...) : Controller
{
    [HttpGet]
    public async Task<IActionResult> GetTravelPackages()
    {
        var travelPackages = await orchard.QueryContentItemsAsync(q =>
            q.Where(c => c.ContentType == "TravelPackage"));

        ...

        return Ok(travelPackages);
    }

    ...
}
In the code above, we are using Orchard Core Headless CMS API and leveraging IOrchardHelper to query content items of type “TravelPackage”. We are then exposing a REST API (GET /api/v1/packages) that returns all travel packages stored as content items in the Orchard Core CMS.
API Design Journey 05: Testing of Actual Implementation
Let’s assume our Dev Server Base URL is localhost. This URL is set as a variable in the Develop Env, as shown in the screenshot below.
Setting Base URL for Develop Env on Apidog.
With the environment setup, we can now proceed to run our endpoint under that environment. As shown in the following screenshot, we are able to immediately validate the implementation of our endpoint.
Validated the GET endpoint under Develop Env.
The screenshot above shows that through API Validation Testing, the implementation of that endpoint has met all expected requirements.
API validation tests are not just for simple checks. The feature is great for handling complex, multi-step API workflows too. With them, we can chain multiple requests together, simulate real-world scenarios, and even run the same requests with different test data. This makes it easier to catch issues early and keep our API running smoothly.
Populate testing steps based on our API spec in Apidog.
In addition, we can also set up Scheduled Tasks, which is still in Beta now, to automatically run our test scenarios at specific times. This helps us monitor API performance, catch issues early, and ensure everything works as expected automatically. Plus, we can review the execution results to stay on top of any failures.
Result of running one of the endpoints on Develop Env.
Wrap-Up
Throughout this article, we have walked through the process of designing, mocking, documenting, implementing, and testing a headless API in Orchard Core using Apidog. By following an API-first approach, we ensure that our API is well-structured, easy to maintain, and developer-friendly.
With this approach, teams can collaborate more effectively, reduce friction in development. Now that the foundation is set, the next step could be integrating this API into a frontend app, optimising our API performance, or automating even more tests.
Finally, with .NET 9 moving away from built-in Swagger UI, developers now have to find alternatives to set up API documentation. As we can see, Apidog offers a powerful alternative, because it combines API design, testing, and documentation in one tool. It simplifies collaboration while ensuring a smooth API-first design approach.
On a chilly November morning, I attended the Google DevFest 2024 in Singapore. Together with my friends, we attended a workshop titled “Gemini Masterclass: How to Unlock Its Power with Prompting, Functions, and Agents.” The session was led by two incredible speakers, Martin Andrews and Sam Witteveen.
Martin, who holds a PhD in Machine Learning and has been an Open Source advocate since 1999. Sam is a Google Developer Expert in Machine Learning. Both of them are also organisers of the Machine Learning Singapore Meetup group. Together, they delivered an engaging and hands-on workshop about Gemini, the advanced LLM from Google.
Thanks to their engaging Gemini Masterclass, I have taken my first steps into the world of LLMs. This blog post captures what I learned and my journey into the fascinating world of Gemini.
Martin Andrews presenting in Google DevFest 2024 in Singapore.
About LLM and Gemini
LLM stands for Large Language Model. To most people, an LLM is like a smart friend who can answer almost all our questions with responses that are often accurate and helpful.
As a LLM, Gemini is trained on large amount of text data and can perform a wide range of tasks: answering questions, writing stories, summarising long documents, or even helping to debug code. What makes them special is their ability to “understand” and generate language in a way that feels natural to us.
Many of my developer friends have started using Gemini as a coding assistant in their IDEs. While it is good at that, Gemini is much more than just a coding tool.
Gemini is designed to not only respond to prompts but also act as an assistant with an extra set of tools. To make the most of Gemini, it is important to understand how it works and what it can (and cannot) do. With the knowledge gained from the DevFest workshop, I decided to explore how Gemini could assist with optimising relic choices in a game called Honkai: Star Rail.
Honkai: Star Rail and Gemini for Its Relic Recommendations
Honkai: Star Rail (HSR) is a popular RPG that has captured the attention of players worldwide. One of the key features of the game is its relic system, where players equip their characters with relics like hats, gloves, or boots to boost stats and unlock special abilities. Each relic has unique attributes, and selecting the right sets of relics for a character can make a huge difference in gameplay.
As a casual player, I often found myself overwhelmed by the number of options and the subtle synergies between different relic sets. Finding the good relic combination for each character was time-consuming.
This is where LLMs like Gemini come into play. With the ability to process and analyse complex data, Gemini can help players make smarter decisions.
In this blog post, I will briefly show how this Gemini-powered relic recommendation system can analyse a player’s current characters to suggest the best options for them. Then it will also explain the logic behind its recommendations, helping us to understand why certain relics are ideal.
Setup the Project
To make my project code available to everyone, I used Google Colab, a hosted Jupyter Notebook service that requires no setup to use and provides free access to computing resources, including GPUs and TPUs. You can access my code by clicking on the button below.
In my project, I used the google-generativeai Python library, which is pre-installed in Colab. This library serves as a user-friendly API for interacting with Google LLMs, including Gemini. It makes it easy for us to integrate Gemini capabilities directly into our code.
Next, we will need to import the necessary libraries.
Importing the libraries and setup Gemini client.
The first library to import is definitely the google.generativeai. Without it, we cannot interact with Gemini easily. Then we have google.colab.userdata which securely retrieves sensitive data, like our API key, directly from the Colab notebook environment.
We will also use IPython.display for displaying results in a readable format, such as Markdown.
HONKAI_STAR_RAIL_PLAYER_ID: Your HSR player UID. It is used later to personalise relic recommendations.
GOOGLE_API_KEY: The API key that we can get from Google AI Studio to authenticate with Gemini.
Creating and retrieving our API keys in Google AI Studio.
Once we have initialised the google.generativeai library with the GOOGLE_API_KEY, we can proceed to specify the Gemini model we will be using.
The choice of model is crucial in LLM projects. Google AI Studio offers several options, each representing a trade-off between accuracy and cost. For my project, I choose models/gemini-1.5-flash-8b-001, which provided a good balance for this experiment. Larger models might offer slightly better accuracy but at a significant cost increase.
Google AI Studio offers a range of models, from smaller, faster models suitable for quick tasks to larger, more powerful models capable of more complex processing.
Hallucination and Knowledge Limitation
We often think of LLMs like Gemini as our smart friends who can answer any question. But just like even our smartest friend can sometimes make mistakes, LLMs have their limits too.
Gemini knowledge is based on the data it was trained on, which means it doesn’t actually know everything. Sometimes, it might hallucinate, i.e. model invents information that sounds plausible but not actually true.
Kiana is not a character from Honkai: Star Rail but she is from another game called Honkai Impact 3rd.
While Gemini is trained on a massive dataset, its knowledge is not unlimited. As a responsible AI, it acknowledges its limitations. So, when it cannot find the answer, it will tell us that it lacks the necessary information rather than fabricating a response. This is how Google builds safer AI systems, as part of its Secure AI Framework (SAIF).
Knowledge cutoff in action.
To overcome these constraints, we need to employ strategies to augment the capabilities of LLMs. Techniques such as integrating Retrieval-Augmented Generation (RAG) and leveraging external APIs can help bridge the gap between what the model knows and what it needs to know to perform effectively.
System Instructions
Leveraging System Instructions is a way to improve the accuracy and reliability of Gemini responses.
System instructions are prompts given before the main query in order to guide Gemini. These instructions provide crucial context and constraints, significantly enhancing the accuracy and reliability of the generated output.
System Instruction with contextual information about HSR characters ensures Gemini has the necessary background knowledge.
The specific design and phrasing of the system instructions provided to the Gemini is crucial. Effective system instructions provide Gemini with the necessary context and constraints to generate accurate and relevant responses. Without carefully crafted system instructions, even the most well-designed prompt can yield poor results.
Context Framing
As we can see from the example above, writing clear and effective system instructions requires careful thought and a lot of testing.
This is just one part of a much bigger picture called Context Framing, which includes preparing data, creating embeddings, and deciding how the system retrieves and uses that data. Each of these steps needs expertise and planning to make sure the solution works well in real-world scenarios.
You might have heard the term “Prompt Engineering,” and it sounds kind of technical, but it is really about figuring out how to ask the LLM the right questions in the right way to get the best answers from an LLM.
While context framing and prompt engineering are closely related and often overlap, they emphasise different aspects of the interaction with the LLM.
Stochasticity
While experimenting with Gemini, I noticed that even if I use the exact same prompt, the output can vary slightly each time. This happens because LLMs like Gemini have a built-in element of randomness , known as Stochasticity.
Lingsha, an HSR character released in 2024. (Image Credit: Game8)
For example, when querying for DPS characters, Lingsha was inconsistently included in the results. While this might seem like a minor variation, it underscores the probabilistic nature of LLM outputs and suggests that running multiple queries might be needed to obtain a more reliable consensus.
Lingsha was inconsistently included in the response to the query about multi-target DPS characters.
According to the official announcement, even though Lingsha is a healer, she can cause significant damage to all enemies too. (Image Source: Honkai: Star Rail YouTube)
Hence, it is important to treat writing efficient system instruction and prompt as iterative processes. so that we can experiment with different phrasings to find what works best and yields the most consistent results.
Temperature Tuning
We can also reduce the stochasticity of Gemini response through adjusting parameters like temperature. Lower temperatures typically reduce randomness, leading to more consistent outputs, but also may reduce creativity and diversity.
Temperature is an important parameter for balancing predictability and diversity in the output. Temperature, a number in the range of 0.0 to 2.0 with default to be 1.0 in gemini-1.5-flash model, indicates the probability distribution over the vocabulary in the model when generating text. Hence, a lower temperature makes the model more likely to select words with higher probabilities, resulting in more predictable and focused text.
Having Temperature=0 means that the model will always select the most likely word at each step. The output will be highly deterministic and repetitive.
Function Calls
A major limitation of using system instructions alone is their static nature.
For example, my initial system instructions included a list of HSR characters, but this list is static. The list does not include newly released characters or characters specific to the player’s account. In order to dynamically access a player’s character database and provide personalised recommendations, I integrated Function Calls to retrieve real-time data.
For fetching the player’s HSR character data, I leveraged the open-source Python library mihomo. This library provides an interface for accessing game data, enabling dynamic retrieval of a player’s characters and their attributes. This dynamic data retrieval is crucial for generating truly personalised relic recommendations.
Using the mihomo library, I retrieve five of my Starfaring Companions.
Defining the functions in my Python code was only the first step. To use function calls, Gemini needed to know which functions were available. We can provide this information to Gemini as shown below.
model = genai.GenerativeModel('models/gemini-1.5-flash-8b-001', tools=[get_player_name, get_player_starfaring_companions])
The correct function call is picked up by Gemini based on the prompt.
Using descriptive function names is essential for successful function calling with LLMs because the accuracy of function calls depends heavily on well-designed function names in our Python code. Inaccurate naming can directly impact the reliability of the entire system.
If our Python function is named incorrectly, for example, calling a function get_age but it returns the name of the person, Gemini might select that function wrongly when the prompt is asking for age.
After Gemini telling us which function to call, our code needs to call the function to get the result.
Grounding with Google Search
Function calls are a powerful way to access external data, but they require pre-defined functions and APIs.
To go beyond these limits and gather information from many online sources, we can use Gemini grounding feature with Google Search. This feature allows Gemini to google and include what it finds in its answers. This makes it easier to get up-to-date information and handle questions that need real-time data.
If you are getting the HTTP 429 errors when using the Google Search feature, please make sure you have setup a billing account here with enough quota.
With this feature enabled, we thus can ask Gemini to get some real-time data from the Internet, as shown below.
The upcoming v2.7 patch of HSR is indeed scheduled to be released on 4th December.
Building a Semantic Knowledge Base with Pinecone
System instructions and Google search grounding provide valuable context, but a structured knowledge base is needed to handle the extensive data about HSR relics.
Having explored system instructions and Google search grounding, the next challenge is to manage the extensive data about HSR relics. We need a way to store and quickly retrieve this information, enabling the system to generate timely and accurate relic recommendations. Thus we will need to use a vector database ideally suited for managing the vast dataset of relic information.
Vector databases, unlike traditional databases that rely on keyword matching, store information as vectors enabling efficient similarity searches. This allows for retrieving relevant relic sets based on the semantic meaning of a query, rather than relying solely on keywords.
There are many options for vector database, but I choose Pinecone. Pinecone, a managed service, offered the scalability needed to handle the HSR relic dataset and the robust API essential for reliable data access. Its availability of a free tier is also a significant factor because it allows me to keep costs low during the development of my project.
API keys in Pinecone dashboard.
Pinecone’s well-documented API and straightforward SDK make integration surprisingly easy. To get started, simply follow the Pinecone documentation to install the SDK in our code and retrieve the API key.
# Import the Pinecone library
from pinecone.grpc import PineconeGRPC as Pinecone
from pinecone import ServerlessSpec
import time

# Initialize a Pinecone client with your API key
pc = Pinecone(api_key=userdata.get('PINECONE_API_KEY'))
I prepare my Honkai: Star Rail relic data, which I have previously organised into a JSON structure. This data includes information on each relic set’s two-piece and four-piece effects. Here’s a snippet to illustrate the format:
[
  {
    "name": "Sacerdos' Relived Ordeal",
    "two_piece": "Increases SPD by 6%",
    "four_piece": "When using Skill or Ultimate on one ally target, increases the ability-using target's CRIT DMG by 18%, lasting for 2 turn(s). This effect can stack up to 2 time(s)."
  },
  {
    "name": "Scholar Lost in Erudition",
    "two_piece": "Increases CRIT Rate by 8%",
    "four_piece": "Increases DMG dealt by Ultimate and Skill by 20%. After using Ultimate, additionally increases the DMG dealt by the next Skill by 25%."
  },
  ...
]
With the relic data organised in Pinecone, the next challenge is to enable similarity searches with vector embedding. Vector embedding captures the semantic meaning of the text, allowing Pinecone to identify similar relic sets based on their inherent properties and characteristics.
Now, we can generate vector embeddings for the HSR relic data using Pinecone. The following code snippet illustrates this process which is to convert textual descriptions of relic sets into numerical vector embeddings. These embeddings capture the semantic meaning of the relic set descriptions, enabling efficient similarity searches later.
# Load relic set data from the JSON file with open('/content/hsr-relics.json', 'r') as f: relic_data = json.load(f)
# Prepare data for Pinecone relic_info_data = [ {"id": relic['name'], "text": relic['two_piece'] + " " + relic['four_piece']} # Combine relic set descriptions for relic in relic_data ]
# Generate embeddings using Pinecone embeddings = pc.inference.embed( model="multilingual-e5-large", inputs=[d['text'] for d in relic_info_data], parameters={"input_type": "passage", "truncate": "END"} )
Pinecone ability to perform fast similarity searches relies on its indexing mechanism. Without an index, searching for similar relic sets would require comparing each relic set’s embedding vector to every other one, which would be extremely slow, especially with a large dataset. I choose Pinecone serverless index hosted on AWS for its automatic scaling and reduced infrastructure management.
# Create a serverless index
index_name = "hsr-relics-index"

if not pc.has_index(index_name):
    pc.create_index(
        name=index_name,
        dimension=1024,
        metric="cosine",
        spec=ServerlessSpec(
            cloud='aws',
            region='us-east-1'
        )
    )

# Wait for the index to be ready
while not pc.describe_index(index_name).status['ready']:
    time.sleep(1)
The dimension parameter specifies the dimensionality of the vector embeddings. Higher dimensionality generally allows for capturing more nuanced relationships between data points. For example, two relic sets might both increase ATK, but one might also increase SPD while the other increases Crit DMG. A higher-dimensional embedding allows the system to capture these subtle distinctions, leading to more relevant recommendations.
For the metric parameter which measures the similarity between two vectors (representing relic sets), we use the cosine metric which is suitable for measuring the similarity between vector embeddings generated from text. This is crucial for understanding how similar two relic descriptions are.
With the vector embeddings generated, the next step was to upload them into my Pinecone index. Pinecone uses the upsert function to add or update vectors in the index. The following code snippet shows how we can upsert the generated embeddings into the Pinecone index.
# Target the index where you'll store the vector embeddings
index = pc.Index("hsr-relics-index")

# Prepare the records for upsert
# Each contains an 'id', the embedding 'values', and the original text as 'metadata'
records = []
for r, e in zip(relic_info_data, embeddings):
    records.append({
        "id": r['id'],
        "values": e['values'],
        "metadata": {'text': r['text']}
    })

# Upsert the records into the index
index.upsert(
    vectors=records,
    namespace="hsr-relics-namespace"
)
The code uses the zip function to iterate through both the list of prepared relic data and the list of generated embeddings simultaneously. For each pair, it creates a record for Pinecone with the following attributes.
id: Name of the relic set to ensure uniqueness;
values: The vector representing the semantic meaning of the relic set effects;
metadata: The original description of the relic effects, which will be used later for providing context to the user’s recommendations.
Implementing Similarity Search in Pinecone
With the relic data stored in Pinecone now, we can proceed to implement the similarity search functionality.
def query_pinecone(query: str) -> dict:

  # Convert the query into a numerical vector that Pinecone can search with
  query_embedding = pc.inference.embed(
      model="multilingual-e5-large",
      inputs=[query],
      parameters={
          "input_type": "query"
      }
  )

  # Search the index for the three most similar vectors
  results = index.query(
      namespace="hsr-relics-namespace",
      vector=query_embedding[0].values,
      top_k=3,
      include_values=False,
      include_metadata=True
  )

  return results
The function above takes a user’s query as input, converts it into a vector embedding using Pinecone’s inference endpoint, and then uses that embedding to search the index, returning the top three most similar relic sets along with their metadata.
Relic Recommendations with Pinecone and Gemini
With the integration with Pinecode, we design the initial prompt to pick relevant relic sets from Pinecone. After that, we take the results from Pinecone and combine them with the initial prompt to create a richer, more informative prompt for Gemini, as shown in the following code.
from google.generativeai.generative_models import GenerativeModel
for character_name, (character_avatar_image_url, character_description) in character_relics_mapping.items(): print(f"Processing Character: {character_name}")
prompt = f"User Query: {character_query}\n\nRelevant Relic Sets:\n" for match in pinecone_response['matches']: prompt += f"* {match['id']}: {match['metadata']['text']}\n" # Extract relevant data prompt += "\nBased on the above information, recommend two best relic sets and explain your reasoning. Each character can only equip with either one 4-piece relic or one 2-piece relic with another 2-piece relic. You cannot recommend a combination of 4-piece and 2-piece together. Consider the user's query and the characteristics of each relic set."
The code shows that we are doing both prompt engineering (designing the initial query to get relevant relics) and context framing (combining the initial query with the retrieved relic information to get a better overall recommendation from Gemini).
First the code retrieves data about the player’s characters, including their descriptions, images, and relics the characters currently are wearing. The code then gathers potentially relevant data about each character from a separate data source character_profile which has more information, such as gameplay mechanic about the characters that we got from the Game8 Character List. With the character data, the query will find similar relic sets in the Pinecone database.
After Pinecone returns matches, the code constructs a detailed prompt for the Gemini model. This prompt includes the character’s description, relevant relic sets found by Pinecone, and crucial instructions for the model. The instructions emphasise the constraints of choosing relic sets: either a 4-piece set, or two 2-piece sets, not a mix. Importantly, it also tells Gemini to consider the character’s existing profile and to prioritise fitting relic sets.
Finally, the code sends this detailed prompt to Gemini, receiving back the recommended relic sets.
Knight of Purity Palace, is indeed a great option for Gepard!
Using LLMs like Gemini is sure exciting, but figuring out what is happening “under the hood” can be tricky.
If you are a web developer, you are probably familiar with Grafana dashboards. They show you how your web app is performing, highlighting areas that need improvement.
Langtrace is like Grafana, but specifically for LLMs. It gives us a similar visual overview, tracking our LLM calls, showing us where they are slow or failing, and helping us optimise the performance of our AI app.
Traces for the Gemini calls are displayed individually.
Langtrace is not only useful for tracing our LLM calls, it also offers metrics on token counts and costs, as shown in the following screenshot.
Building this Honkai: Star Rail (HSR) relic recommendation system is a rewarding journey into the world of Gemini and LLMs.
I am incredibly grateful to Martin Andrews and Sam Witteveen for their inspiring Gemini Masterclass at Google DevFest in Singapore. Their guidance helped me navigate the complexities of LLM development, and I learned firsthand the importance of careful prompt engineering, the power of system instructions, and the need for dynamic data access through function calls. These lessons underscore the complexities of developing robust LLM apps and will undoubtedly inform my future AI projects.
Building this project is an enjoyable journey of learning and discovery. I encountered many challenges along the way, but overcoming them deepened my understanding of Gemini. If you’re interested in exploring the code and learning from my experiences, you can access my Colab notebook through the button below. I welcome any feedback you might have!