
In our previous post, we introduced SilverVector as a “Day 0” dashboard prototyping tool. Today, we are going to show you exactly how powerful that can be by applying it to a real-world, complex open-source CMS: Orchard Core.
Orchard Core is a fantastic, modular CMS built on ASP.NET Core. It is powerful, flexible, and used by enterprises worldwide. However, because it is so flexible, monitoring it on dashboard like Grafana can be a challenge. Orchard Core stores content as JSON documents, which means “simple” questions like “How many articles did we publish today?” often require complex queries or custom admin modules.
With SilverVector, we solved this in seconds.

The “Few Clicks” Promise
Usually, building a dashboard for a CMS like Orchard Core involves:
- Installing a monitoring plugin (if one exists).
- Configuring Prometheus exporters.
- Building panels manually in Grafana.
With SilverVector, we took a different approach. We simply asked: “What does the database look like?”
We took the standard SQL file containing Orchard Core DDL, i.e the script that creates the database tables used in the CMS. We did not need to connect to a live server. We also did not need API keys. We just needed the schema.
We taught SilverVector to recognise the signature of an Orchard Core database.
- It sees
ContentItemIndex? It knows this is an Orchard Core CMS; - It sees
UserIndex? It knows there are users to count; - It sees
PublishedUtc? It knows we can track velocity.
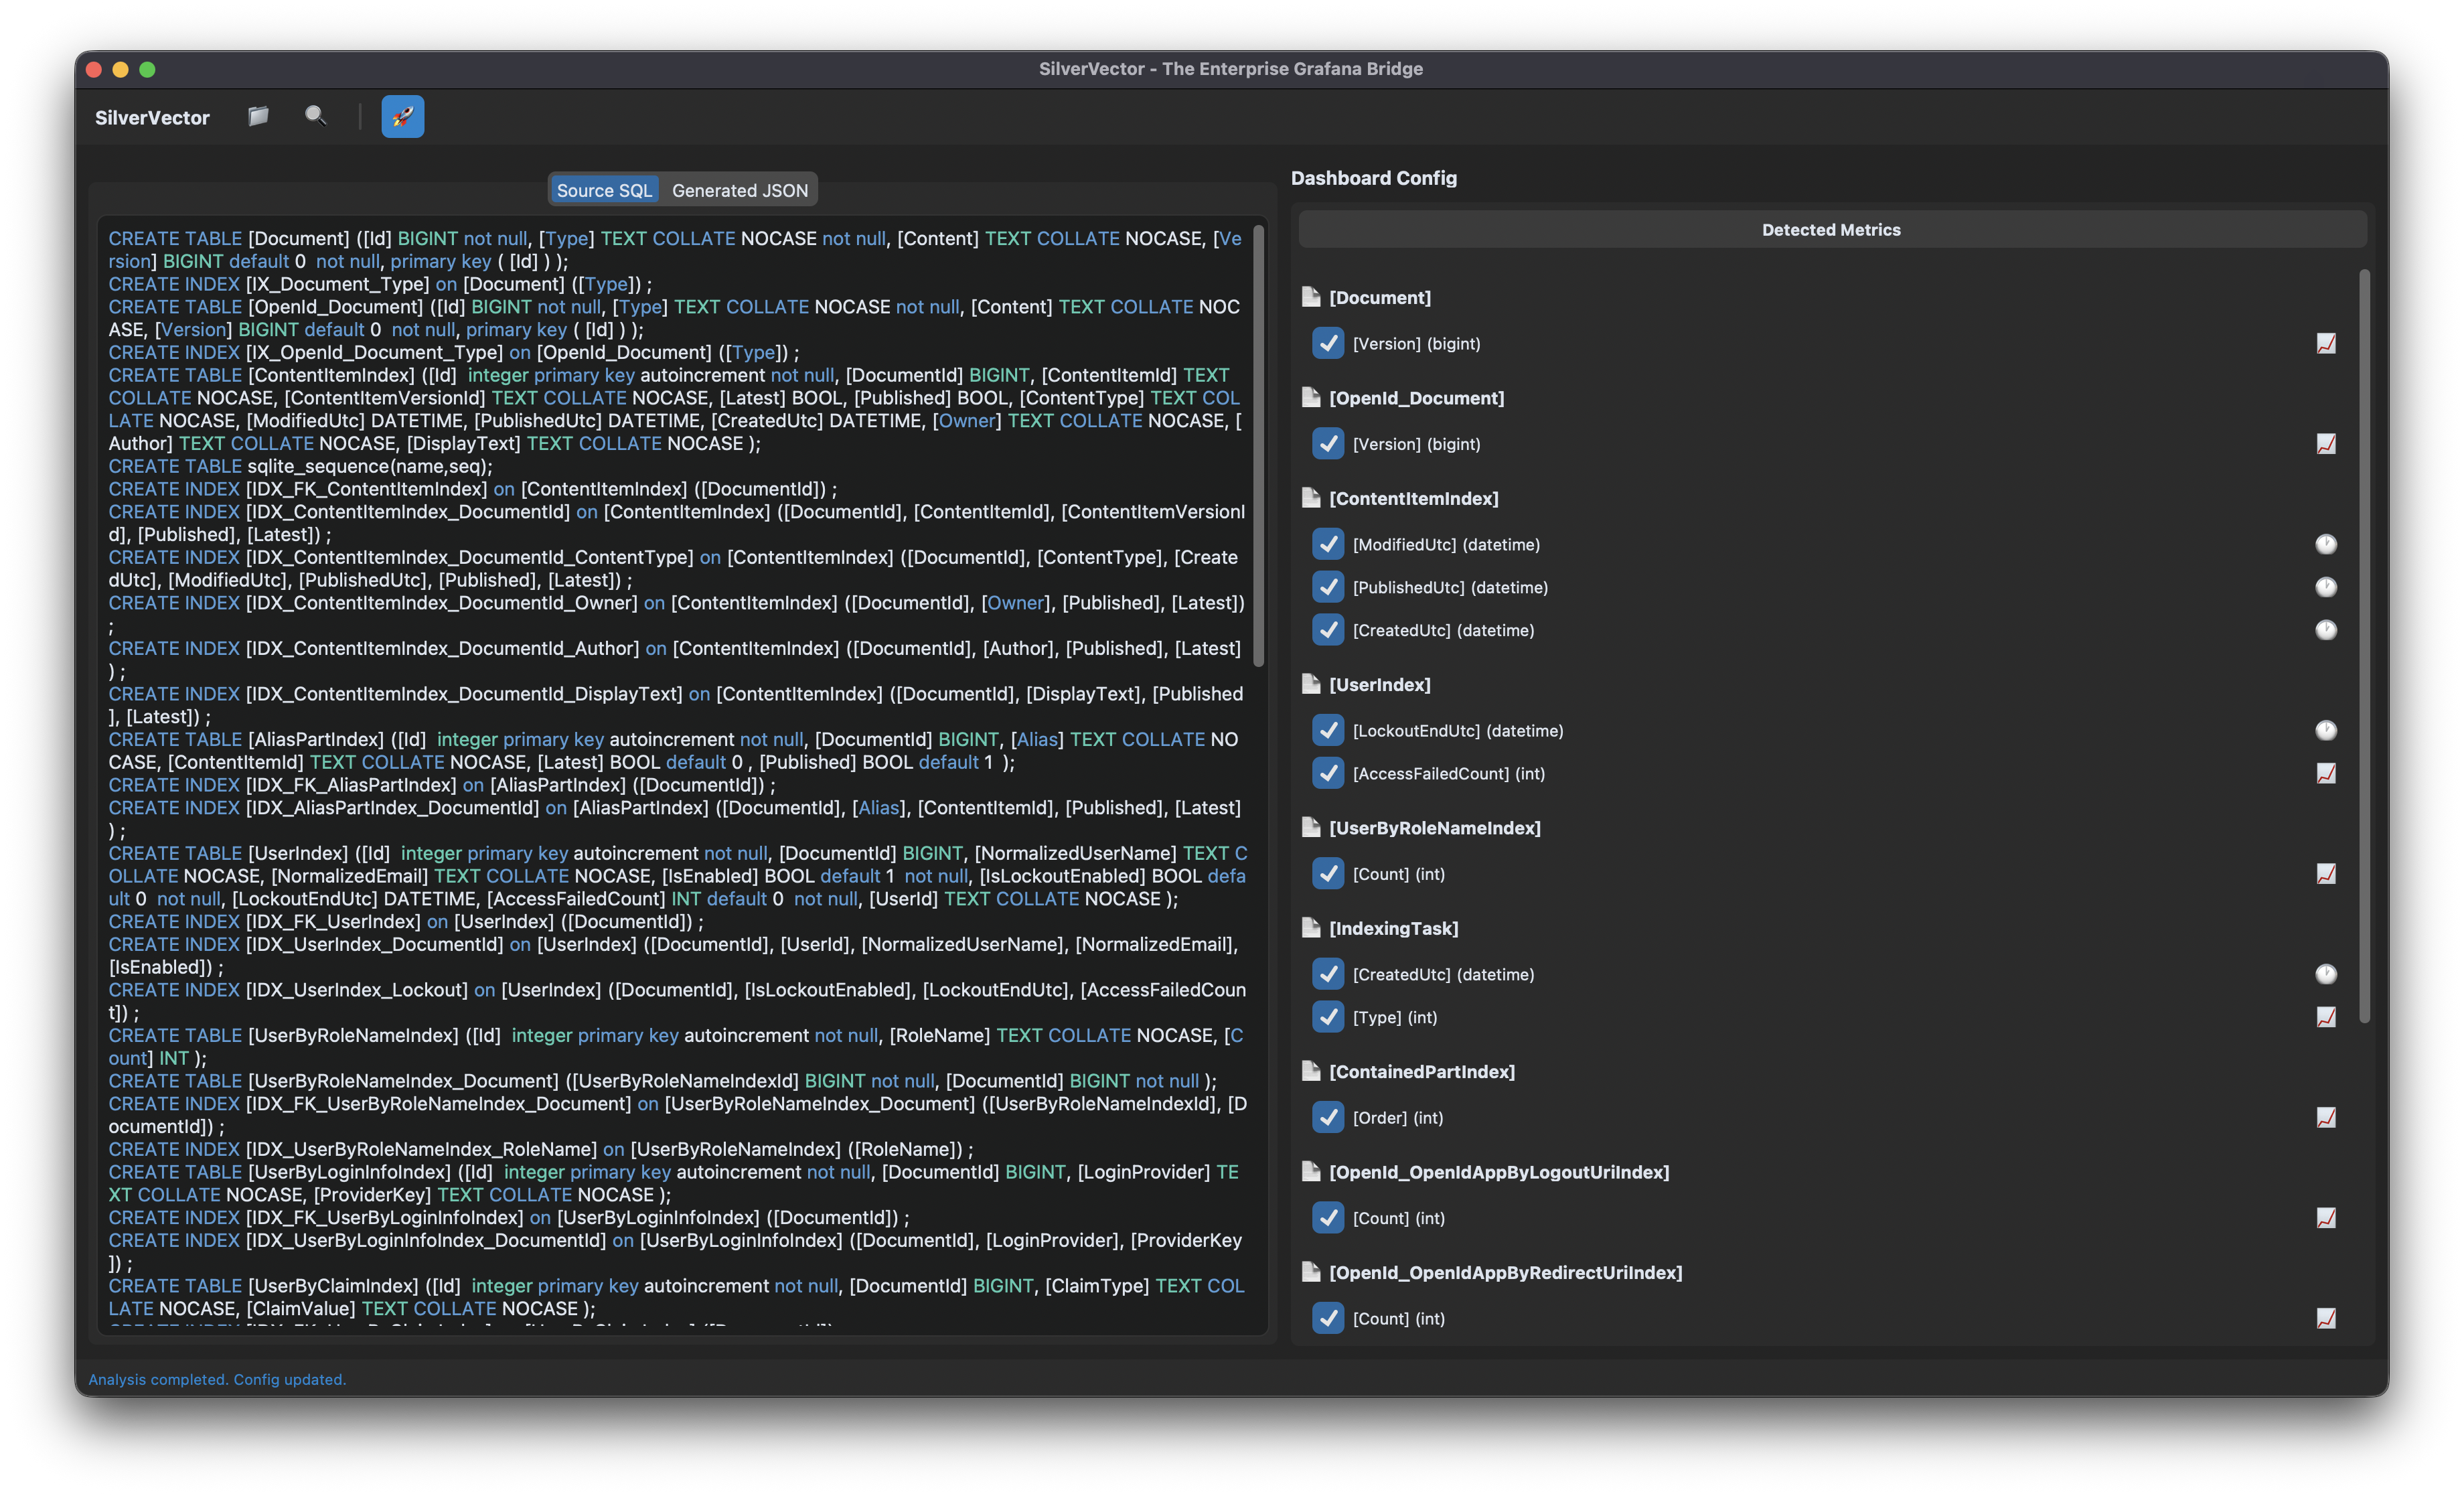
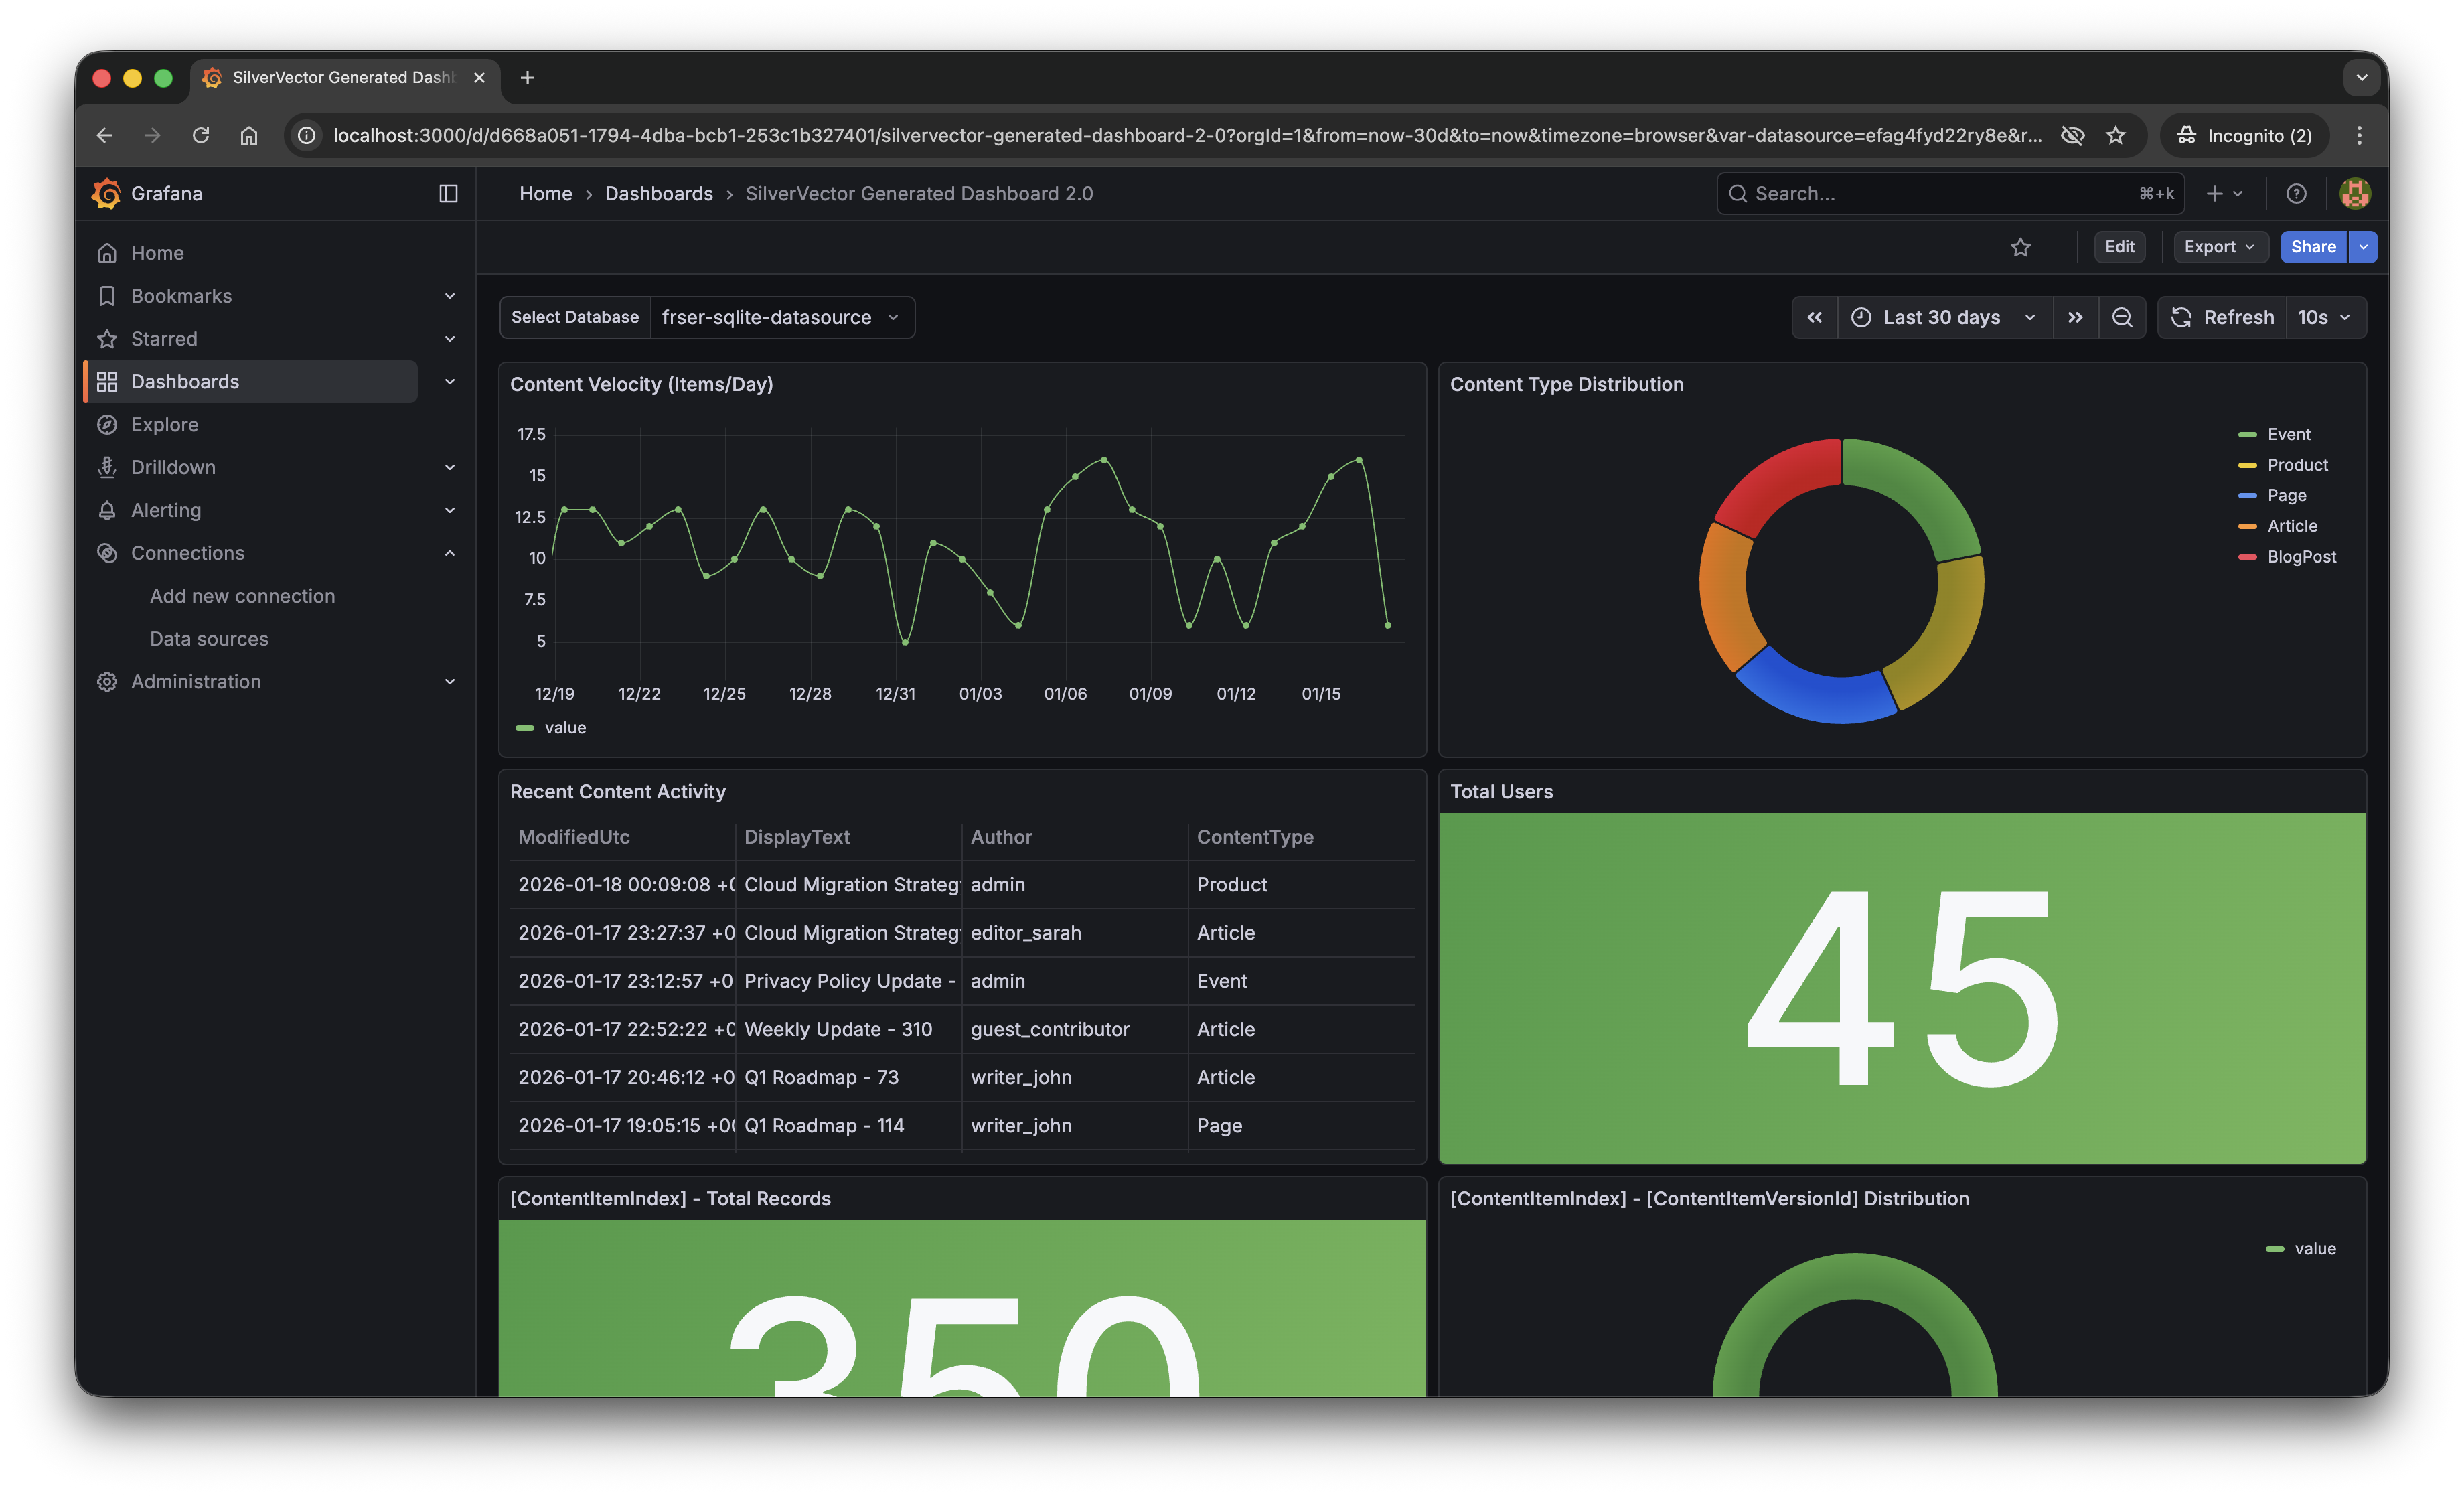
With a single click of the “blue rocket” button, SilverVector generated a JSON dashboard pre-configured with:
- Content Velocity: A time-series graph showing publishing trends over the last 30 days.
- Content Distribution: A pie chart breaking down content by type (Articles, Products, Pages).
- Recent Activity: A detailed table of who changed what and when.
- User Growth: A stat panel showing the total registered user base.
Why This Matters for Orchard Core Developers
This is not just about saving 10 minutes of clicking to setup the initial Grafana dashboard. It is about empowerment.
As Orchard Core developers, you do not need to commit to a complex observability stack just to see if it is worth it. You can generate this dashboard locally, just as demonstrated above, point it at a backup of your production database, and instantly show your stakeholders the value of your work.
For many small SMEs in Singapore and Malaysia, as shared in our earlier post, the barrier of deploying observability stack is not just technical but it is survival. They are often too busy worrying about the rent of this month to invest time in a complex tech stack they do not fully understand. SilverVector lowers that barrier to minimal.
SilverVector gives you the foundation. We generate the boring boilerplate, i.e. the grid layout, the panel IDs, the basic SQL queries. Once you have that JSON, you are free to extend it! For example, you want to add CPU Usage? Just add a panel for your server metrics. Want to track Page Views? Join it with your IIS/Nginx logs.
In addition, since we rely on standard SQL indices such as ContentItemIndex, this dashboard works on any Orchard Core installation that uses a SQL database (SQL Server, SQLite, PostgreSQL, MySQL). You do not need to install a special module in your CMS application code.
A Call to Action
We believe the “Day 0” of observability should not be hard. It should be a default.
If you are an Orchard Core developer, try SilverVector today. Paste in your DDL, generate the dashboard, and see your Orchard Core CMS in a whole new light.
SilverVector is open source. Fork it, tweak the detection logic, and help us build the ultimate “Day 0” dashboard tool for every developer.
Check out the open-source project on GitHub: SilverVector Repository.
