In the world of data visualisation, Grafana is the leader. It is the gold standard for observability, used by industry leaders to monitor everything from bank transactions to Mars rovers. However, for a local e-commerce shop in Penang or a small digital agency in Singapore, Grafana can feel like bringing a rocket scientist tool to cut fruits because it is powerful, but perhaps too difficult to use.
This is why we build SilverVector.
Why SilverVector?
In Malaysia and Singapore, SMEs are going digital very fast. However, they rarely have a full DevOps team. Usually, they just rely on The Solo Engineer, i.e. the freelancer, the agency developer, or the “full-stack developer” who does everything.
A common mistake in growing SMEs is asking full-stack developers to build meaningful business insights. The result is almost always a custom-coded “Admin Panel”.
While functional, these custom tools are hidden technical debt:
- High Maintenance: Every new metric requires a code change and a deployment;
- Poor Performance: Custom dashboards are often unoptimised;
- Lack of Standards: Every internal tool looks different.

SilverVector allows you to skip building the internal tool entirely. By treating Grafana as your GUI layer, you get a standardised, performant, and beautiful interface for free. You supply the SQL and Grafana handles the rendering.
In addition, to some of the full-stack developers, building a proper Grafana dashboard from scratch involves hours of repetitive GUI clicking.
For an SME, “Zero Orders in the last hour” is not just a statistic. Instead, it is an emergency. SilverVector focuses on this Operational Intelligence, helping backend engineers visualise their system health easily.
Why not just use Terraform?
Terraform (and GitOps) is the gold standard for long-term maintenance. But terraform import requires an existing resource. SilverVector acts as the prototyping engine. It helps us in Day 0, i.e. getting us from “Zero” to “First Draft” in a few seconds. Once the client approves the dashboard, we can export that JSON into our GitOps workflow. We handle the chaotic “Drafting Phase” so our Terraform manages the “Stable Phase.”
Another big problem is trust. In the enterprise world, shadow IT is a nightmare. In the SME world, managers are also afraid to give API keys or database passwords to a tool they just found on GitHub.
SilverVector was built on a strict “Zero-Knowledge” principle.
- We do not ask for database passwords;
- We do not ask for API keys;
- We do not connect to your servers.
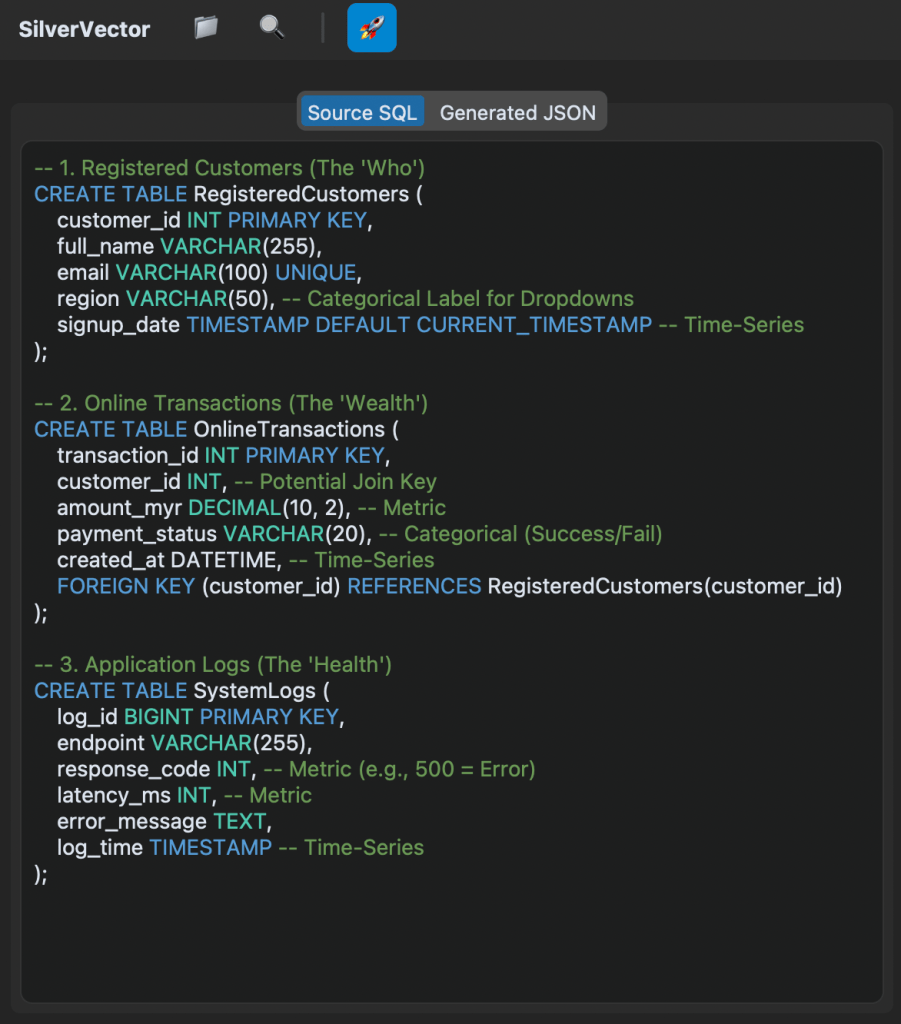
We only ask for one safe thing: Schema (DDL). By checking the structure of your data (like CREATE TABLE orders...) and not the meaningful data itself, we can generate the dashboard configuration file. You take that file and upload it to your own Grafana yourself. We never connect to your production environment.
Key Technical Implementation
Building this tool means we act like a translator: SQL DDL -> Grafana JSON Model. Here is how we did it.
We did not use a heavy full SQL engine because we are not trying to be a database. We simply want to be a shortcut.
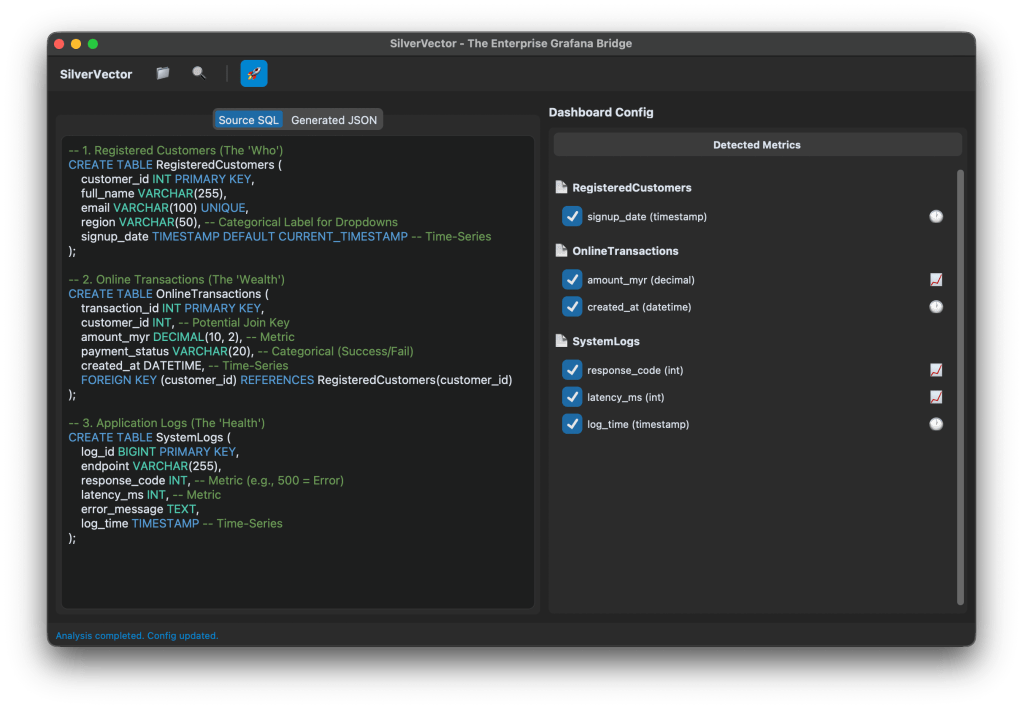
We built SilverVectorParser using regex and simple logic to solve the “80/20” problem. It guesses likely metrics (e.g., column names like amount, duration) and dimensions. However, regex is not perfect. That is why the Tooling matters more than the Parser. If our logic guesses wrong, you do not have to debug our python code. You just uncheck the box in the UI.
The goal is not to be a perfect compiler. Instead, it is to be a smart assistant that types the repetitive parts for you.
For the interface, we choose CustomTkinter. Why a desktop GUI instead of a web app?
It comes down to Speed and Reality.
- Offline-First: Network infrastructure in parts of Malaysia, from remote industrial sites in Sarawak to secure server basements in Johor Bahru can be spotty. This is critical for engineers deploying to Self-Hosted Grafana (OSS) instances where Internet access is restricted or unavailable;
- Zero Configuration: Connecting a tool to your Grafana API requires generating service accounts, copying tokens, and configuring endpoints. It is tedious. SilverVector bypasses this “configuration tax” by generating a standard JSON file when you can just generate, drag, and drop.
- Human-in-the-Loop: A command-line tool runs once and fails if the regex is wrong. Our UI allows you to see the detection and correct it instantly via checkboxes before generating the JSON.
To make the tool feel like a real developer product, we integrate a proper code experience. We use pygments to read both the input SQL and the output JSON. We then map those tokens to Tkinter text tags colours. This makes it look familiar, so you can spot syntax errors in the input schema easily.
Technical Note:
To ensure the output actually works when you import it:
- Datasources: We set the Data Source as a Template Variable. On import, Grafana will simply ask you: “Which database do you want to use?” You do not need to edit the JSON helper IDs manually.
- Performance: Time-series queries automatically include time range clauses (using
$__fromand$__to). This prevents the dashboard from accidentally scanning your entire 10-year history every time you refresh; - SQL Dialects: The current version uses SQLite for the local demo so anyone can test it immediately without spinning up Docker containers.
Future-Proofing for Growth
SilverVector is currently in its MVP phase, and the vision is simple: Productivity.
If you are a consultant or an engineer who has to set up observability for many projects, you know the pain of configuring panel positions manually. SilverVector is the painkiller. Stop writing thousands of lines of JSON boilerplate. Paste your schema, click generate, and spend your time on the queries that actually matter.
A sensible question that often comes up is: “Is this just a short-term fix? What happens when I hire a real team?”
The answer lies in Standardisation.
SilverVector generates standard Grafana JSON, which is the industry default. Since you own the output file, you will never be locked in to our tool.
- Ownership: You can continue to edit the dashboard manually in Grafana OSS or Grafana Cloud as your requirements change;
- Scalability: When you eventually hire a full DevOps engineer or migrate to Grafana Cloud, the JSON generated by SilverVector is fully compatible. You can easily convert it into advanced Code (like Terraform) later. We simply do the heavy lifting of writing the first 500 lines for them;
- Stability: By building on simple SQL principles, the dashboard remains stable even as your data grows.
In addition, since SilverVector generates SQL queries that read from your database directly, you must be a responsible engineer to ensure your columns (especially timestamps) are indexed properly. A dashboard is only as fast as the database underneath it!
In short, we help you build the foundation quickly so you can renovate freely later.
Check out the open-source project on GitHub: SilverVector Repository.


