In cloud infrastructure, the ultimate challenge is building systems that are not just resilient, but also radically efficient. We cannot afford to provision hardware for peak loads 24/7 because it is simply a waste of money.
In this article, I would like to share how to keep this balance using AWS burstable instances, Grafana observability, and discrete event simulation. Here is the blueprint for moving from seconds to milliseconds without breaking the bank.
The Power (and Risk) of Burstable Instances
To achieve radical efficiency, AWS offers the T-series (like T3 and T4g). These instances allow us to pay for a baseline CPU level while retaining the ability to “burst” during high-traffic periods. This performance is governed by CPU Credits.
Modern T3 instances run on the AWS Nitro System, which offloads I/O tasks. This means nearly 100% of the credits we burn are spent on our actual SQL queries rather than background noise.
By default, Amazon RDS T3 instances are configured for “Unlimited Mode”. This prevents our database from slowing down when credits hit zero, but it comes with a cost: We will be billed for the Surplus Credits.
The Experiment: Designing the Stress Test
To truly understand how these credits behave under pressure, we built a controlled performance testing environment.
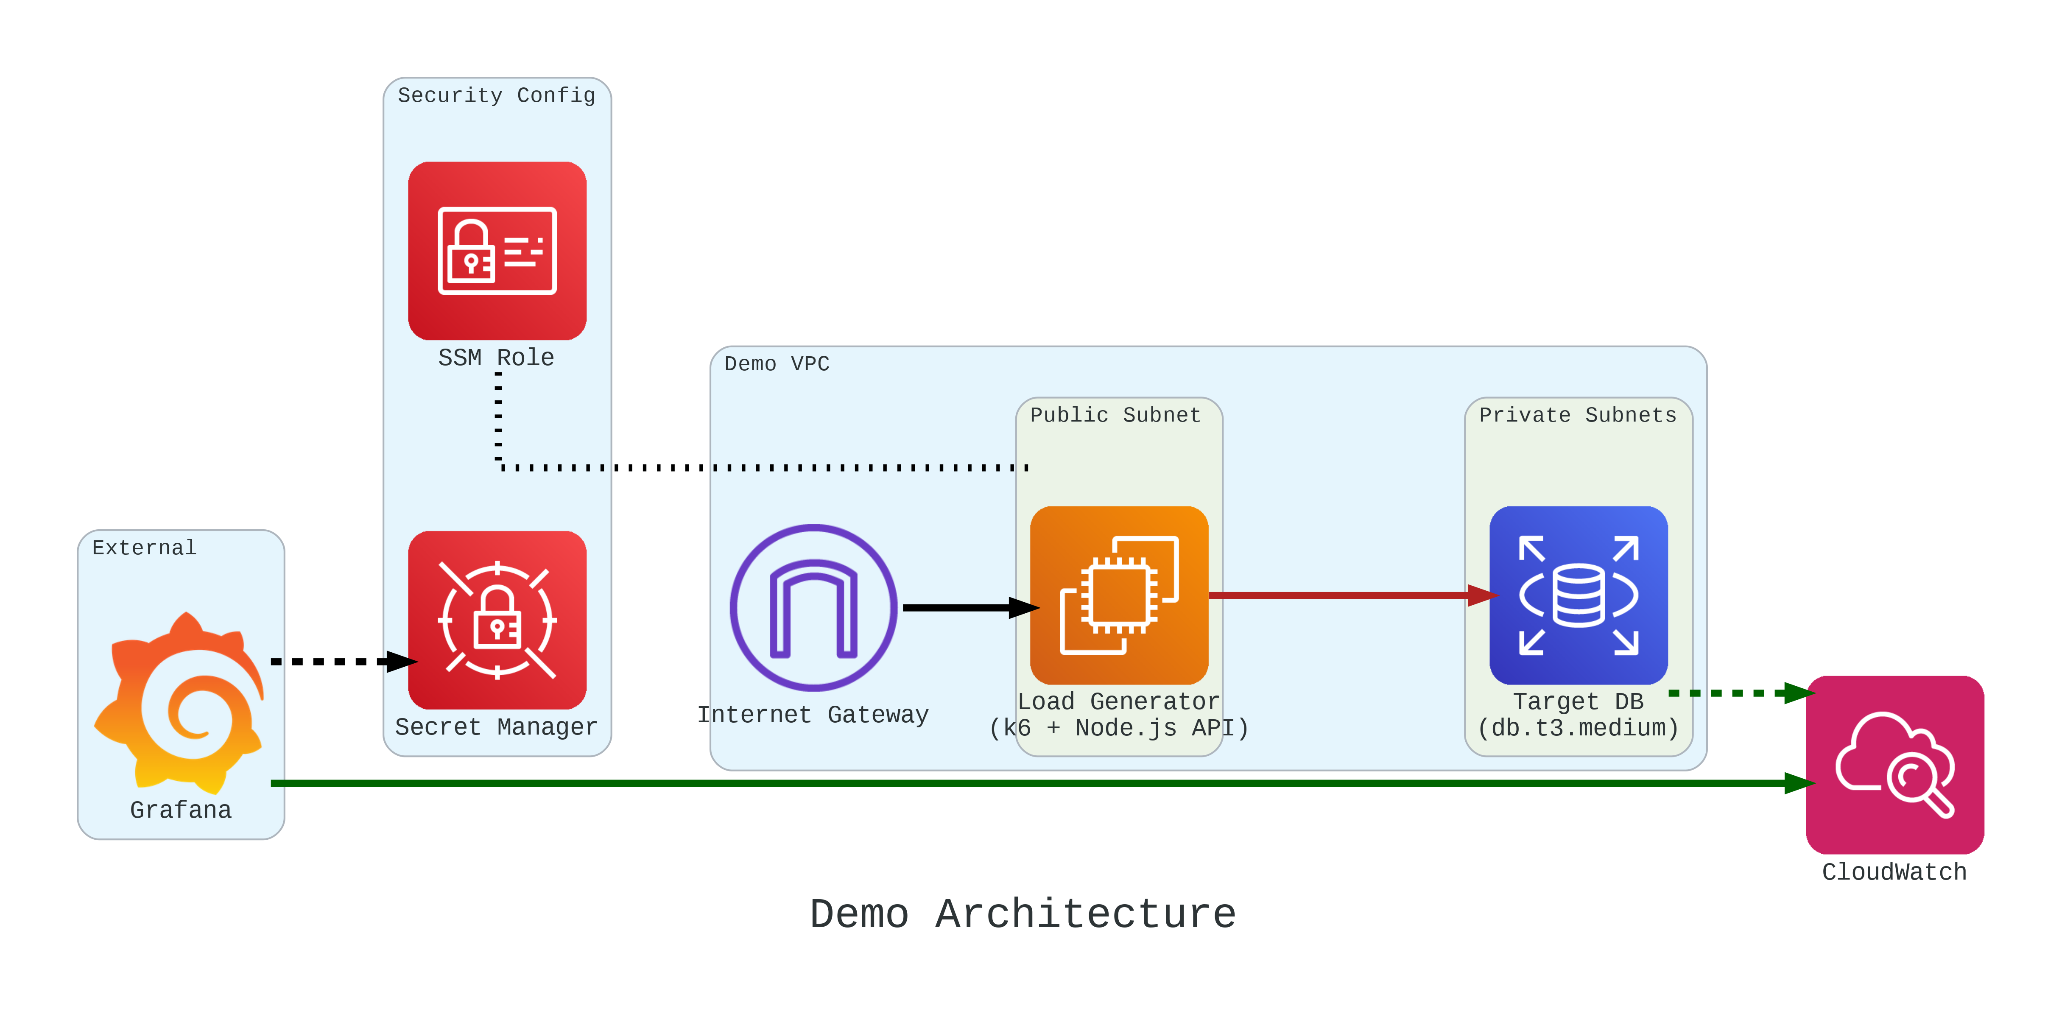
Our setup involved:
- The Target: An Amazon RDS db.t3.medium instance.
- The Generator: An EC2 instance running k6. We chose k6 because it allows us to write performance tests in JavaScript that are both developer-friendly and incredibly powerful.
- The Workload: We simulated 200 concurrent users hitting an API that triggered heavy, CPU-bound SQL queries.
Simulation Fidelity with Micro-service
If we had k6 connect directly to PostgreSQL, it would not look like real production traffic. In order to make our stress test authentic, we introduce a simple NodeJS micro-service to act as the middleman.
This service does two critical things:
- Implements a Connection Pool: Using the
pglibraryPoolwith amax: 20setting, it mimics how a real-world app manages database resources; - Triggers the “Heavy Lifting”: The
/heavy-queryendpoint is designed to be purely CPU-bound. It forces the database to perform 1,000,000 calculations per request using nestedgenerate_series.
const express = require('express');
const { Pool } = require('pg');
const app = express();
const port = 3000;
const pool = new Pool({
  user: 'postgres',
  host: '${TargetRDS.Endpoint.Address}',
  database: 'postgres',
  password: '${DBPassword}',
  port: 5432,
  max: 20,
  ssl: { rejectUnauthorized: false }
});

app.get('/heavy-query', async (req, res) => {
  try {
    const result = await pool.query('SELECT count(*) FROM generate_series(1, 10000) as t1, generate_series(1, 100) as t2');
    res.json({ status: 'success', data: result.rows[0] });
  } catch (err) {
    res.status(500).json({ error: err.message }); }
  });

app.listen(port, () => console.log('API listening'));
In our k6 load test, we do not just flip a switch. We design a specific three-stage lifecycle for our RDS instance:
- Ramp Up: We started with a gradual ramp-up from 0 to 50 users. This allows the connection pool to warm up and ensures we are not seeing performance spikes just from initial handshakes;
- High-load Burn: We push the target to 200 concurrent users. These users will be hitting a
/heavy-queryendpoint that forces the database to calculate a million rows per second. This stage is designed to drain theCPUCreditBalanceand prove that “efficiency” has its limits; - Ramp Down: Finally, we ramp back down to zero. This is the crucial moment in Grafana where we watch to see if the CPU credits begin to accumulate again or if the instance remains in a “debt” state.
import http from 'k6/http';
import { check, sleep } from 'k6';

export const options = {
  stages: [
    { duration: '30s', target: 50 },      // Profile 1: Ramp up
    { duration: '5m', target: 200 },      // Profile 1: Burn
    { duration: '1m', target: 0 },        // Profile 1: Ramp down
  ],
};

export default function () {
  const res = http.get('http://localhost:3000/heavy-query');
  check(res, { 'status was 200': (r) => r.status == 200 });
  sleep(0.1);
}
Monitoring with Grafana
If we are earning CPU credits slower than we are burning them, we are effectively walking toward a performance (or financial) cliff. To be truly resilient, we must monitor our CPUCreditBalance.
We use Grafana to transform raw CloudWatch signals into a peaceful dashboard. While “Unlimited Mode” keeps the latency flat, Grafana reveals the truth: Our credit balance decreases rapidly when CPU utilisation goes up to 100%.

Predicting the Future with Discrete Event Simulation
Physical load testing with k6 is essential, but it takes real-time to run and costs real money for instance uptime.
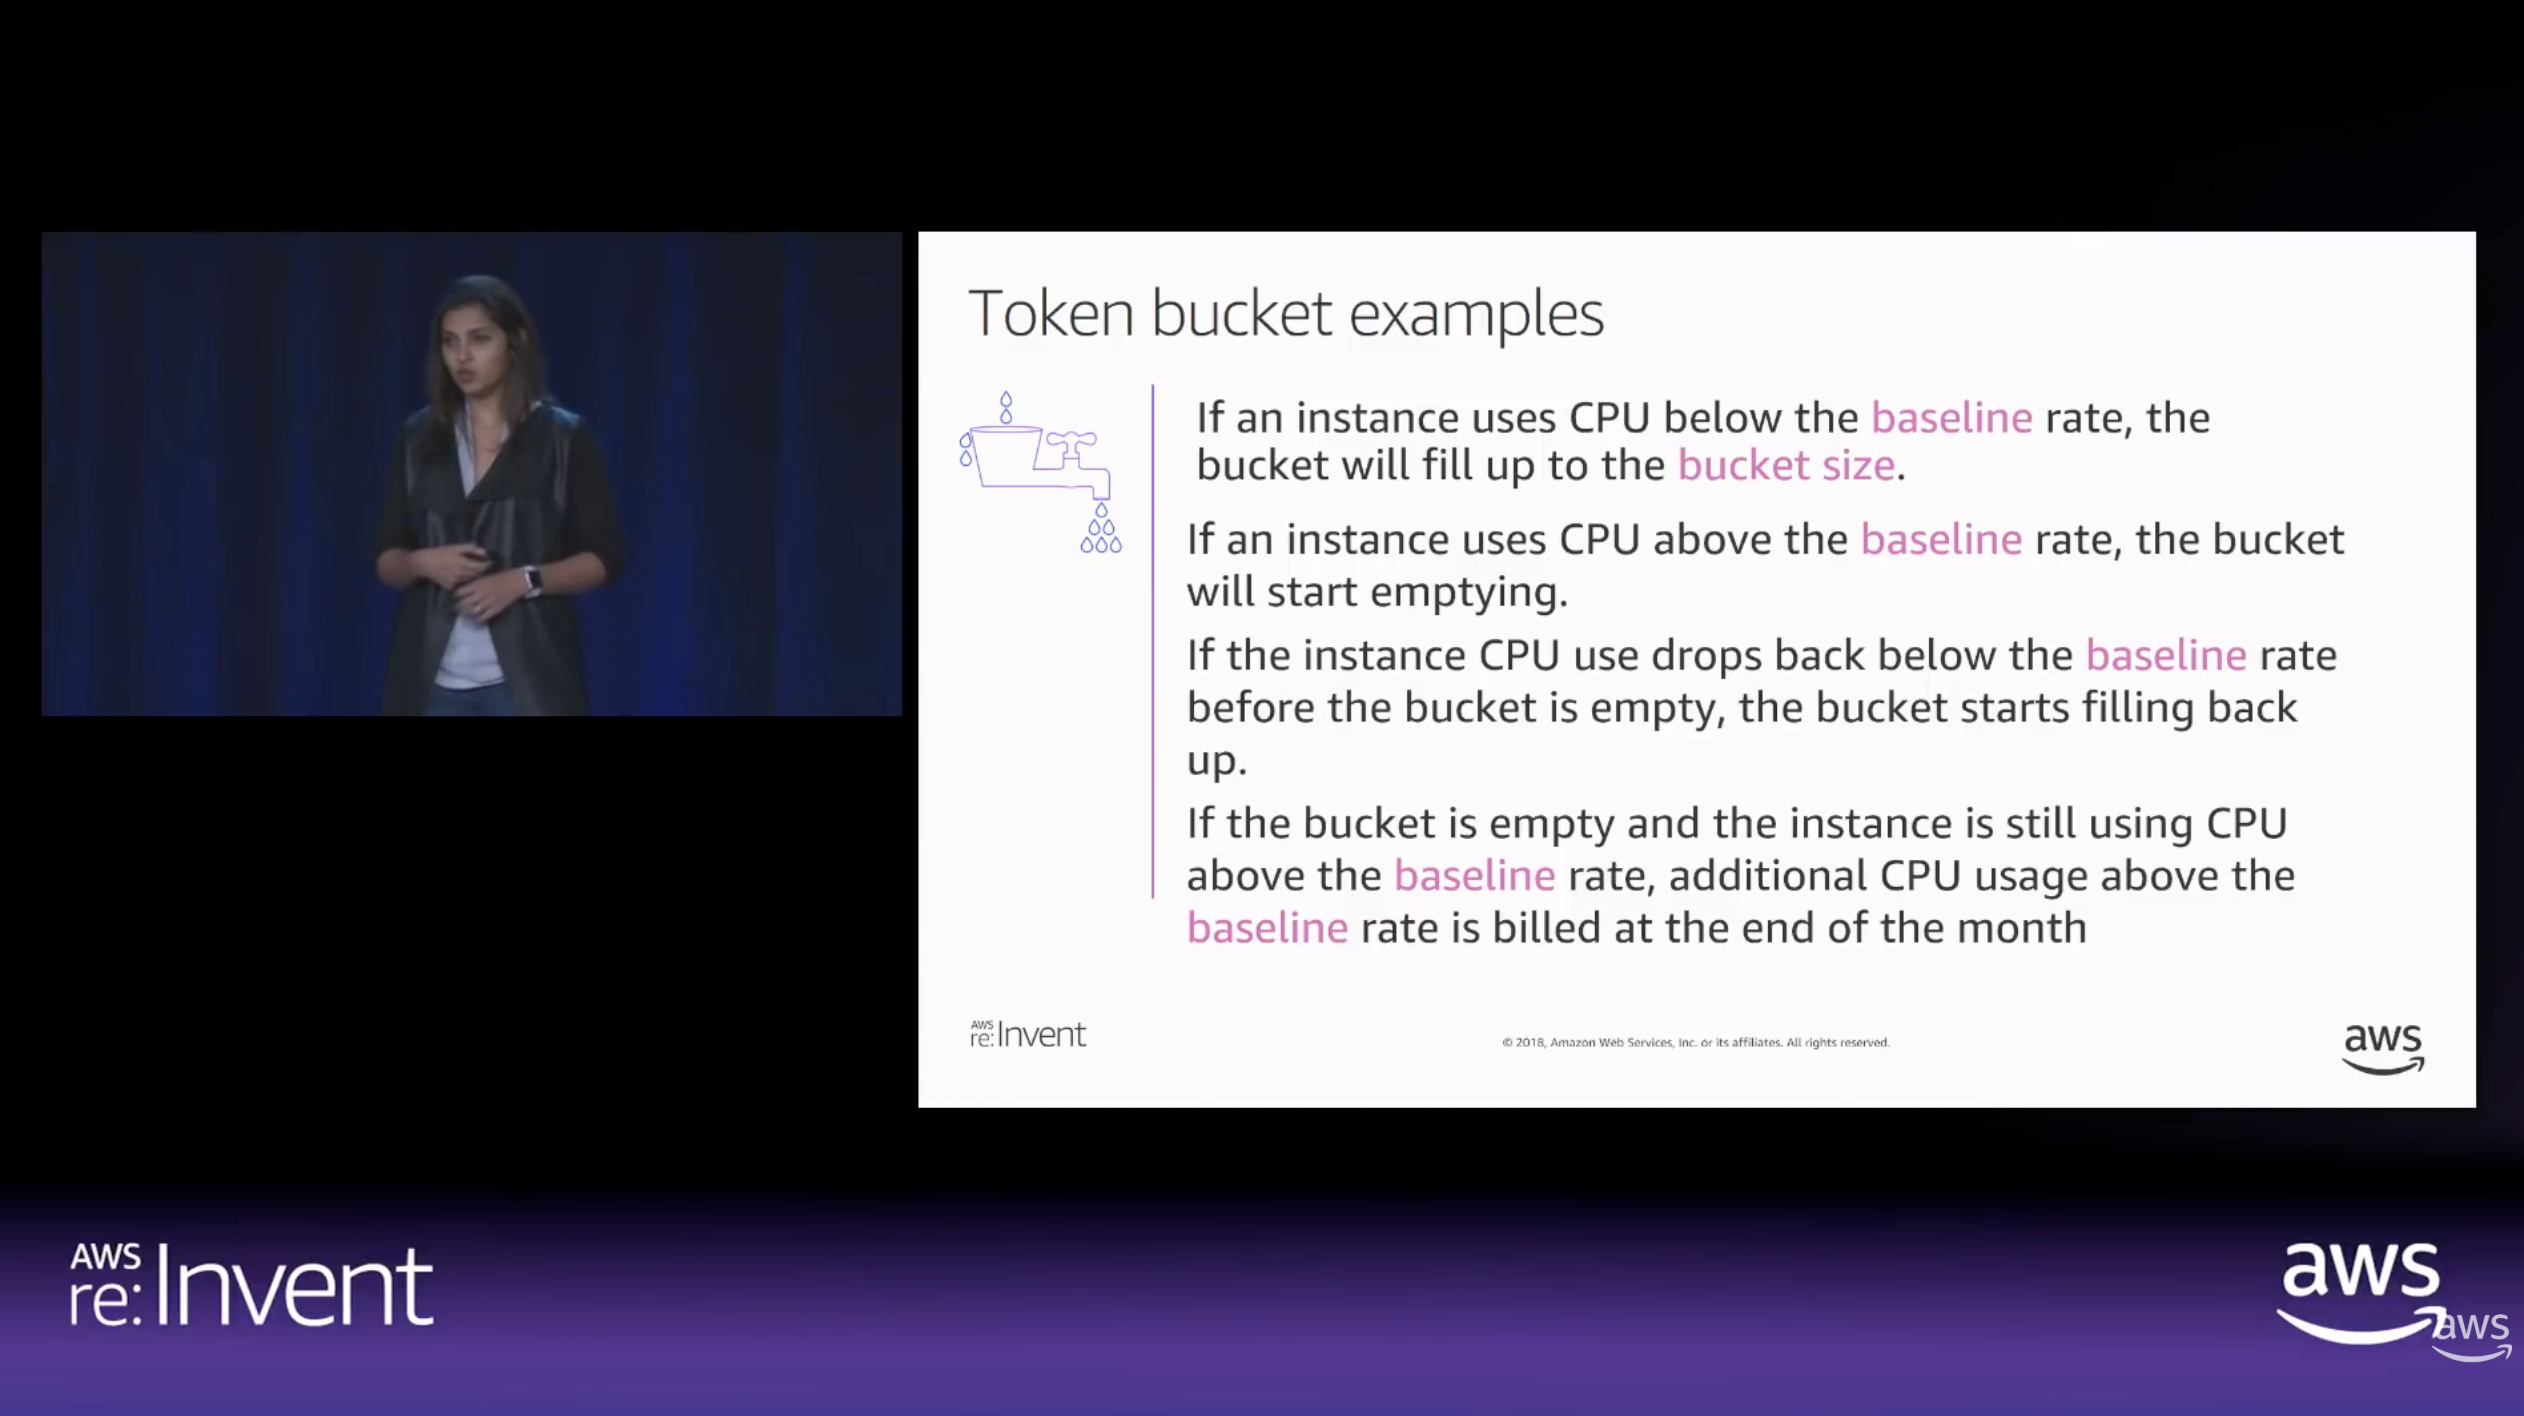
To solve this, we modelled Amazon RDS T3 instance using discrete event simulation and the Token Bucket Algorithm. Using the SNA library, a lightweight open-source library for C# and .NET, we can now:
- Simulate a 24-hour traffic spike in just a few seconds;
- Mathematically prove whether a rds.t3.medium is more cost-effective for a specific workload;
- Predict exactly when an instance will run out of credits before we ever deploy it.

Final Thoughts
Efficiency is not just about saving money. Instead, it is about understanding the mathematical limits of our architecture. By combining AWS burstable instances with deep observability and predictive discrete event simulation, we can build systems that are both lean and unbreakable.
For those interested in the math behind the simulation, check out the SNA Library on GitHub.
