Last week, one of our web apps seemed to be running slow. Thus, we decided to diagnose the web app which was hosted on Azure App Service. Fortunately, there is a smart chatbot in Azure App Service that helps us to troubleshoot our web app.
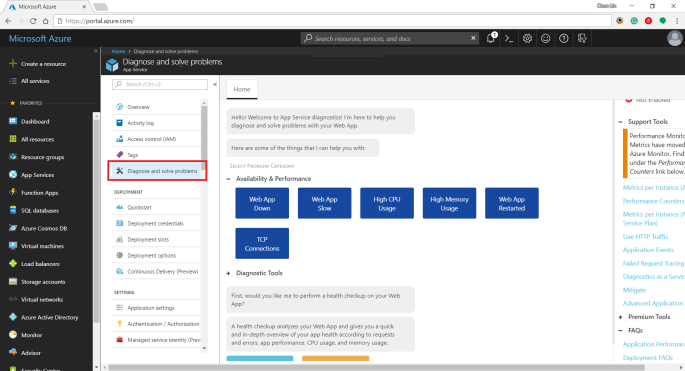
The diagnostics chatbot can be found under “Diagnose and solve problems” page of the web app. The chatbot suggested that it can help us with checking the following issues.
- Web App Down;
- Web App Slow;
- High CPU Usage;
- High Memory Usage;
- Web App Restarted;
- TCP Connections.

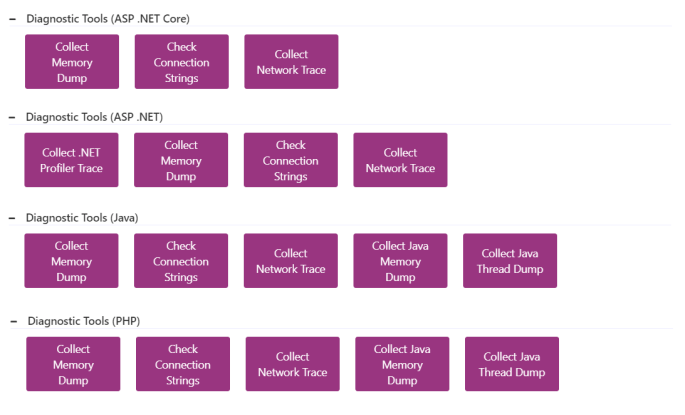
In addition, it also provides a set of Diagnostic Tools for famous software stacks on Azure App Services, such as ASP .NET Core, ASP .NET, Java, and PHP.

Health Checkup
The chatbot says quite many things in the first run. So if we continue to scroll down to the bottom, we will realize that the Diagnostics chatbot also recommends us to run a Health Checkup on our web app first to give us a summary about its requests, errors, performance, CPU usage, and memory usage.
For example, the following graph shows that my web app was experiencing HTTP server errors where a report about the errors was attached. In the report, it listed down errors happened during that period of time with affected URLs.
Sometimes, if there is a common solution available to the problems, troubleshooting steps will be listed down to help us to better fix the errors too.
The “App Performance” diagram basically shows us how much the server took to respond in the period of time. If the web app is performing slow, sometimes it will recommend us to collect a memory dump to identify the root cause of the issue.
The “CPU Usage” has diagram showing the overall CPU usage per instance. If there is any high CPU detected in the last 24 hours, there will be a warning displayed too.
For “Memory Usage” tab, it will provide us diagrams to show the following numbers.
- Page Operations: A rate at which the disk was read to resolve hard page faults per second.
- Overall Percent Physical Memory Usage: The overall percent memory in use by both system and the application on each instance.
- Application Percent Physical Memory Usage: The percent physical memory usage of each application on an instance.
- Committed Memory Usage: Amount of committed memory, in MB. Committed memory is the physical memory which has space reserved on the disk paging file(s).
TCP Connections Analysis
TCP Connections Analysis is one of the analysis that are not part of the Health Checkup. We can find it under “Availability & Performance” in the chatbot. It basically provides charts showing number of outbound TCP connections per instance in the period of time.
Is My App Restarted?
If we would like to find out if our web app was restarted in a period of time, we can click on the “Web App Restarted” button in the chatbot to find out when and why our web app is restarted.

Connection Strings Checking
There is one more feature that I’d like to highlight is the diagnostic tool that helps to validate all the connection strings configured in our web app. It helps us to identify success vs. failing connection from the instance.
Conclusion
There are still more features available in the Azure App Service Diagnostics chatbot. I only list down features and tools that I use most in my daily development life. So, if you are also on your way to be DevOps, feel free to discover more yourself!
Reference
KOSD, or Kopi-O Siew Dai, is a type of Singapore coffee that I enjoy. It is basically a cup of coffee with a little bit of sugar. This series is meant to blog about technical knowledge that I gained while having a small cup of Kopi-O Siew Dai.
